Patients with major unipolar depression experience periods of spontaneous or treatment-induced remission, during which they typically are symptom free or have only mild, subclinical mood or cognitive symptoms
(1,
2). However, remitted patients, while clinically well, remain vulnerable to illness relapse. A growing literature suggests correlative relationships between greater sensitivity of recovered patients to acute emotional stress and risk for depression relapse and recurrence
(3–
5). While genetics
(6), developmental factors
(7), and stress
(8) are strongly implicated in mechanisms of disease vulnerability, neural correlates of these trait or disease diathesis markers are yet to be characterized.
Functional imaging studies have provided additional perspectives toward understanding neural mechanisms mediating affective symptoms. To date, state effects have been a primary focus, with many studies examining abnormalities during a major depressive episode and after various forms of treatment, with normalization of prefrontal and anterior cingulate abnormalities repeatedly identified
(9–
17). Complementary studies of transient induced sadness in healthy volunteers have provided additional confirmation of state-specific neural changes mediating negative mood
(18–
22). Regional changes in the subgenual cingulate Brodmann’s area 25, prefrontal cortex, anterior insula, and posterior cingulate, exactly mirroring those seen with treatment-facilitated resolution of chronic dysphoria in depressed patients, further point to region-specific state effects that wax and wane with the presence and intensity of sad mood
(14).
Identification of brain changes that define the underlying disease process (trait or disease effects) rather than symptom severity (state effects) has been more difficult, as few studies have examined fully recovered patients without medication. We know of no studies demonstrating regional abnormalities in at-risk individuals before disease presentation. Nonetheless, a role for the medial orbitofrontal cortex
(23–
25) and rostral anterior cingulate
(26,
27) as possible disease markers of major depressive disorder has been suggested by both magnetic resonance imaging (MRI) and postmortem anatomical abnormalities, and persistent resting-state metabolism and blood flow abnormalities, respectively. It is not yet clear, however, whether the volumetric and neuropathological changes in the medial orbital and subgenual prefrontal cortex represent causes or effects of depression
(23–
27). It cannot be concluded that the findings pertaining to persistent rostral anterior cingulate Brodmann’s area 24a are disease trait markers and not a compensatory change precipitated by initial illness onset
(26,
27).
Putative brain mechanisms associated with symptom relapse in patients with unipolar depression have been studied by using acute tryptophan depletion and positron emission tomography (PET) during treatment and after recovery. Depressed patients 6 weeks into a course of antidepressant treatment who experienced a tryptophan-depletion-induced acute relapse exhibited glucose metabolic decreases in the orbitofrontal cortex and thalamus relative to patients without clinical symptoms
(28). A similar approach was used in a [
15O]H
2O PET study in recovered depressed men. Comparable regional cerebral blood flow (rCBF) decreases in the ventral anterior cingulate, orbitofrontal cortex, and caudate were observed with tryptophan-induced relapse, suggesting the critical role of these regions in mediating transient, hyperacute clinical symptoms
(29). A comparable pattern of regional abnormalities is seen in refractory depressed patients
(10,
26,
30) and in patients with depression associated with neurological disorders
(31–
34).
Despite compelling convergence of regional findings, the tryptophan-depletion method appears to precipitate a depressive relapse selectively in acutely depressed patients receiving treatment with selective serotonin reuptake inhibitors (SSRIs) and not in patients taking other classes of antidepressants
(35). It only appears to do so early in the course of treatment, and it does not consistently trigger mood symptoms in depressed patients in full recovery (between episodes) or in nondepressed subjects. In other words, it appears to be a probe of disease relapse linked to a specific neurotransmitter system, not a general test of relapse vulnerability in all patients with unipolar depression (sick and recovered). In contrast, an alternative method of precipitating acute depression symptoms—negative mood induction
(3,
5)—appears to aggravate depressive symptoms and predict relapse in depressed patients in full remission, independent of medication status, and represents a more general and naturalistic model of depression recurrence
(5). Since this approach appears to effectively precipitate mood change in fully recovered patients and in never-depressed subjects, it offers a potentially more robust method to identify trait- or disease-related markers of unipolar depression.
Therefore, in the present study, a mood-provocation technique—memory-induced sadness—and PET were used to identify potential depression trait and state markers in asymptomatic, fully recovered patients. Two alternative hypotheses were tested:
1.
Sad-mood induction in euthymic, recovered, depressed patients results in regional effects similar to those observed in never-depressed healthy subjects, particularly involving the dorsolateral prefrontal cortex and subgenual anterior cingulate (state account).
2.
Sad mood induction in euthymic, depressed patients results in some changes in common with those observed in healthy subjects (state effects) but also involves unique changes that reflect the temporary or transient unmasking of disease or trait marker effects.
To this aim, autobiographical, script-based, sad memories were employed in three groups of patients: an experimental group of remitted unipolar patients, a comparison group of acute unipolar depressed patients (to control for disease effects), and a comparison group of healthy volunteers (to control for state effects). Remitted patients kept receiving optimal antidepressant medication (nine of 10) so as not to precipitate withdrawal or emerging depressive symptoms before the study. To control for the effects of antidepressant medication and therefore to test for “pure” disease effects, the acute depressed group was medication free. Results from the healthy group have been published elsewhere
(14,
21). Here they will be used only as a comparison for the depressed patients’ groups.
Method
Subjects
The experimental group consisted of 10 women (mean age=37 years, SD=9) with a previous DSM-IV diagnosis of major unipolar depression who were currently euthymic and in full remission (mean remission interval=16 months, SD=8). Criteria for inclusion were based on a structured interview performed by a psychiatrist (S.L.B.). Remission was defined as an absence of symptoms (recovery) for a minimum of 6 months with no recurrence
(4). Nine patients were taking maintenance antidepressant medication (six were taking SSRIs only, two were taking SSRIs in combination with other antidepressants, and one was taking another antidepressant), and one was medication free. Inclusion criteria were absence of other primary psychiatric or neurological diagnosis or head injury and no history of substance abuse. Remitted unipolar depressed patients were identified and referred by psychiatrists in the San Antonio area in the course of routine follow-up visits.
Seven women with an active major unipolar depressive episode (mean=42 years, SD=15) who were outpatients at the University of Texas Health Science Center’s San Antonio Mood Disorders Clinic formed the acute depression comparison group. The patients all met DSM-IV criteria for active major depression (in the midst of a major unipolar depression episode) and had no other primary diagnosis of psychiatric or neurological disorders, head trauma, or substance abuse. All had recurrent episodes; none was a first-episode patient. All except one were medication free at the time of the study. All patients completed the 17-item Hamilton Rating Scale for Depression on the day of the PET scanning. The Hamilton depression scale was used to evaluate symptom severity in the acute depression group and the presence of residual symptoms in the remitted group. Hamilton depression scale scores were mean=4.8 (SD=4.9, range=0–15) for the remitted group and mean=21.3 (SD=2.9, range=17–25) for the acutely depressed group. Two patients in the remitted group had a Hamilton depression scale score greater than 7. They did not, however, meet DSM-IV criteria for active depression.
The healthy comparison group consisted of eight women (mean age=36 years, SD=6) with no personal or family history of depression and no history of other psychiatric or neurological disease, head trauma, or substance abuse. None was taking any medication. This group has been the focus of two previous studies
(14,
21).
Mood Provocation
All subjects were asked to prepare in advance short autobiographical narratives of personal events in which they felt particularly sad. Sad scenarios most commonly centered on loss of relatives, friends, or significant relationships
(21). Written informed consent was obtained from all subjects, and all procedures were conducted as approved by the institutional review board of the University of Texas Health Science Center in San Antonio.
Imaging Methods
PET scans were acquired on a GE/Scanditronix 4096 (Uppsala, Sweden) (15 parallel slices, center-to-center interslice distance=6.5 mm, transaxial field of view=10.0 cm) by using measured attenuation correction (68germanium/68gallium transmission scans) and reconstructed with an in-plane resolution of 7 mm, full width at half maximum. CBF was measured by using a bolus [15O]H2O technique (60–65 mCi [15O]H2O dose/scan, [15O]H2O half-life=123 seconds, scan duration=90 seconds).
Subjects were immobilized within the PET scanner by use of individually fitted, thermally molded plastic facial masks
(36) and faced a monitor placed 35 cm from their eyes. An antecubital venous catheter was placed for administration of the blood flow radiotracer.
Each subject underwent a series of measurements of brain blood flow during two tasks: eyes closed and at rest and sad provocation. The order of conditions was counterbalanced across subjects. Of importance, scans were acquired only after the sad emotional state was achieved and not on the basis of a standard interscan interval (10 minutes) for tracer decay. Before each emotional scan, radiotracer synthesis was started when the subject reported an intermediate subjective response (score of 3 or 4). After that, we only injected the dose if the reported subjective response was very intense. Otherwise, injection was postponed and the induction scenario was repeated until it achieved the desired intensity. Similarly, after each emotional scan, radiotracer synthesis was delayed until remnants of previous mood states had cleared (subject score <3).
An anatomical MRI scan was also acquired in each subject for the purposes of spatial transformation of PET data, region-of-interest analysis, and parametric image display (Elscint Gyrex 1.9T-DLX, Haifa, Israel) three-dimensional gradient/recall acquisition in the steady state sequence, TR=33 msec, TE=12 msec, flip angle=60°, volume=256×256×127, spatial resolution=1 mm3).
Mood Induction
Details about the mood-provocation procedure have been reported elsewhere
(21). In brief, before all “sad scans,” scripts were presented on the screen. Subjects were asked to generate a state of sadness comparable to that originally experienced. Every 2 minutes, the subjects were asked to rate their level of sadness, anxiety, and relaxation on a 0–7-point scale. After the desired mood intensity was achieved, subjects closed their eyes and were instructed to stop visualizing, thinking, or ruminating on the script and to focus on their feelings of sadness. After each emotional scan, subjects were engaged in 3–5 minutes of neutral conversation to facilitate return to a baseline euthymic state. All subjects were debriefed after each emotional scan to ensure that they followed the instructions and to inquire about content of the experience, the dominant modality of imagery, and whether they became tearful or experienced intense bodily changes.
PET Data Analysis
All analyses were performed by using previously validated methods and in-house software. Differential patterns of sadness-related changes in the three groups were detected by using change-distribution analysis
(37) and interpreted by using atlas-based coordinates and Brodmann’s areas. Automatic alignment and reslicing of the PET images was first performed to correct for head motion by using a modified version of the Woods et al. algorithm
(38). PET and MRI images were then spatially transformed into proportional bicommissural coordinate space
(39) relative to the 1988 stereotaxic atlas of Talairach and Tournoux
(40). Regional tissue uptake of [
15O]H
2O was globally normalized to a whole-brain rCBF mean, with images scaled to an arbitrary mean of 1,000. Value and spatially normalized images were trilinearly interpolated, resampled (60 slices, 8 mm
3 voxels), and Gaussian filtered to a final resolution of 9.9 mm (full width at half maximum) before statistical analysis.
Pairwise voxel-by-voxel statistical contrasts were performed to identify common and differential regional changes associated with sadness provocation (i.e., sad provocation versus eyes closed and at rest) in the experimental group (remitted group), the acute depressed comparison group, and in the healthy comparison group. Condition-specific, within-subject regional changes were then averaged across individuals. A beta-2 statistic measuring kurtosis of the histogram of the difference image (the change distribution curve) was used as an omnibus test to assess overall significance
(41). The beta-2 test was implemented in MIPS software (Research Imaging Center, San Antonio, Tex.) in a manner similar to the use of the gamma-2 statistic
(37). The beta-2 improves on the gamma-2 by using a better estimate of the degrees of freedom, i.e., the number of resyls in the PET images
(42). The omnibus test was followed by maxima and minima searches to identify local extrema within a search volume measuring 125 mm
3 (43). Last, group mean subtraction images were converted to statistical parametric images of z scores and superimposed on group mean MRI images for the subject group. Locations of focal maxima and minima exceeding a z score of 2.9 (p<0.002) were recorded with the peak voxel (search cube volume=125 mm
3) of each extrema described in x, y, and z coordinates as millimeters relative to the anterior commissure and to the spatial extent in mm
3. To facilitate visualization, data are displayed at a p<0.05 significance level.
A second approach was used to visualize common and unique regional changes associated with sadness provocation between the experimental group (remitted depressed) and each of the comparison groups (healthy volunteers and acute depressed patients). Pairwise, between groups, voxel-by-voxel contrasts of significant sadness-related changes were carried out separately for rCBF increases or decreases (logical contrasts). The threshold for significance was a z score of 1.96 (p<0.05).
Results
Behavioral Effects
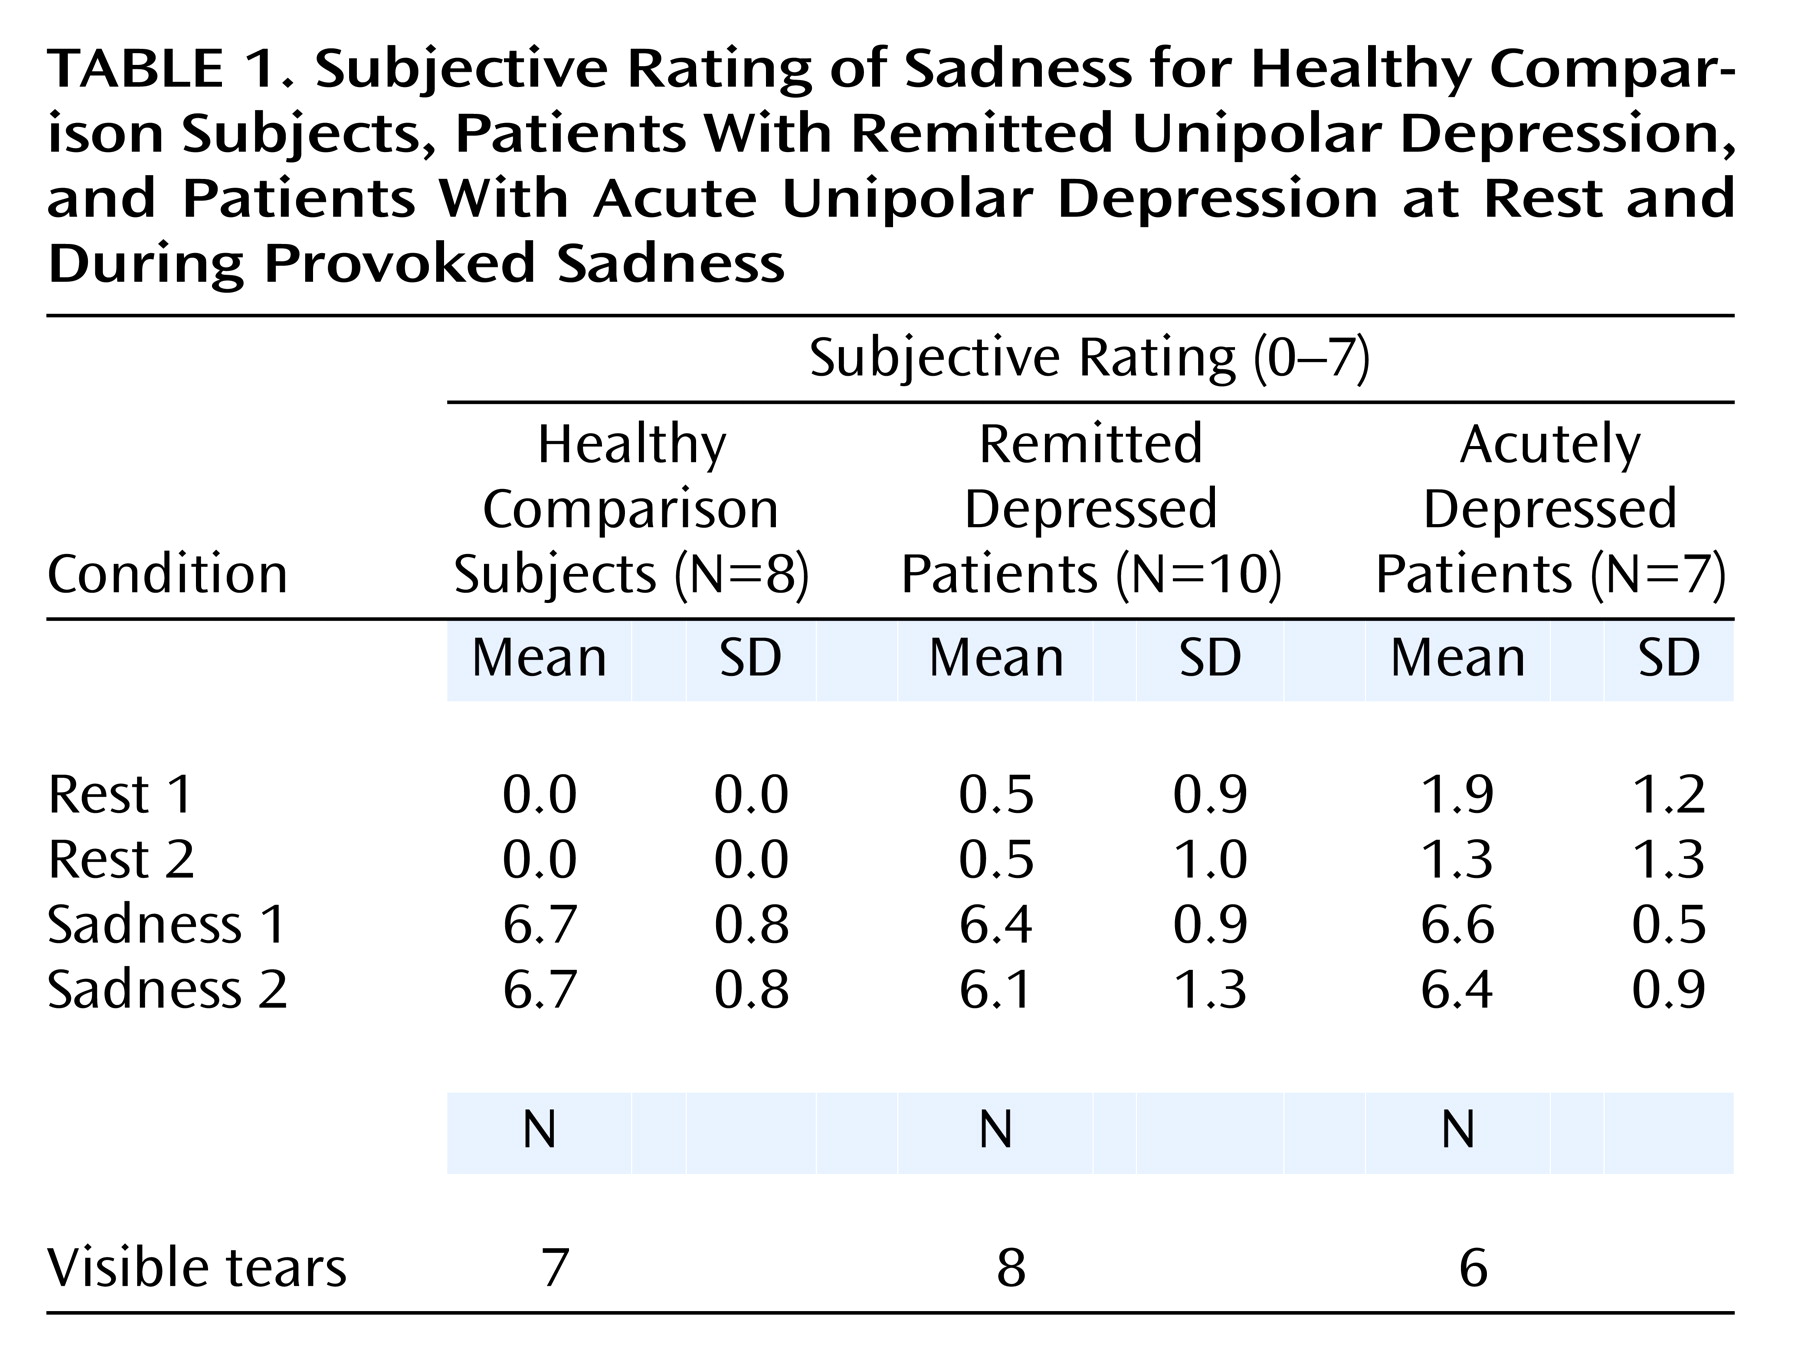
Mean rating scores for sadness intensity are reported for each scan and patient group in
Table 1. Remitted patients reported no sadness in the baseline relaxed state, while they reported a mean score of 6.3 on a 7-point scale (SD=1.1) after sadness provocation. Eight of 10 had visible tears. No significant anxiety was reported during the resting state (mean=1.1, SD=0.9) or during the sad state (mean=1.2, SD=0.9).
Healthy comparison subjects reported no sadness during the resting scans, while they reported a mean score of 6.5 (SD=0.7) after sadness provocation. Seven of eight had visible tears. No significant anxiety was reported during the resting state (mean=0.8, SD=1.0) or during the sad state (mean=0.9, SD=0.5).
The acutely depressed group achieved a similar higher level of sadness after provocation (mean=6.5, SD=0.7), and six of seven patients had visible tears. A slightly higher level of sadness was reported by members of this group at baseline (mean=1.6, SD=1.2) because of their status of acute illness. Similarly, their level of anxiety was slightly higher than that of the other two groups (at rest: mean=1.4, SD=1.3; after sadness provocation: mean=2.1, SD=1.4). There were no statistically significant differences in scores across groups.
PET Results
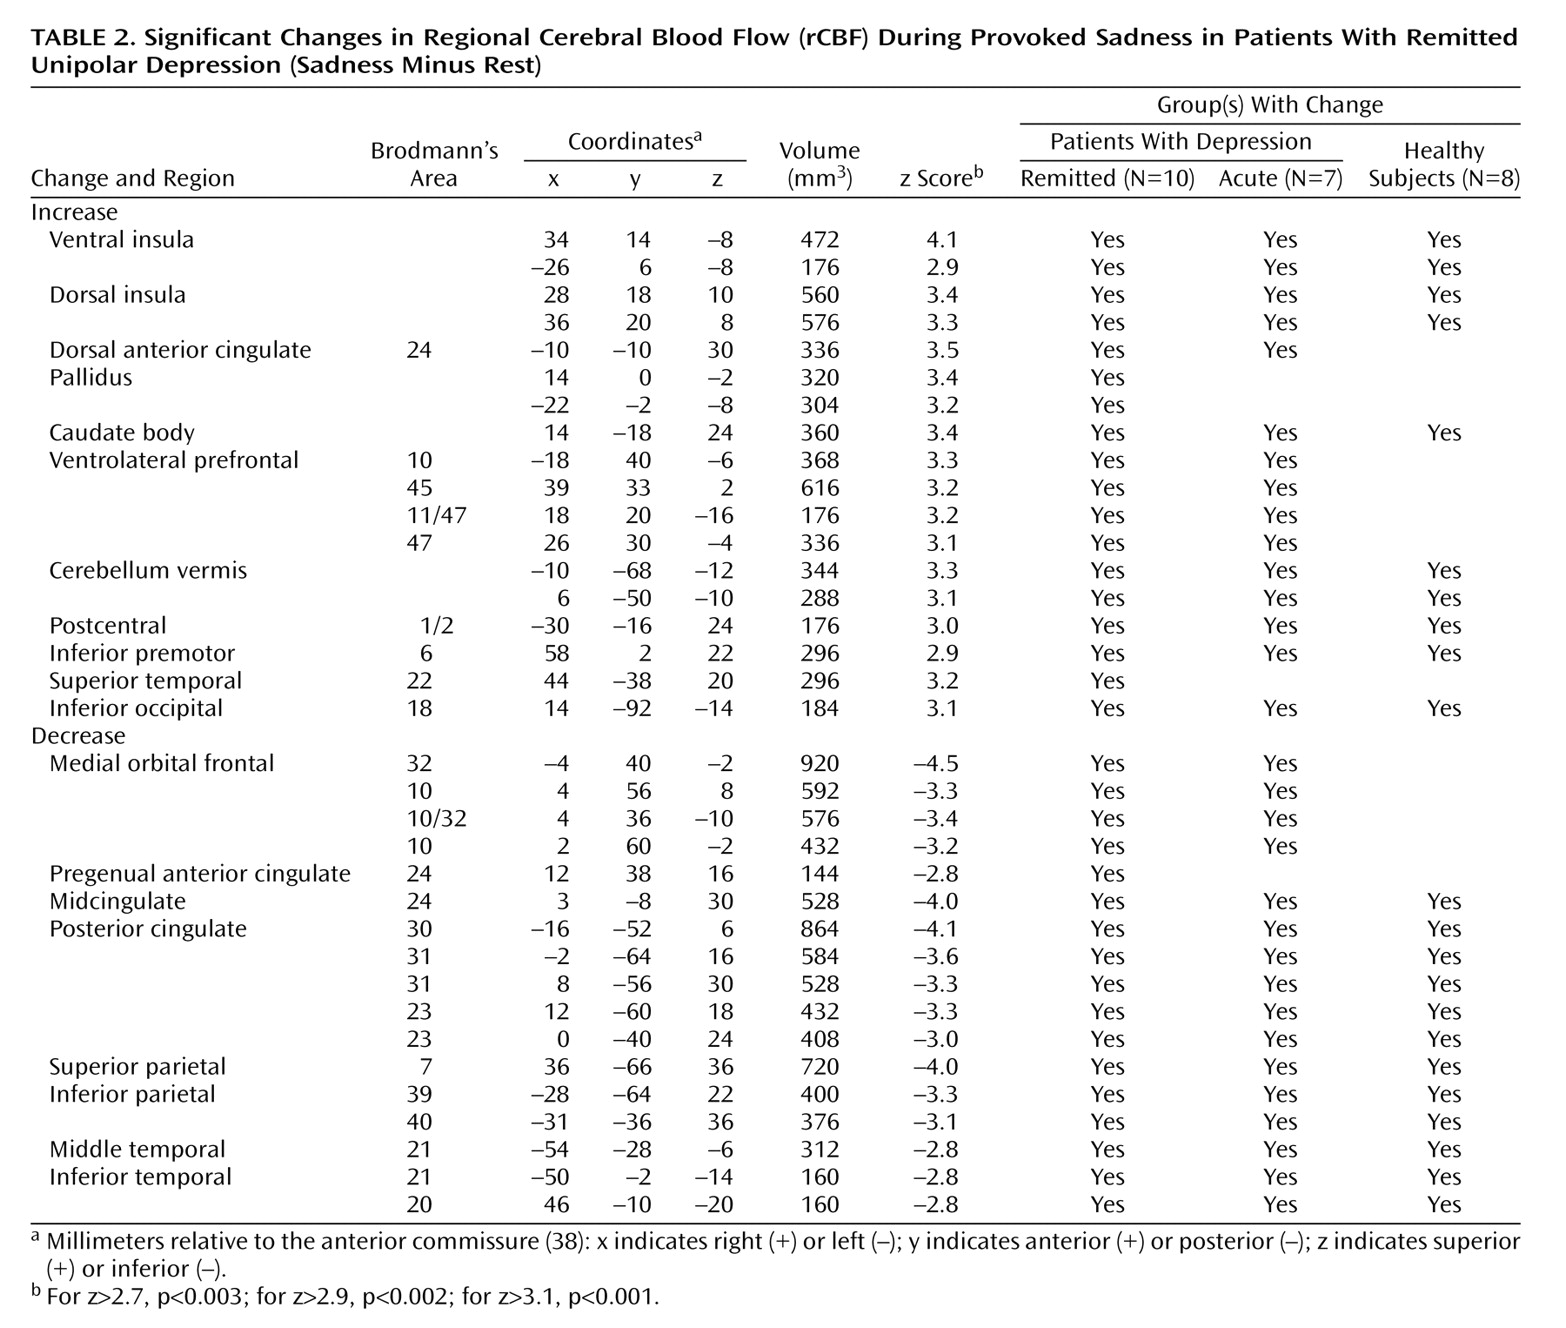
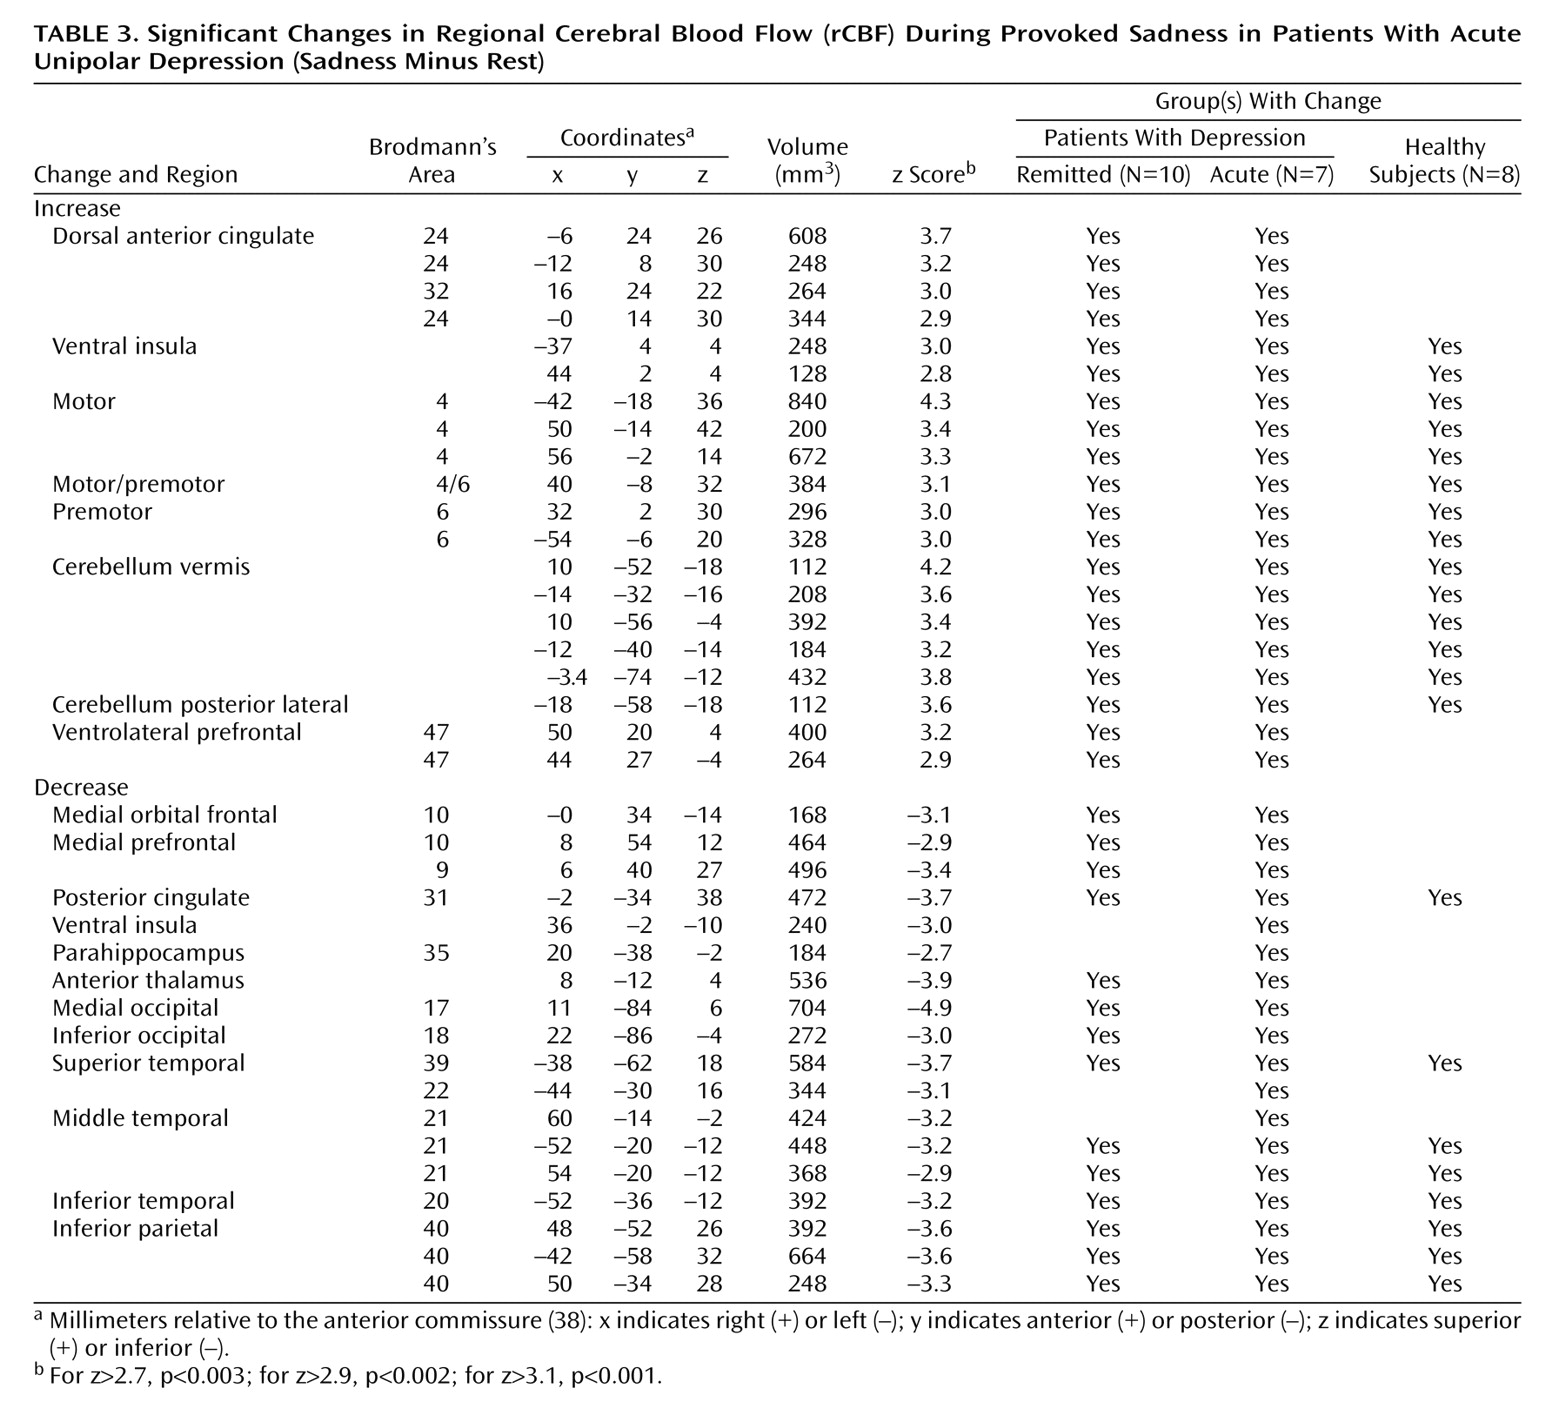
Sadness relative to the resting state resulted in areas of both significant rCBF increases and decreases among all groups. Significant changes in the remitted and acute groups are shown in
Table 2 and
Table 3, respectively (z scores >2.7, p<0.003). Data for the healthy group have been the focus of two previous reports
(14,
21) and are not repeated here. The column called “Group(s) With Change” indicates whether the rCBF changes were shared or unique to the various groups, as defined by a common Brodmann’s designation of local maxima or minima.
Remitted Depression
Sadness provocation resulted in significant rCBF changes (omnibus significance: beta-2=3.34, df=1972, p=0.0008). Activations were observed in the ventral anterior insular cortex, dorsal anterior cingulate, globus pallidus, caudate, cerebellar vermis, lateral inferofrontal cortex, premotor and sensorimotor cortex, and visual cortex. Deactivations were present in medial orbitofrontal cortex Brodmann’s areas 10, 11, and 32 and in pregenual cingulate 24a, the posterior cingulate cortex, medial and lateral posterior parietal cortex, posterior inferior temporal cortex (Brodmann’s area 21/20), lateral visual cortex Brodmann’s area 18, anterior thalamus, and posterior insula (
Table 2).
Acute Depression
As in the previous group, sad mood precipitation resulted in significant rCBF changes (omnibus significance: beta-2=3.29, df=1972, p=0.001). Activations were present in the ventral insula, dorsal anterior cingulate, motor and premotor cortex, midline cerebellum, and inferior frontal cortex. Deactivations were present in the medial orbitofrontal and prefrontal cortex, posterior cingulate cortex, right anterior thalamus, bilateral inferior parietal cortex, bilateral inferior temporal cortex Brodmann’s area 20/21, and right parahippocampal gyrus (
Table 3).
Sadness in Depressed and Healthy Subjects
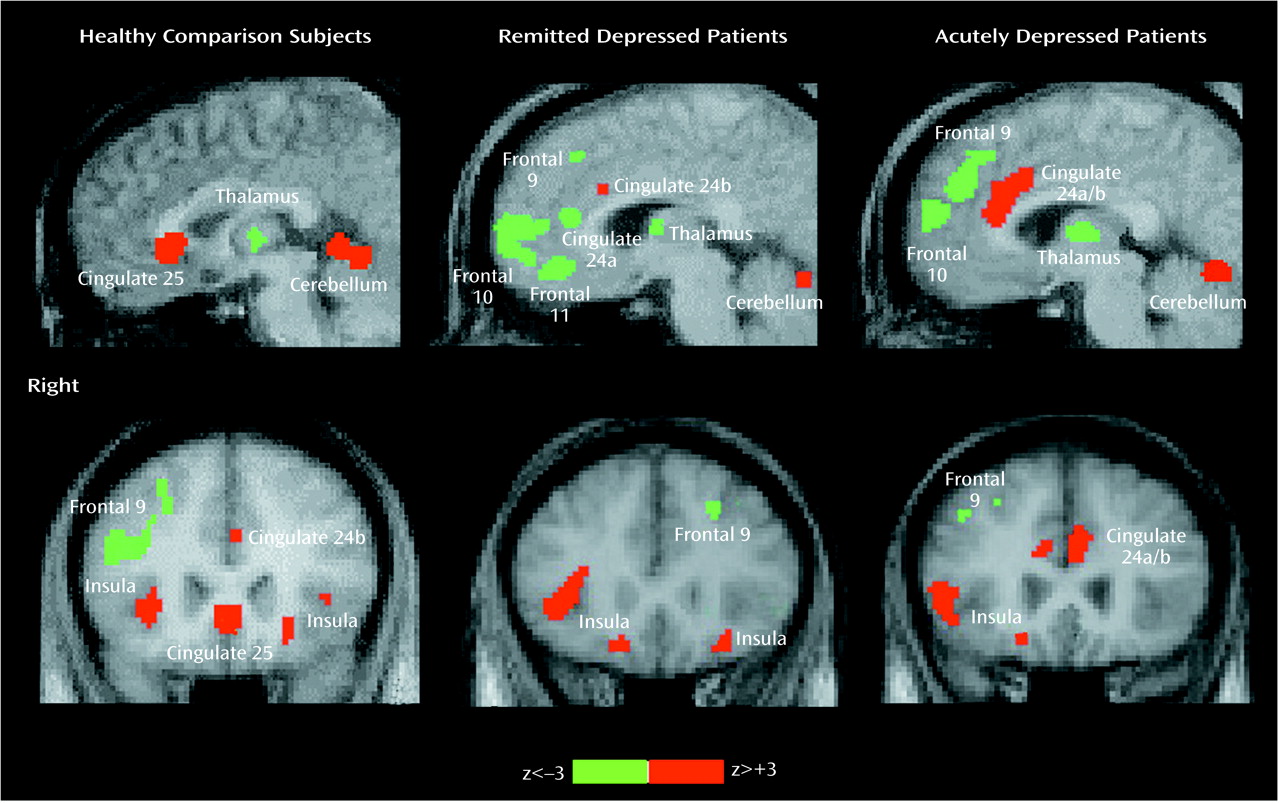
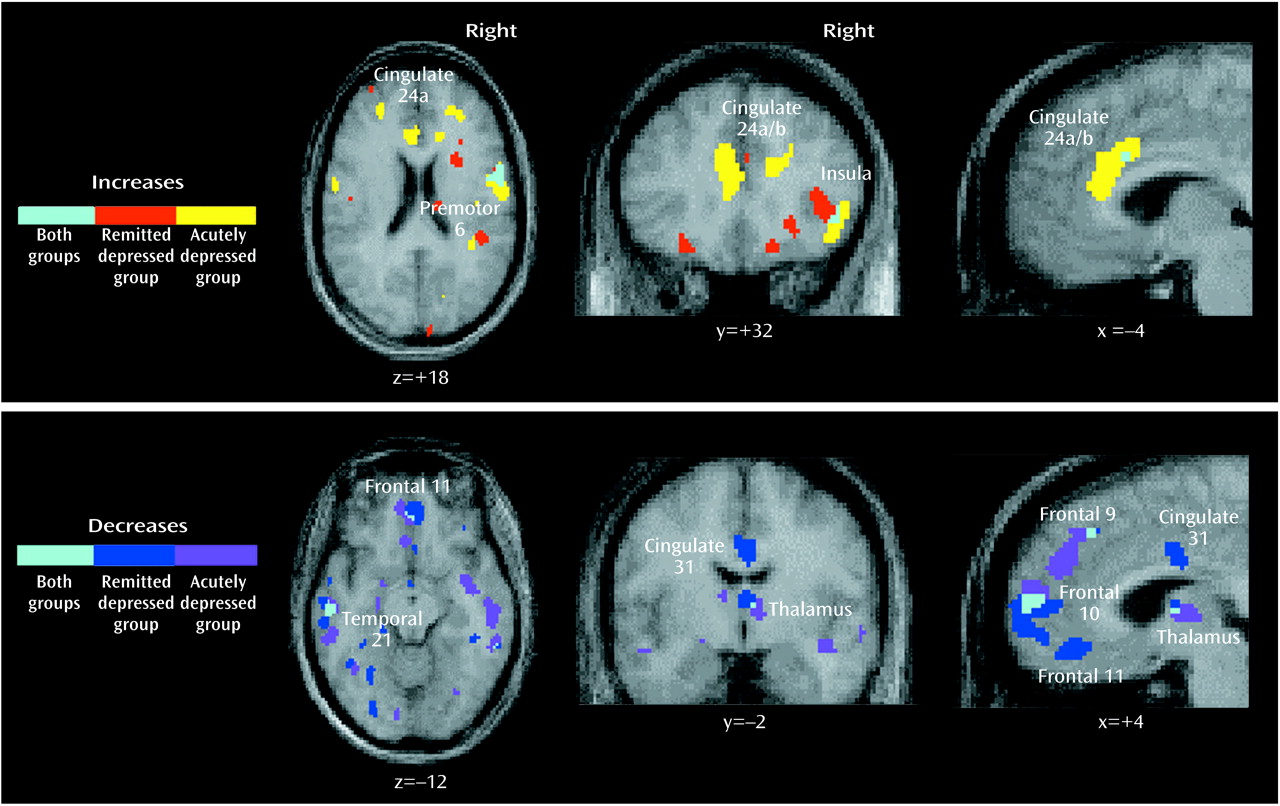
Common and unique significant effects of mood provocation across the three groups are shown in
Figure 1 and
Figure 2. Common effects of sadness across the three groups were rCBF activations of the ventral insula, motor/premotor cortex, and cerebellar vermis and deactivations in the posterior cingulate, inferior parietal cortex, and inferior temporal cortex. Unique effects of sadness shared by both depressed groups but not the healthy group were increases in activation in the dorsal anterior cingulate and lateral inferior frontal cortex and deactivations in the medial orbitofrontal cortex, anterior thalamus, and occipital cortex.
Unique effects of sadness in the healthy group were the activation of ventral subgenual anterior cingulate Brodmann’s area 25 and the left parahippocampal gyrus and deactivation of right dorsolateral prefrontal cortex Brodmann’s area 9/46 (
Figure 1).
Unique changes in the remitted depression group were activations in the globus pallidus and deactivations of pregenual cingulate 24a. Unique changes in the acute group were deactivations in the middle temporal gyri and right parahippocampal gyrus. Differences in the relative size of changes (area of involvement) between depressed groups were a greater involvement of the insula, basal ganglia, parietal cortex, and posterior cingulate in the remitted group and a greater involvement of the dorsal anterior cingulate, motor/premotor cortex, cerebellum, and inferior temporal cortex in the acutely depressed group.
Discussion
The main finding of this study is that the pattern of brain activity after sad mood precipitation in euthymic, fully remitted, depressed patients overlapped with that observed in acutely depressed patients rather than that observed in never-depressed healthy subjects. More specifically, mood provocation in unipolar depressed outpatients—independent of current clinical status—resulted in rCBF decreases in medial orbitofrontal cortex Brodmann’s area 10/11, extending dorsally to medial Brodmann’s areas 10, 9, and 8 and the anterior thalamus. In addition, in the remitted group, mood provocation produced a unique rCBF decrease in pregenual anterior cingulate 24a. The main effects of sadness induction in healthy subjects—i.e., an rCBF increase in subgenual cingulate Brodmann’s area 25 and a decrease in right prefrontal cortex Brodmann’s area 9
(14,
21)—were not observed in either of the unipolar depressed groups. A number of regional changes were, however, common to sad mood provocation in healthy subjects and in unipolar depressed subjects, i.e., rCBF increases in the insular cortex, cerebellar vermis, and motor/premotor cortex and rCBF decreases in the parietal cortex, posterior cingulate cortex, and posterior inferior temporal cortex Brodmann’s area 20/21 and may reflect shared circuitry in mood regulation in health and disease.
Taken together, this pattern of findings—similar to the regional abnormalities found in untreated primary
(10,
26,
30) or secondary
(31–
34) unipolar depression—is consistent with our second hypothesis, i.e., that provoked sadness in recovered depressed patients results in an unmasking of a purported disease-specific effect or marker.
Brodmann’s Area 10/11
The main finding in this study is decreased medial orbitofrontal cortex rCBF with sad mood precipitation in both remitted and acutely depressed patients, which was absent in healthy subjects. Similar abnormally decreased rCBF and metabolism have been observed before in more severely ill, refractory, or inpatient groups with major depression relative to healthy subjects
(10,
26–
30), while different regional abnormalities have been reported in less severely ill outpatient cohorts. Furthermore, similar smaller medial orbitofrontal cortex effects have been found in patients with secondary depression after Parkinson’s disease
(31), Huntington’s disease
(32), caudate stroke
(33), or complex partial seizures
(34) relative to nondepressed comparison groups with the same disorder. The similarity of these findings in the medial orbitofrontal cortex suggests that mood provocation in patients with remitted depression unmasks a disease marker of hyperacute unipolar depression.
Furthermore, a similar decrease in rCBF in the medial orbitofrontal cortex has been reported in two published reports of tryptophan-induced depression relapse in recovered depressed patients relative to a similar group of patients without depletion-induced symptom aggravation
(28,
29), suggesting that decreased activity in the medial orbitofrontal cortex is a common feature of acute depression relapse.
The ventromedial inferior frontal and orbitofrontal cortex have been identified as substrates of reward mechanisms in animals and humans
(44), such as the ability to respond to feedback in planning and guessing tasks and in gambling tasks
(45,
46). Impairments have been described in clinically depressed patients
(47) who also failed to show activation of the medial orbitofrontal cortex during such tasks relative to comparison subjects
(48). Our findings suggest that medial orbitofrontal cortex function is selectively affected in severe clinical depression (melancholia), but it is preserved in milder forms of depression (nonmelancholic) or in transient sadness in healthy volunteers and could perhaps explain differences between such entities.
Brodmann’s Area 47/45
Activation in the ventrolateral prefrontal cortex was observed in both depressed groups after sadness provocation and to a lesser degree in the healthy group. Similarly, increased activation in the ventrolateral prefrontal cortex than in healthy comparison groups has been reported in similar cohorts of outpatients with major depression
(49,
50), including a group that responded to psychotherapy
(51). In addition, in a number of studies of sadness in healthy volunteers, similar ventrolateral prefrontal cortex activations were found when contrasting sadness to a resting state
(18–
21). It is suggested that ventrolateral prefrontal cortex activation reflects the use or unmasking of more ruminative elements of depression that may dominate the picture in nonmelancholic outpatients but not be present in more severely ill, melancholic inpatients. In support of this contention, no ventrolateral prefrontal cortex effects have been found in any studies in our laboratory involving more severely ill inpatient cohorts
(10,
15,
26). In a critical test of this theory in our laboratory, healthy subjects were scanned at a resting euthymic state or after memory-driven induction of sadness, anxiety, or a neutral relaxed state. Ventrolateral prefrontal cortex activation was present in all active conditions relative to the resting state, and it disappeared when sadness or anxiety were contrasted to the neutral memory state
(14,
21).
Brodmann’s Area 24a
Remitted depressed patients provoked into depression displayed a unique deactivation of pregenual anterior cingulate 24a that was not present in the acute group. While no changes in this region were observed in previous studies as a function of state (i.e., mood) change in healthy subjects with sadness and in patients with illness remission
(14), the resting metabolism of Brodmann’s area 24a was found to predict response to 6 weeks of fluoxetine treatment; it was higher than normal in responders and lower than normal in nonresponders. Therefore, mood provocation in our remitted group appeared to unmask a functional marker associated with severe refractory depression
(26,
27).
Of importance, acutely ill patients showed a more widespread increase in rCBF in the dorsal anterior cingulate region, including a small cluster in pregenual 24a. One interpretation of this finding is that pregenual 24a may be uniquely sensitive to the acute unmasking of severe depression, which only happens in the remitted group. An alternative interpretation considers recent findings from studies in healthy volunteers demonstrating that pregenual anterior cingulate 24a mediates emotion-attention interactions as tapped by the Emotional Stroop Task
(52). In a related study
(53), we demonstrated that pregenual 24a activity during a sad state was dramatically and selectively increased during augmentation of the level of attentional conflict of a Stroop task. It is conceivable that the sadness procedure is more effortful in the acute group, perhaps accounting for the unique activation of this region.
Brodmann’s Area 25
Subgenual anterior cingulate Brodmann’s area 25 had been previously identified as one of the main regions involved in state-dependent mood changes across health and disease
(14,
19–22). In contrast, no significant changes with sadness provocation were observed in the present study in either the remitted or acute depressed groups at any statistical threshold. To further explore the role of this area in depression, we conducted a secondary analysis, addressing the comparison of rCBF in this region during the resting state in the remitted depression group relative to the healthy comparison group. Resting rCBF in Brodmann’s area 25 in the remitted group was significantly lower than that in the healthy comparison group, suggesting that Brodmann’s area 25 becomes deactivated at rest and remains suppressed after mood provocation. Possible interpretations of this finding are that suppression of Brodmann’s area 25 may be a requisite for mood normalization in recovered patients or that suppression of Brodmann’s area 25 may be due to antidepressant medication (in all but one subject). The latter interpretation is unlikely in light of the fact that no change in Brodmann’s area 25 was observed with mood provocation in the acute depressed group (all but one patient was unmedicated). We hypothesize that full recovery in unipolar depression is accompanied by a functional reorganization of limbic-cortical pathways, resulting in sustained suppression of area 25 and an absence of transient recruitment of the same region during negative mood shifts associated with sadness provocation. In contrast, in the acute depression group, it is possible that rCBF in Brodmann’s area 25 was already elevated at rest and did not change with mood provocation.
Brodmann’s Area 9/46
A second major change previously associated with mood/state effects—i.e., in right prefrontal cortex Brodmann’s area 9/46—was not observed with mood precipitation in the remitted group or in the acute depression group. In both groups, rCBF did not change significantly after sadness induction. Similar group-specific effects in the right prefrontal cortex were also found in a separate event-related potential study in which the same subjects in the three groups performed a sustained-attention, target-detection task
(54) specifically tapping into the function of the right prefrontal cortex
(55).
These combined findings suggest that depressed patients undergo a functional reorganization of limbic-cortical networks relevant to sadness regulation affecting particularly the subgenual anterior cingulate 25 and right prefrontal cortex 9, which may limit the downstream effects of mood state on cognitive functioning. In support of this interpretation, the two regions have known bilateral anatomical connections; they have displayed a significant intercorrelation across changes of mood state in health and disease
(14,
21), and a recent covariance analysis
(56) suggested specific changes in effective connectivity between the two regions in both depressed groups.
Conclusions and Clinical Implications
The combined findings of the present study suggest that provocation of transient sadness in unipolar depression patients in clinical remission precipitates a change in selective brain regions associated with treatment response and characteristic of regional abnormalities seen in chronic treatment-resistant patients
(10,
26,
30). Overall, this transient stressor appears to unmask hyperacute depressive symptoms similar to those observed in recovered depressed patients after symptom relapse with tryptophan depletion
(28,
29). We postulate that use of an acute mood challenge in unipolar patients in clinical remission unmasks syndrome-specific functional lesions that are the primary sites of aberrant mood regulation in this disorder. We further propose that pregenual 24a and occipitofrontal 10/11 represent sites of vulnerability in patients with unipolar depression. This conclusion is consistent with the identified role of pregenual 24a as a predictor of treatment response in acutely depressed patients
(26,
27). To further emphasize such a role, rCBF in 24a was decreased after acute mood challenge, transiently resembling the hyperacute state of severe refractory depression
(26,
27).
It could be argued that the regional changes observed in the remitted group may be due to residual, subsyndromal depression symptoms rather than to the purported disease marker. Two patients in the remitted group, although not meeting DSM-IV criteria for a major depressive episode, had a Hamilton depression score greater than 7. To rule out the possibility that the neural changes observed in the remitted group were due to symptom persistence, a secondary analysis was carried out in the remitted group after exclusion of the two patients with Hamilton depression scale scores greater than 7. The conditional contrast of sadness versus rest in this restricted group (N=8) yielded identical results to those in the entire group, thus corroborating our main interpretation of the findings.
We emphasize that transient sadness is construed here as a stressor able to trigger a hyperacute depressive state before any compensatory mechanism is initiated. By no means is transient sadness equated to (considered synonymous with) the chronic dysphoria of clinical depression. Transient sadness lacks other syndromal symptoms of clinical depression, although cognitive changes may be present
(54).
Memory-induced relapse appears to be a more naturalistic model of temporary illness recurrence, as observed in remitted patients after exposure to emotional stressors. Unlike the tryptophan-depletion method, which has been used to characterize relapse early in the course of SSRI treatment
(5), mood-provoked symptoms can be observed in patients who have been in a recovered state for over a year—with or without medication. Future studies will require additional studies to link challenge-induced changes to long-term outcome. It is important to stress, however, that induced sadness requires a very careful study design, thus constraining its usefulness in psychiatric research.
Finally, it could also be argued that the functional reorganization observed in the remitted unipolar depression group may be the result of a compensatory state produced by antidepressant treatment (nine of 10 patients were taking SSRIs or combined treatment). However, the most important findings of the study were also observed in the acute unipolar depression group, which was for the most part (six of seven not taking medications) medication free at the time of the study. It is still possible that the effects observed may be partially explained by previous long-term antidepressant treatment or chronic illness, since all unipolar depression patients (remitted or acute) had a previous history of treatment of their recurrent episodes of major depression. Future studies with never-medicated unipolar depressed patients should fully assess the influence of long-term treatment. Also, it is not known whether the observed changes represent a marker of disease vulnerability or if there is a reorganization in brain function because of disease. Future studies of family members at risk will be needed to test this hypothesis.
