Performance deficits on the Continuous Performance Test
(1), a measure of sustained attention, have been suggested as indicators of vulnerability to schizophrenia
(2–
4). Deficits on the Continuous Performance Test have been shown in schizophrenic patients in a range of illness stages
(5–
7). In studies using more difficult test versions with a working memory component and/or a perceptual load, the performance deficits were not amenable to treatment with traditional neuroleptics
(8–
13) or the atypical neuroleptic risperidone
(12). Poor performance on the test is also present in nonclinical populations bearing a high risk for schizophrenia
(14–
16) and in people with schizotypal features
(17–
19). Family studies indicate that performance level on the test is heritable both in normal families
(20) and in families of patients with schizophrenia
(14,
15). On the basis of a recurrence risk ratio analysis
(21), our previous family study found that Continuous Performance Test deficits, defined as scores three standard deviations below the population mean
(14), have more statistical power for linkage analysis than traditional risk factors for schizophrenia spectrum disorders
(22).
Although the evidence supporting Continuous Performance Test deficits as markers of genetic susceptibility to schizophrenia is compelling, whether similar deficits exist in patients with affective disorders remains to be clarified. Earlier studies suggested that patients with schizophrenia are more impaired in their test performance than patients with schizoaffective disorder or major affective disorders
(23) and patients with depressive disorders
(24). However, later studies reported that the performance of patients with schizophrenia and patients with bipolar disorder did not differ significantly
(8,
25). Another study found no difference in test performance between patients with major depression with psychosis and patients with schizophrenia
(26). Meanwhile, a longitudinal study of psychotic inpatients with bipolar disorder found that test performance improved after remission
(27). Results from a study of high-risk offspring found that children born to mothers with schizophrenia have poorer test performance than those born to mothers with affective disorders
(28). This finding provided further evidence that the nature of Continuous Performance Test deficits in schizophrenia might be different from that in affective disorders.
To compare Continuous Performance Test deficits in patients with schizophrenia and patients with affective disorders, it is important to have enough comparison subjects to adjust for demographic features, since test performance is strongly associated with age, sex, and educational level
(29). Although many previous studies have attempted to address this issue by incorporating demographic features as covariates in their analyses, the numbers of normal comparison subjects in these studies have tended to be very small (between 11 and 40). Furthermore, the subject groups in many previous studies have included a mix of patient subtypes (patients with unipolar depression plus patients with bipolar depression, inpatients plus outpatients, etc.) or have included a limited number of either depressive or manic patients alone. These factors might have contributed to discrepancies in the findings and have made it difficult to compare the results across studies.
The study reported here compared the Continuous Performance Test deficits of patients with schizophrenia with those of patients with various subtypes of affective disorder, including major depressive disorder without psychotic features, bipolar disorder without psychotic features, and bipolar disorder with psychotic features. Two versions of the Continuous Performance Test, both of which included a working memory component, were used in the study, one version without an increased perceptual load (undegraded Continuous Performance Test 1–9) and one with an increased perceptual load (degraded Continuous Performance Test 1–9). Subjects’ test scores were standardized by comparison with scores for 345 community subjects to more completely control for possible confounding effects of sex, age, and education level. In addition, in a subgroup of patients with schizophrenia and patients with bipolar disorder, change in Continuous erformance Test deficits from inpatient admission to discharge was analyzed. The goals of the study were to determine 1) whether patients with various subtypes of affective disorder manifest Continuous Performance Test deficits similar to those manifested by patients with schizophrenia and 2) whether Continuous Performance Test deficits in bipolar disorder improve as patients’ clinical states move from the active phase to remission.
Method
Subjects
The initial study subjects were 43 patients with schizophrenia and 94 patients with affective disorders. The schizophrenic patients were drawn from participants in the fourth year of a 5-year prospective clinical study of schizophrenia, the Multidimensional Psychopathology Group Research Project
(14,
22). Briefly, from October 1, 1997, to June 30, 1998, patients admitted to the acute inpatient psychiatric ward of National Taiwan University Hospital who met the inclusion criteria for the 5-year study were included. Patients had to fulfill the DSM-IV criteria for schizophrenic disorders and the requirements of the sampling design, in which the ratio of patients admitted for the first time to those admitted for relapse was set at 1:2 to ensure inclusion of patients in different phases of the illness. Exclusion criteria were a history of ECT, mental retardation, trauma-related change in consciousness, psychoactive substance abuse, or physical illness that might cast doubt on the diagnosis. The National Taiwan University Hospital participants were selected to serve as subjects for both the Multidimensional Psychopathology Group Research Project and a pilot study assessing the feasibility of a comprehensive neuropsychological test battery.
For the same pilot study, inpatients and outpatients with affective disorders were also recruited. To examine longitudinal changes in performance on the Continuous Performance Test across different clinical states, the study recruited patients with bipolar disorder from the inpatient ward of the National Taiwan University Hospital. To examine test performance in the remitted state, stabilized outpatients who met the DSM-IV criteria for unipolar or bipolar affective disorders were recruited from the psychiatric clinics of the National Taiwan University Hospital and Cathay General Hospital (a general hospital in Taipei affiliated with National Taiwan University Hospital). After the same exclusion criteria used for the schizophrenic patients were applied, 94 patients with affective disorders remained for inclusion in the pilot study (19 inpatients from National Taiwan University Hospital, 14 outpatients from National Taiwan University Hospital, and 61 outpatients from Cathay General Hospital).
In addition to the patients, community subjects were recruited to provide a norm for the Continuous Performance Test findings. The selection of the community subjects has been described elsewhere
(14). Briefly, adults were systematically sampled from the 1993 and 1994 voter lists of Chinshan Township, north of Taipei. About 65% of subjects who were selected and resided in Chinshan, a total of 345 subjects, were successfully tested. Only subjects who did not have a diagnosis of psychosis or stroke and who completed both the study questionnaire and the Continuous Performance Test were included in the analyses.
Diagnostic Procedures
All the patients were interviewed with the Diagnostic Interview for Genetic Studies
(30). The establishment of the Chinese version and its reliability have been described in our earlier report
(14). Kappas for the Chinese version of the Diagnostic Interview for Genetic Studies for the diagnoses of schizophrenia, bipolar disorder, and major depression ranged from 0.86 to 0.93. The intraclass correlation coefficient indicating the reliability of the items associated with these diagnoses (number of depressive symptoms, number of manic symptoms, presence of psychotic symptoms, age at onset, etc.) ranged from 0.94 to 1.0. Interviews with the Chinese version of the Diagnostic Interview for Genetic Studies were carried out by research assistants with backgrounds in psychology, psychiatric nursing, or psychiatric epidemiology. They had received 4 weeks of training in standardized psychiatric interviewing. The training included lectures on the psychopathology and diagnostic criteria of major psychiatric disorders, explanation of procedures for history taking at outpatient clinics, practice in using the Chinese version of the Diagnostic Interview for Genetic Studies with psychotic inpatients, and sham testing. The interviewers also completed six sessions of videotaped testing before participating in the data collection.
Two psychiatrists independently assessed the diagnosis of each subject by reviewing the patient’s results on the Diagnostic Interview for Genetic Studies and other available information, including hospital records and the interviewer’s notes. If the two psychiatrists disagreed about a diagnosis, a third one was sought, and a consensus diagnosis was reached after discussion.
Two schizophrenic patients and four affective disorder inpatients did not complete all the tests and were not included in the analysis. Thus, the final study group included 41 schizophrenic patients and 90 affective disorder patients. According to the DSM-IV criteria, the 90 affective disorder patients were further classified into three subgroups: major depression without psychotic features (N=22), bipolar disorder without psychotic features (N=22), and bipolar disorder with psychotic features (N=46). Since no inpatient had a diagnosis of unipolar depressive disorder, the group with nonpsychotic major depression consisted of outpatients exclusively. In addition, none of the patients with unipolar depression met the criteria for psychotic major depression. The diagnosis of psychotic features was based on the presence of delusions and/or hallucinations, as specified in DSM-IV.
Continuous Performance Test
The subjects were assessed with the Continuous Performance Test, version 2.20, operated on a Sunrise Systems machine (Pembroke, Mass.). The procedure has been described in detail elsewhere
(29). Briefly, numbers from 0 to 9 were randomly presented for 50 msec each, at a rate of one per second. Each subject undertook two Continuous Performance Test sessions: the undegraded 1–9 task and the 25% degraded 1–9 task, in which subjects were asked to respond whenever the number “9” preceded by the number “1” appeared on the screen. A total of 331 trials, 34 (10%) of which were target stimuli, were presented over 5 minutes for each session. During the 25% degraded session, a pattern of snow was used to toggle background and foreground so that the image was visually distorted. Each test session began with 2 minutes of practice (repeated if subjects required). Two signal-detection indices of performance on the test—sensitivity (d′) and response criterion (natural logarithm of beta [ln beta])—were derived from the hit rate (probability of response to target trials) and false-alarm rate (probability of response to nontarget trials)
(2). Sensitivity is an individual’s ability to discriminate target stimuli from nontarget stimuli. The response criterion measures the amount of perceptual evidence the person requires to identify a stimulus as a target. Variables extraneous to the intended comparison of sensitivity, such as differences between groups in level of motivation or cooperativeness, yield differences in ln beta rather than in d′. In a 1-week test-retest reliability study
(29) of the Continuous Performance Test versions used in this study, the intraclass correlation coefficients of reliability of d′ were 0.83 and 0.82 for the undegraded and the 25% degraded 1–9 task, respectively, and those of ln beta were 0.49 and 0.72 for the undegraded and the 25% degraded 1–9 task, respectively.
The inpatients were administered the Continuous Performance Test twice: once after admission, as soon as the patient’s condition was stable enough to complete the test, and again after the patient achieved the clinical remission, within 3 days of discharge. A total of 41 inpatients with schizophrenia and 15 with bipolar disorder completed both the admission and discharge Continuous Performance Tests. The outpatients in this study, all of whom had an affective disorder in a remitted state and had been stabilized for at least 3 months, were evaluated with the Continuous Performance Test only once during a follow-up clinic visit. We compared the inpatients’ Continuous Performance Test scores at discharge with the outpatients’ scores; six inpatients (two with schizophrenia and four with bipolar disorder) who did not complete the test at discharge were not included in this analysis. Thus, the final study group consisted of 41 patients with schizophrenia, 22 with major depression without psychotic features, 22 with bipolar disorder without psychotic features, and 46 with bipolar disorder with psychotic features.
Clinical Assessments
The overall severity of clinical symptoms of inpatients was assessed with the Brief Psychiatric Rating Scale (BPRS) (16 items, total score ranging from 0 to 96)
(31). The severity of affective symptoms of both inpatients and outpatients with affective disorders was assessed by using either the Young Mania Rating Scale (11 items, total score ranging from 0 to 60)
(32) or the Hamilton Depression Rating Scale (24 items, total score ranging from 0 to 72)
(33), according to the patient’s diagnostic subtype. Inpatients were evaluated twice (at admission and before discharge), and outpatients once. Each patient’s clinical evaluations were done by one of three senior psychiatrists (S.K.L., C.-J.C., and T.-J.H.) on the same day the patient completed the Continuous Performance Test.
Data Analysis
The patients’ scores were standardized with adjustments for sex, age, and education, as described by Chen et al.
(14). Briefly, the predictive score of a subject was calculated by using the regression coefficients obtained from the regression of the scores on these covariates among the 345 community subjects. The difference between the raw score and the predictive score was then standardized by the root mean error of the regression and was defined as the adjusted z score of the subject.
To compare the various raw and adjusted scores of Continuous Performance Test indices among groups, we used one-way analysis of variance and post hoc pairwise comparisons with t tests and the Bonferroni correction. For the two bipolar groups (bipolar disorder without psychotic features and bipolar disorder with psychotic features), which included both inpatients and outpatients, the inpatients’ Continuous Performance Test scores at discharge were pooled with those of the outpatients. In addition, BPRS, Young Mania Rating Scale, and Continuous Performance Test scores at admission and discharge were compared by using paired t tests. The possible effects of patients’ clinical characteristics on their test scores were assessed by regressing the adjusted z scores of the test indices on duration of illness, admission status, BPRS scores (for schizophrenic patients), Hamilton depression scale scores (for patients with nonpsychotic major depression), and Young Mania Rating Scale scores (for patients with bipolar disorder). A p value of less than 0.05 was considered significant. All analyses were done with the Statistical Package for the Social Sciences
(34).
Results
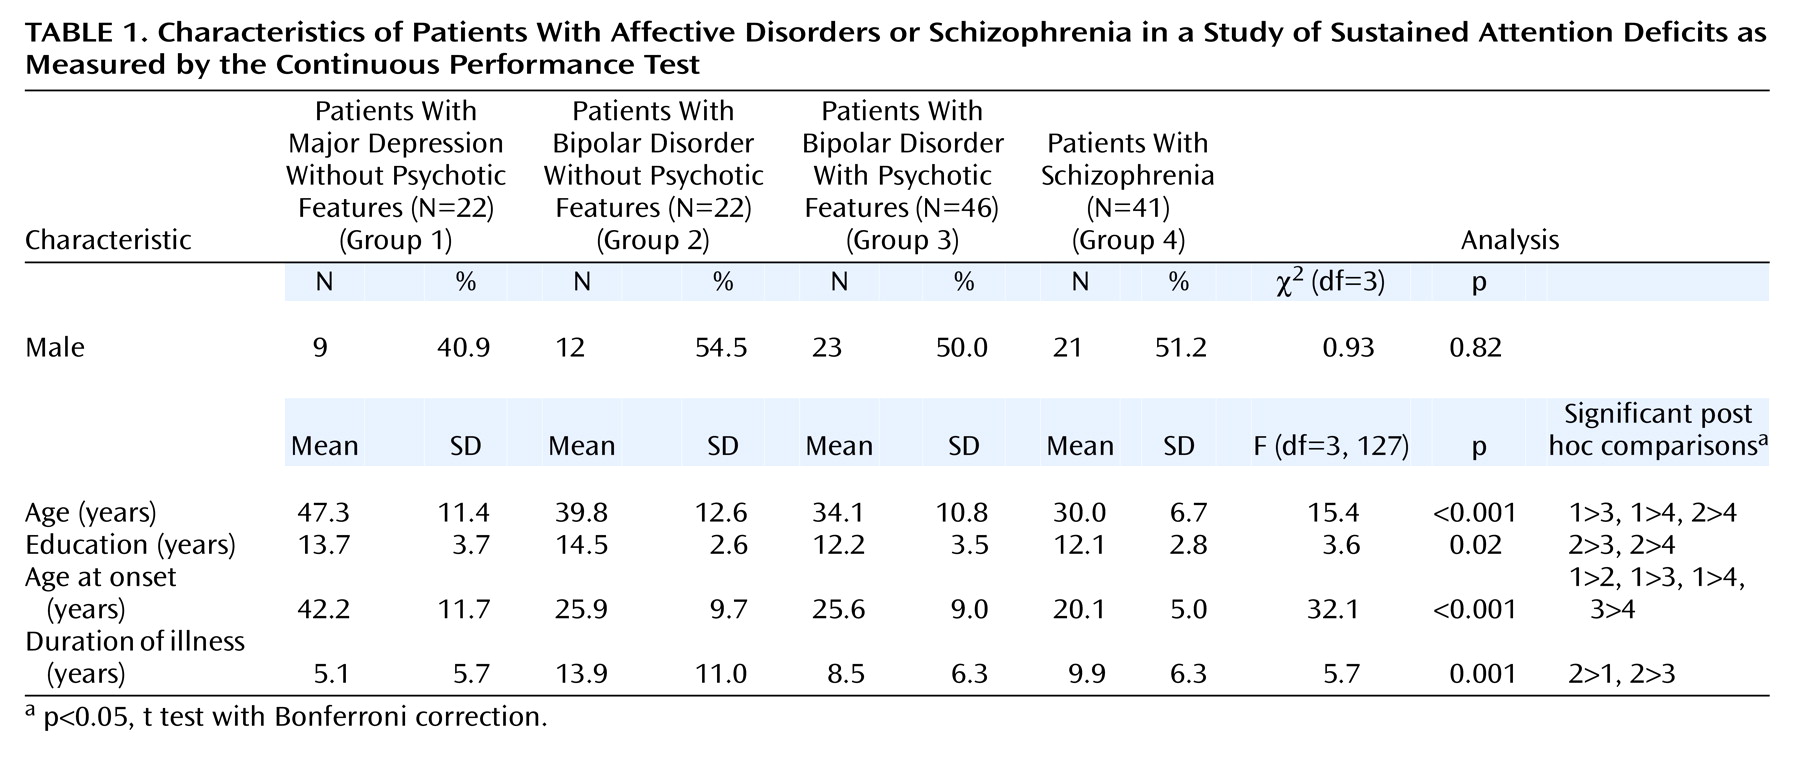
The demographic and clinical features of the four groups of patients were different except for sex distribution (
Table 1). The differences were mainly between the patients with nonpsychotic major depression and the other groups. The patients with nonpsychotic major depression were significantly older that the other groups and had a later onset and a shorter duration of illness. The differences between the schizophrenia group and the two bipolar disorder groups (bipolar disorder patients without psychotic features and bipolar disorder patients with psychotic features) were smaller.
The mean BPRS scores of the inpatients decreased significantly, from 34.0 (SD=13.0) at admission to 17.5 (SD=8.4) at discharge for the patients with schizophrenia (paired t=8.8, df=40, p<0.001) and from 16.5 (SD=8.9) at admission to 5.1 (SD=3.2) at discharge for the bipolar disorder patients (paired t=4.8, df=14, p<0.0001). When the ratings on the Young Mania Rating Scale of the inpatients at discharge were pooled with those of outpatients, the mean scores were 1.2 (SD=2.7) for patients with bipolar disorder without psychotic features and 3.0 (SD=5.1) for patients with bipolar disorder with psychotic features, indicating that both groups had similarly severe manic symptoms during remission (t=–1.5, df=66, p=0.13). If the patients with bipolar disorder were classified according to their admission status, the mean Young Mania Rating Scale scores of the inpatients (at discharge) and the outpatients were 4.4 (SD=6.8) and 1.5 (SD=2.8), respectively. The difference approached but did not reach statistical significance (t=1.8, df=66, p=0.08). Overall, the symptoms of the inpatients with bipolar disorder assessed at discharge and the outpatients, regardless of their subtype, were in clinical remission. Likewise, the low mean Hamilton depression scale score of the patients with nonpsychotic major depression (mean=5.8, SD=4.1) showed that these patients’ could also be considered clinically remitted.
As expected, when the difficulty level of the Continuous Performance Test increased from the undegraded version to the degraded version, significant decrements in d′ were found within each group (all p<0.05 for paired t tests; data not shown). Nevertheless, the patterns of differences among groups were similar on the two Continuous Performance Test versions. Thus, only the results for the degraded Continuous Performance Test are reported here.
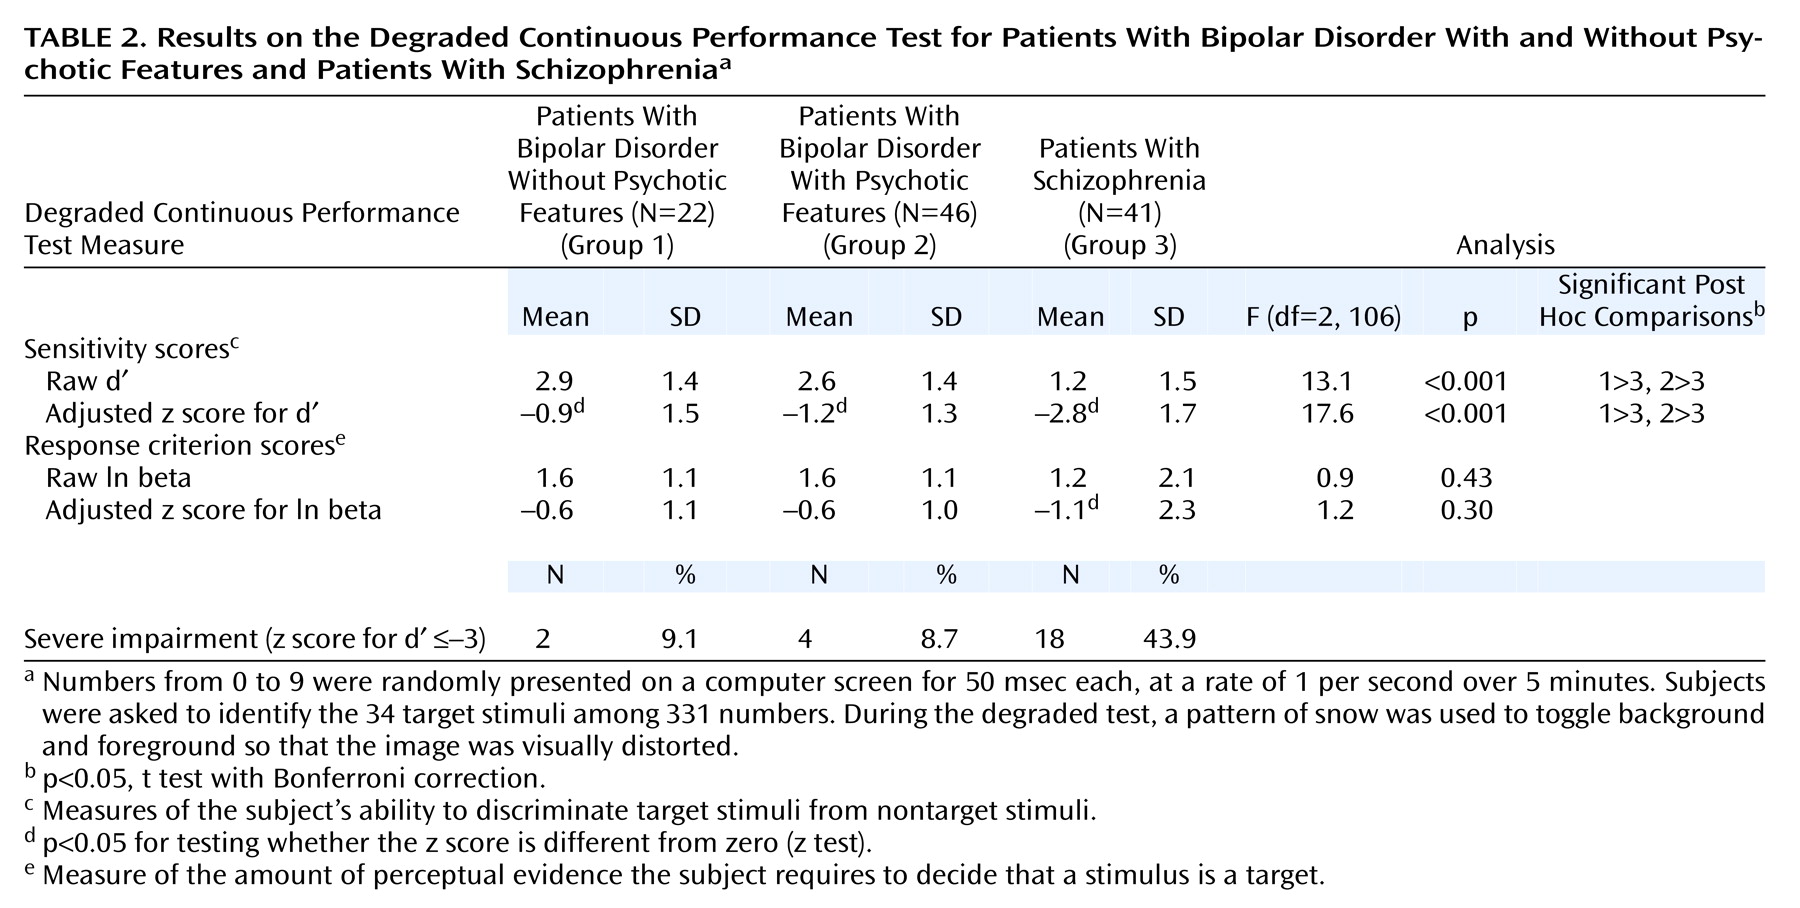
The results for the patients with nonpsychotic major depression are reported separately because this group was substantially different from the other three groups in age, age at onset of illness, and duration of illness. For the patients with nonpsychotic major depression, the mean raw score for d′ was 3.2 (SD=1.0), and mean adjusted z score was –0.3 (SD=0.9), which was not significantly different from zero and hence not deviant from those of the general population. The mean raw score and adjusted z score of ln beta for this group were 2.1 (SD=0.9) and –0.1 (SD=1.0), respectively, which also did not significantly deviate from those of the general population. None of patients with nonpsychotic major depression had an adjusted z score for d′ that was less than or equal to –3.
The Continuous Performance Test results for the patients with bipolar disorder without psychotic features, bipolar disorder with psychotic features, and schizophrenia are shown in
Table 2. All three patient groups were significantly impaired, as evidenced by their d′ values. However, the schizophrenia group had the most severe impairments, compared with the two bipolar disorder groups, regardless of whether raw scores or adjusted scores were used. With an adjusted z score for d′ of less than or equal to –3 as the cutoff point for severe impairment, the proportion of subjects with severe impairment was highest in the schizophrenia group, followed by the bipolar disorder groups with and without psychotic features.
In case of the response criterion (ln beta), all three groups’ scores were comparable to those of the general population, except that the schizophrenia group adopted a less stringent response criterion than the general population (
Table 2). Nevertheless, there were no significant differences among the four subject groups in ln beta.
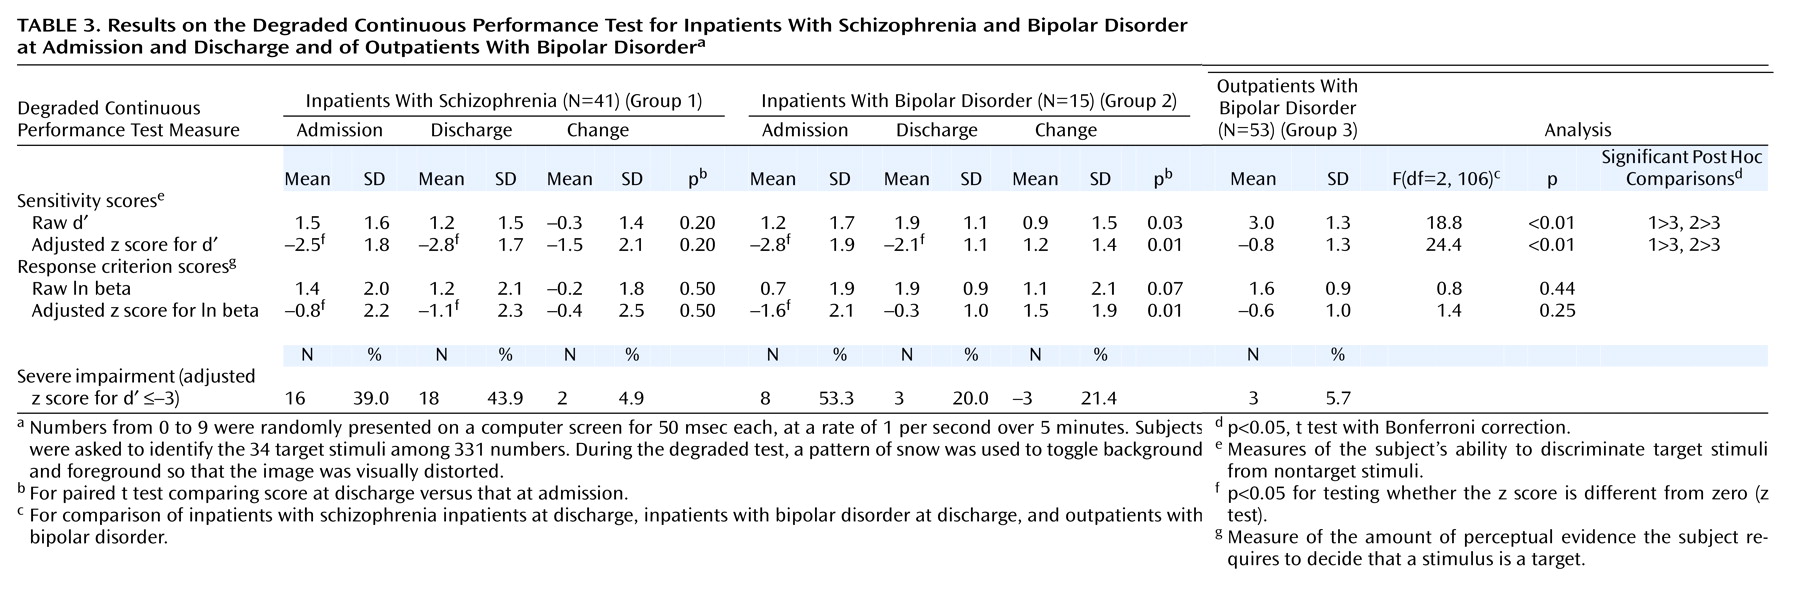
Τhe Continuous Performance Test scores of the patients classified by inpatient or outpatient status are shown in
Table 3. The inpatients with bipolar disorder included four patients without psychotic features and 11 patients with psychotic features. For the patients with schizophrenia, the values of d′ and ln beta did not change from admission to discharge. The d′ values indicated that the schizophrenic patients remained significantly impaired, compared with the general population. In contrast, for the inpatients with bipolar disorder, the d′ and ln beta values showed significant improvements from admission to discharge. The d′ values for these patients indicated that they were still significantly impaired, compared with the general population, but their ln beta values were not different from those of the general population. The same pattern appeared in the proportions of patients with scores below the adjusted z cutoff of –3 for d′ from admission to discharge. No significant change was found for the schizophrenic patients, but the inpatients with bipolar disorder had a significant reduction in the proportion of patients with z scores below the cutoff.
At admission, the mean d′ value for the schizophrenic inpatients was indistinguishable from that for the inpatients with bipolar disorder (
Table 3). However, the mean d′ values for both groups at admission indicated that these patients were more impaired than the outpatients with bipolar disorder. Because the inpatients’ symptoms were relatively remitted at discharge, we also compared their d′ values with those of the outpatients. Both the schizophrenic inpatients and the inpatients with bipolar disorder had significantly lower mean d′ values than the outpatient group, although there was no difference in the means for the two inpatient groups.
When the adjusted z scores for d′ and ln beta were regressed on the clinical characteristics of the patients, with adjustments for other covariates, the association between higher Young Mania Rating Scale scores and poorer adjusted z scores for d′ approached but did not reach statistical significance (regression coefficient beta=–0.07, SE=0.04, p=0.06). In contrast, Hamilton depression scale and BPRS scores had no significant association with adjusted z scores for d′ in patients with nonpsychotic major depression (beta=–0.07, SE=0.05, p=0.19) and schizophrenia (beta=0.01, SE=0.04, p=0.84), respectively. As for duration of illness, no association with the adjusted z score for d′ was found for patients with schizophrenia, bipolar disorder, or unipolar depressive disorder. No association was found between severity of clinical symptoms and ln beta values.
Discussion
Like several previous follow-up studies
(8–
11,
13) and a randomized clinical trial
(12), the present study demonstrated that Continuous Performance Test deficits in schizophrenic inpatients persisted from admission to discharge despite improvements in clinical symptoms. The average magnitude of the deficits in the d′ value in the schizophrenic patients remained at around 2.5 to 2.8 standard deviations below the population mean. In addition, the overall severity of clinical symptoms did not correlate with Continuous Performance Test scores in patients with schizophrenia. Thus, our results support the suggestion that deficits on the Continuous Performance Test versions with a working memory component and/or increased perceptual load are stable vulnerability indicators for schizophrenia.
Our results also indicate that the magnitude of Continuous Performance Test deficits in patients with affective disorders depends on the patient’s subtype of disorder and clinical status. For example, in the present study, the Continuous Performance Test scores of the patients with nonpsychotic major depression in remission were indistinguishable from those of the general population. This finding is in agreement with those of Cornblatt et al.
(24) and Nelson et al.
(26), whose studies included both inpatients and outpatients in the depression group. In contrast, two studies of inpatients with major depressive episodes found that their Continuous Performance Test scores were poorer than those of normal comparison subjects
(35,
36). Results from another study that used a comprehensive neuropsychological test battery also revealed that inpatients with major depression with endogenous features had profiles suggesting attentional impairments
(37). These discrepancies probably arise from differences in patients’ clinical states. Deficits in central motivational state and limitations in cognitive resources are characteristics of depressive episodes, and depressive states have been associated with impairment in allocating resources for sustained attention
(35,
38). Hence, the impairments suggested by performance on the Continuous Performance Test may be merely state-dependent indicators of the clinical severity of the major depression.
For patients with bipolar disorder, the pattern of Continuous Performance Test deficits was more complicated. First, the test performance of these patients depended on their clinical state. When the scores of the inpatients at discharge and the outpatients were pooled, bipolar disorder patients with and without psychotic features performed more poorly than the general population. When the scores of outpatients were considered, bipolar disorder patients’ performance was not significantly worse than that of the general population. Only inpatients with bipolar disorder had significantly lower d′ values than the general population, which is consistent with previous findings that inpatients with bipolar disorder exhibited Continuous Performance Test deficits
(27,
39,
40). This finding is further supported by an association approaching statistical significance between the severity of manic symptoms and d′ values in the regression analysis.
Second, although the Continuous Performance Test impairments of the inpatients with bipolar disorder at admission were as severe as those of the schizophrenic patients, by discharge the bipolar disorder patients had improved more than the schizophrenic patients but still had worse performance than the general population. This finding is consistent with those of a follow-up study of Continuous Performance Test results in inpatients with bipolar disorder
(27) and a follow-up study of general attention measures in first-admission bipolar disorder patients with psychotic features
(41). Thus, the comparison between the Continuous Performance Test scores of schizophrenic patients and bipolar disorder patients is strongly influenced by the clinical state of the bipolar disorder patients. In the present study, the Continuous Performance Test scores of the bipolar disorder patients with and without psychotic features were significantly better than those of the patients with schizophrenia. In contrast, two previous studies found that Continuous Performance Test results for bipolar disorder patients were not significantly different from those for schizophrenic patients
(8,
25). Such inconsistencies might be due to the small numbers of subjects in the studies, as well as to difference in the clinical states of the bipolar disorder patients when they were administered the test. Mixed groups of 19 patients with bipolar disorder in partial remission and 40 outpatients with bipolar disorder in full remission, respectively, were examined in these two studies.
Third, under a stringent definition of Continuous Performance Test deficits (i.e., adjusted z score for d′ was less than or equal to –3), the prevalence of such deficits among the stabilized bipolar disorder patients (9.1% for bipolar disorder patients without psychotic features and 8.7% for bipolar disorder with psychotic features) was much lower than that among the stabilized schizophrenic patients (43.9%). For inpatients with bipolar disorder, the prevalence of such deficits decreased from 53.3% at admission to 20.0% at discharge. The low prevalence of deficits and the change in deficits with change in symptom severity among the bipolar disorder patients indicate that Continuous Performance Test deficits are not useful endophenotypes for bipolar disorder.
Taken together, these results suggest that bipolar disorder patients in the acute stage may exhibit deficits in Continuous Performance Test performance as severe as those of schizophrenic patients. However, as bipolar disorder inpatients achieve clinical remission, their deficits in performance on the test (especially the more difficult degraded version) improve, but not to the level of the general population. Thus, deficits on the degraded Continuous Performance Test are stable vulnerability indicators for schizophrenia but are mediating vulnerability indicators for bipolar disorder.
Another issue is whether the presence of psychotic symptoms in affective disorder makes Continuous Performance Test impairments worse. For patients with unipolar depressive disorder, two recent studies found that attention in patients with psychotic major depression is poorer than in patients with nonpsychotic major depression
(26,
37). Our study did not include any patients with psychotic major depression, and the question of whether sustained attention deficits in these patients are due mainly to the concurrent depressive state and would improve to reach a normal level after clinical remission warrants further investigation. The present study and the study by Sax et al.
(27) found that the Continuous Performance Test deficits of inpatients with bipolar disorder with psychotic features improved at discharge or at 2 months after discharge, respectively. Furthermore, when the analysis was limited to outpatients, we found that impairment on the Continuous Performance Test was similar for the bipolar disorder patients both with and without psychotic features. This finding is consistent with earlier findings that Continuous Performance Test deficits in schizophrenic patients are associated with negative symptoms
(42–
45) and thought disorder or disorganization
(27,
43,
46,
47) but not with concurrent psychotic symptoms. Thus, the effect of psychotic symptoms on the Continuous Performance Test results of patients with affective disorders may be due to concurrent manic symptoms rather than to psychosis per se.
Since many subjects in the present study still suffered from certain psychiatric symptoms, their deficits might have been due to low levels of motivation or to uncooperativeness during the test. However, many patients adopted a similar response criterion to that in the general population. Thus, we do not think that level of motivation or cooperativeness would have had much effect on the findings.
The study findings have several implications that warrant further investigation. First, in terms of the search for an endophenotype for genetic susceptibility, the Continuous Performance Test deficits do have considerable specificity to schizophrenia, compared with the affective disorders. This specificity further strengthens the potential utility of Continuous Performance Test deficits in future gene mapping for schizophrenia. Second, since Continuous Performance Test deficits are mediating vulnerability indicators for bipolar disorder, bipolar disorder patients who still have residual test deficits during remission might be at high risk for relapse. Third, Continuous Performance Test results may serve as a surrogate marker in measuring the effects of interventions for depression. Such a marker would have the potential advantage of not relying on self-report.