Thirty to 60% of patients refractory to conventional antipsychotics respond to clozapine
(1). The pharmacological mechanism(s) through which clozapine exerts its superior efficacy are unknown. Speculation has focused on the unique binding properties of clozapine, including its ability to antagonize the D
4 dopamine receptor, its greater affinity for the 5-HT
2A serotonin receptor versus the D
2 dopamine receptor, and its greater affinity for the D
1 versus the D
2 dopamine receptor
(1). Alternatively, the neural substrate of the pharmacological actions of clozapine may differ in important respects from those of conventional antipsychotics
(2).
Structural and functional imaging techniques have been used to examine the relationship between neuroanatomy and clozapine response. In a computed tomography (CT) study of 34 treatment-resistant patients, clozapine response, as defined by percent change in Brief Psychiatric Rating Scale (BPRS) total score, was related to a smaller prefrontal sulcal prominence
(3). In a second CT study of 42 treatment-resistant patients, those who responded to clozapine according to Clinical Global Impression ratings had smaller frontal and temporal sulci
(4). A magnetic resonance imaging (MRI) study with 18 patients did not observe any significant relationships between morphological variables and clozapine response
(5). In contrast, Lauriello et al.
(6) found that clozapine response was significantly related to larger anterior superior temporal lobe CSF volume. In this MRI study of 21 patients, there were no significant relationships between clozapine response and prefrontal or frontal measures. In SPECT functional neuroimaging studies, increased perfusion in the thalamus and right prefrontal cortex has been associated with clozapine response
(7,
8).
Results
Seventy-five patients entered the double-blind study, and 64 patients completed the study (34 patients randomly assigned to haloperidol and 30 patients assigned to clozapine)
(12). Twenty-three of the 34 haloperidol-treated patients and 22 of the 30 clozapine-treated patients had available MRI scans. There were no significant differences between the patients who received a scan and those who did not on any of the baseline clinical measures.
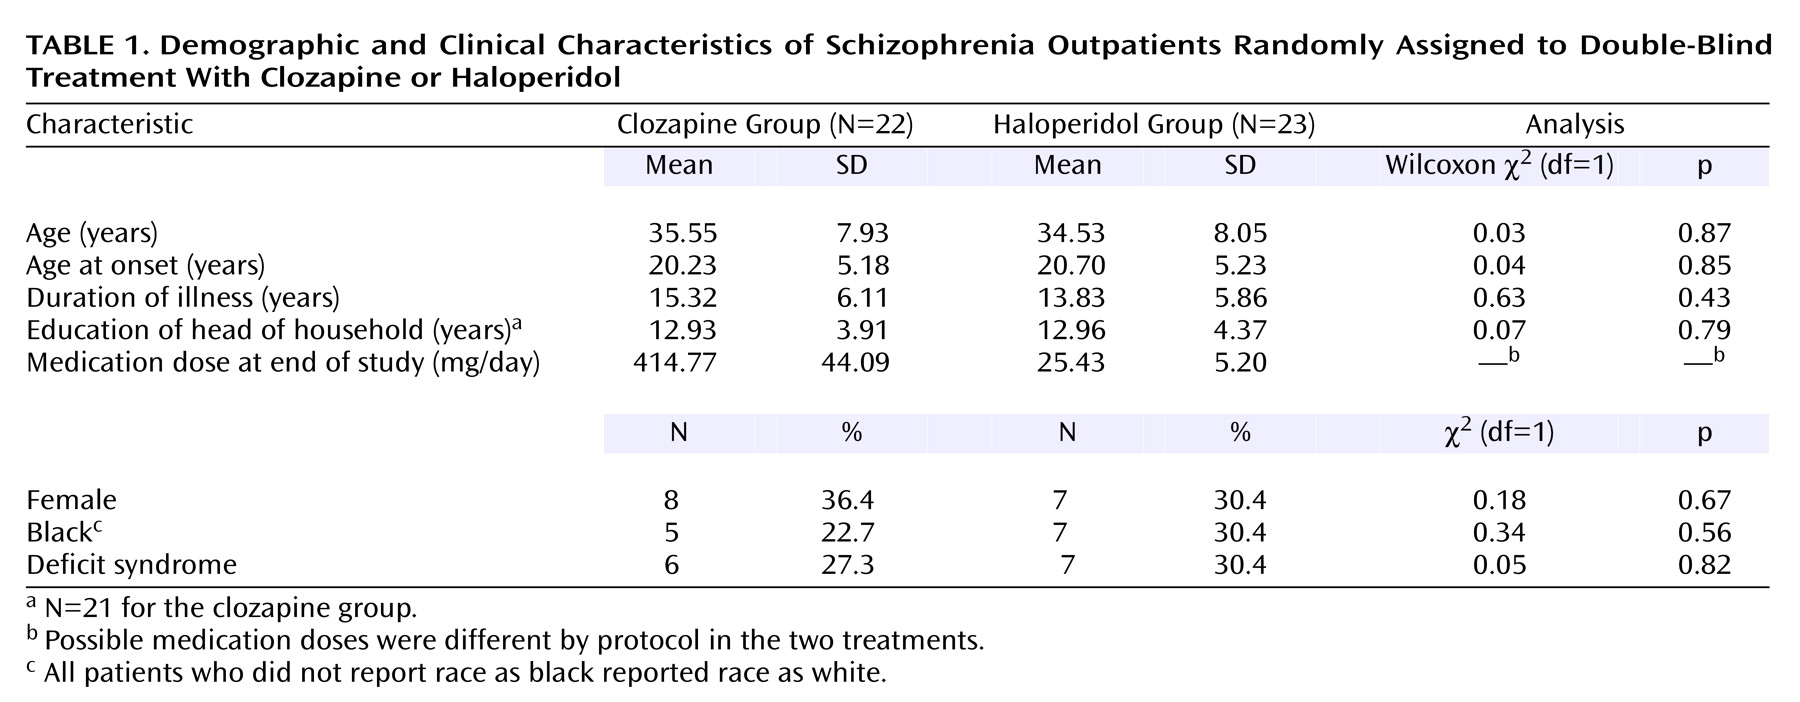
Clinical, sociodemographic, and end-of-study drug dose data are presented in
Table 1. There were no treatment group differences for any of the clinical or sociodemographic variables.
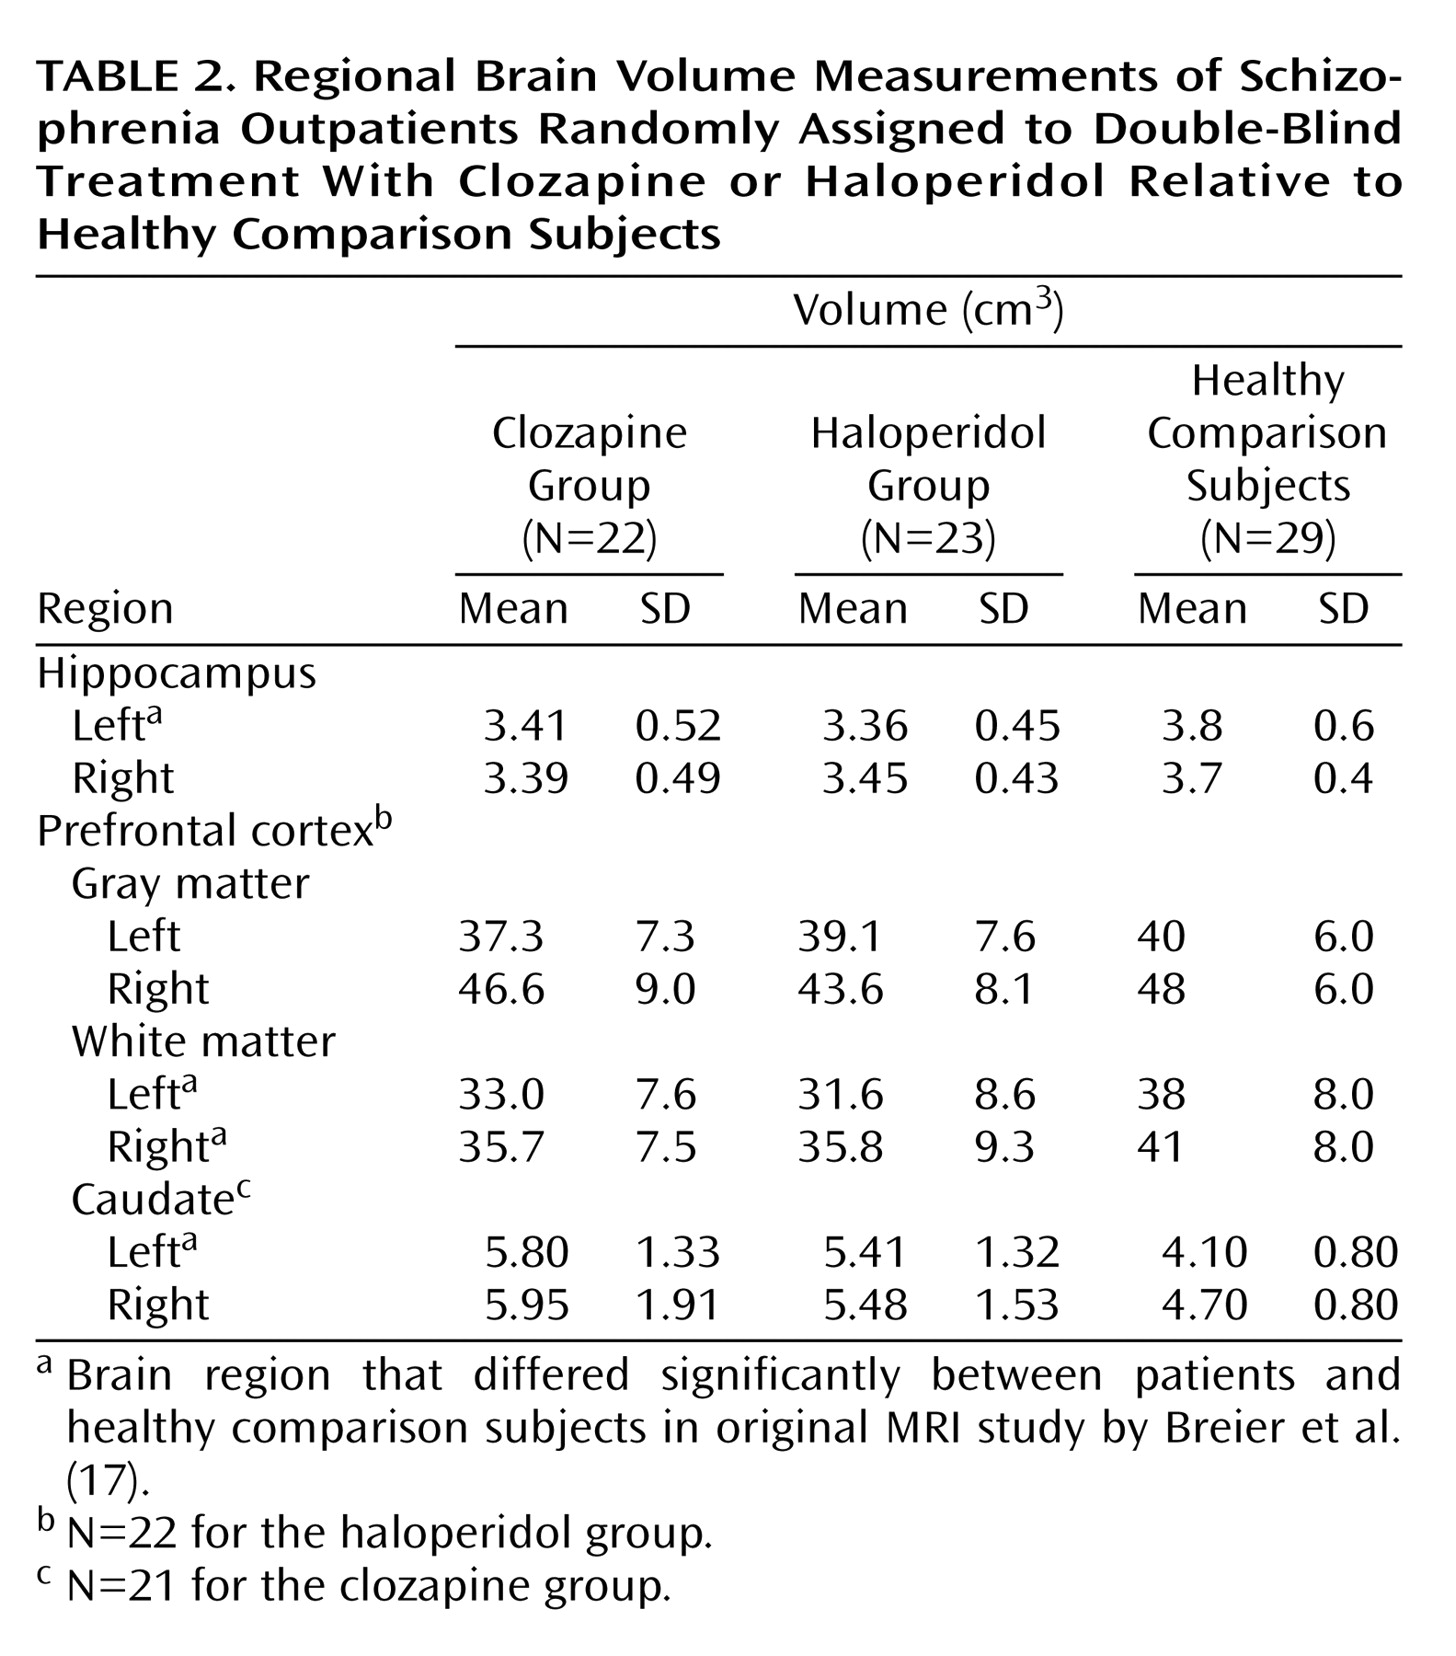
The MRI variables for the two treatment groups are presented in
Table 2. The brain region measurements obtained from a group of healthy comparison subjects, who underwent the same MRI protocol, are presented in the table for the purposes of comparison. The brain regions for which there were significant volumetric differences between the two groups in the original MRI study by Breier et al.
(17) are denoted. There were no significant brain volume differences between the clozapine and haloperidol treatment groups. The prefrontal measures for one patient randomly assigned to haloperidol and the caudate measures for one patient assigned to clozapine were not available because of movement artifact.
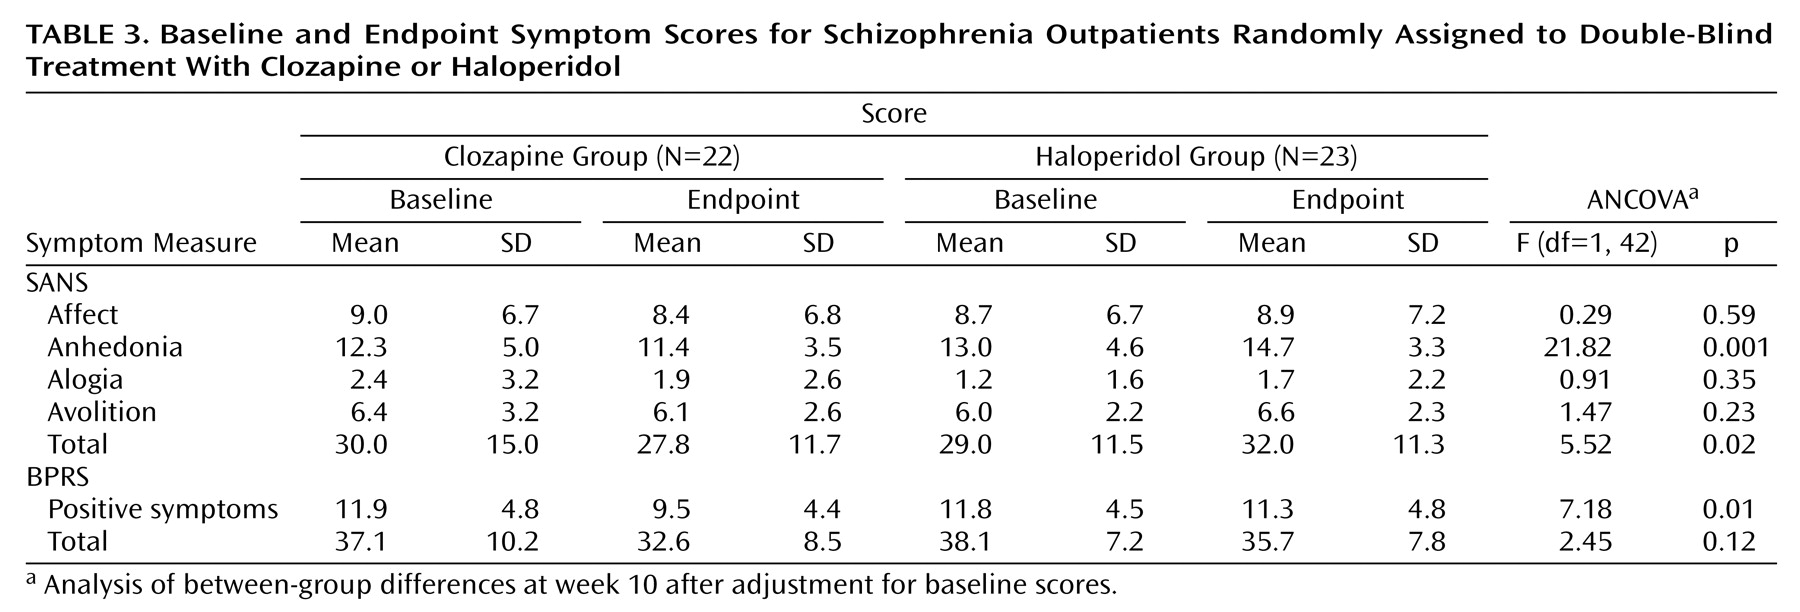
Baseline and end-of-study symptom measures are included in
Table 3. In this subgroup of patients from the original double-blind study for whom we had MRI data, clozapine was significantly superior to haloperidol for the BPRS positive symptom item, SANS total score, and the SANS anhedonia subscale. As shown in
Table 3, patients receiving haloperidol worsened in all negative symptom measures.
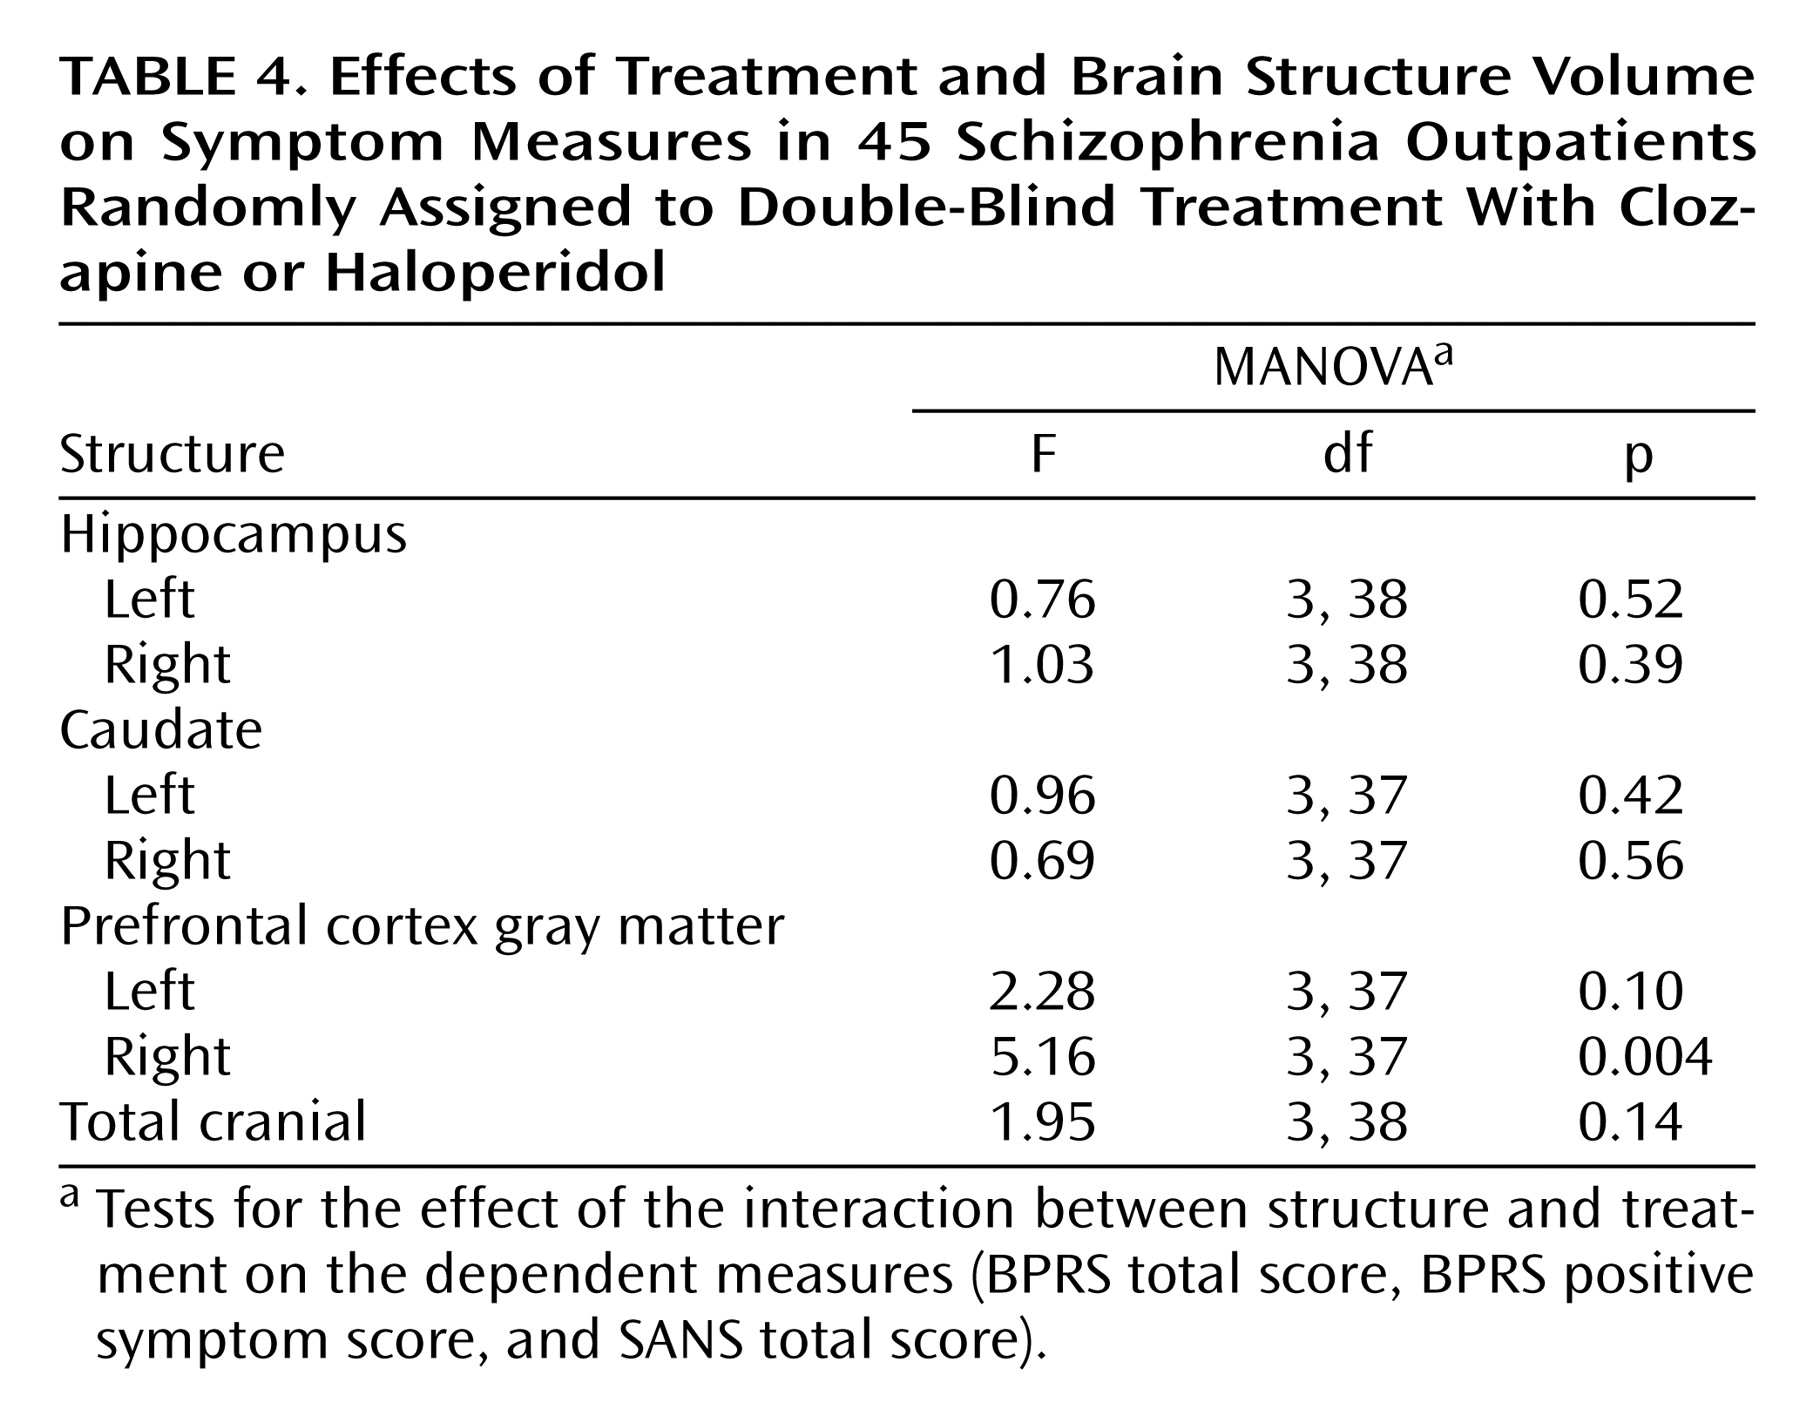
Initial MANOVA analyses were carried out to test for structure-by-treatment interactions, with the BPRS total score, BPRS positive symptom item score, and SANS total score as dependent measures (
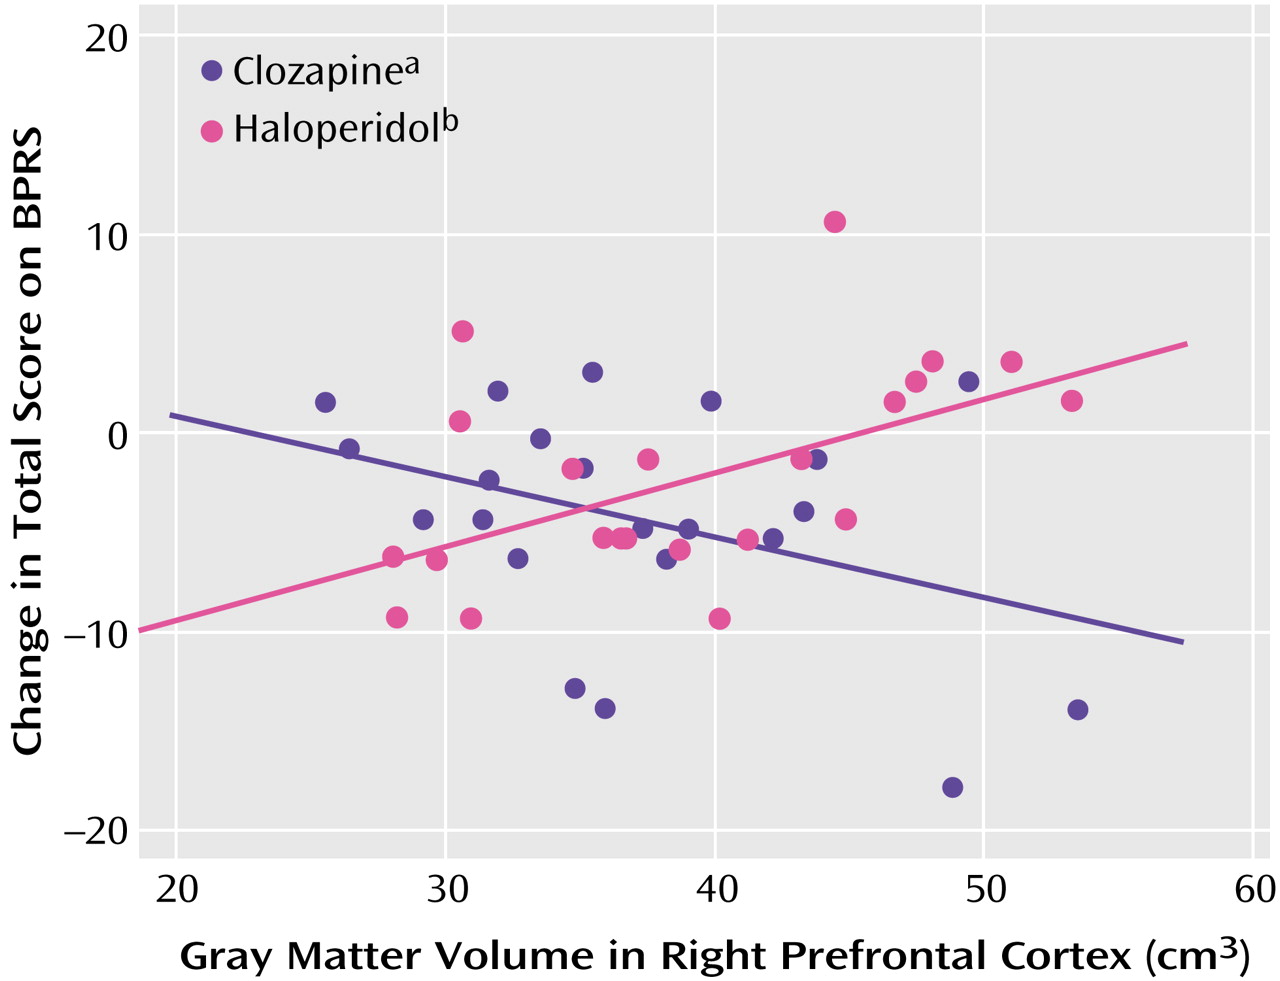
Table 4). Only the interaction between right prefrontal cortex gray matter and treatment was statistically significant. Post hoc tests found significant interactions between right prefrontal cortex gray matter and treatment for the BPRS total score (F=9.89, df=1, 39, p=0.003) (
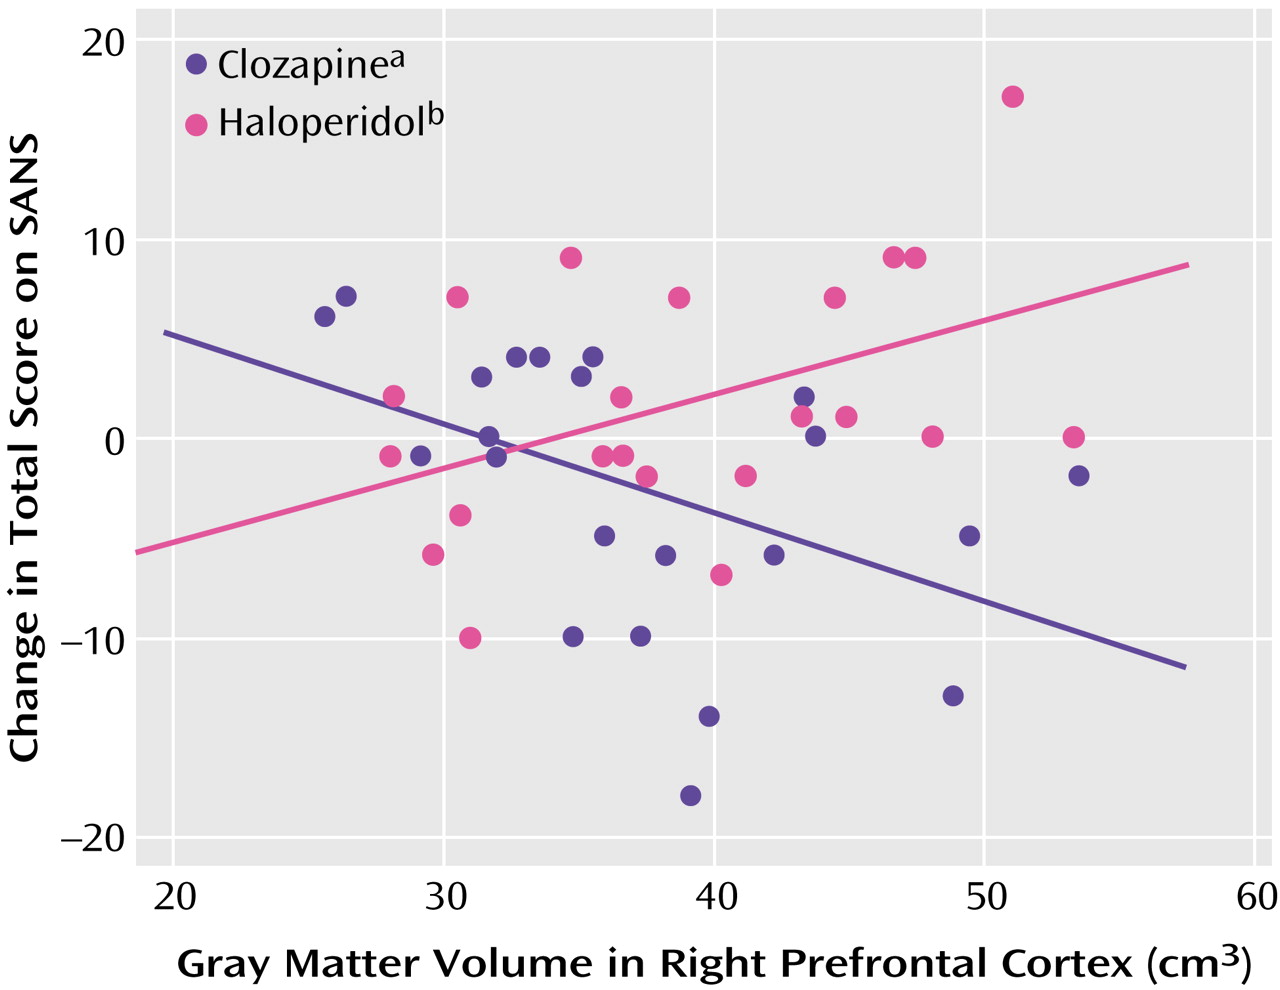
Figure 1) and SANS total score (F=7.29, df=1, 39, p=0.01) (
Figure 2), but not for the BPRS positive symptom item score (F=0.73, df=1, 39, p=0.40).
Spearman rank correlations were conducted to examine within-treatment group relationships between right prefrontal cortex gray matter volume and BPRS and SANS total scores. The right prefrontal cortex gray matter volume and BPRS total score were significantly correlated in the haloperidol group (rs=0.59, p=0.005) but not in the clozapine group (rs=–0.29, p=0.21). The Spearman rank correlation of right prefrontal cortex gray matter volume and SANS total score was statistically significant in the clozapine group (rs=–0.48, p=0.03) but not in the haloperidol group (rs=0.37, p=0.10).
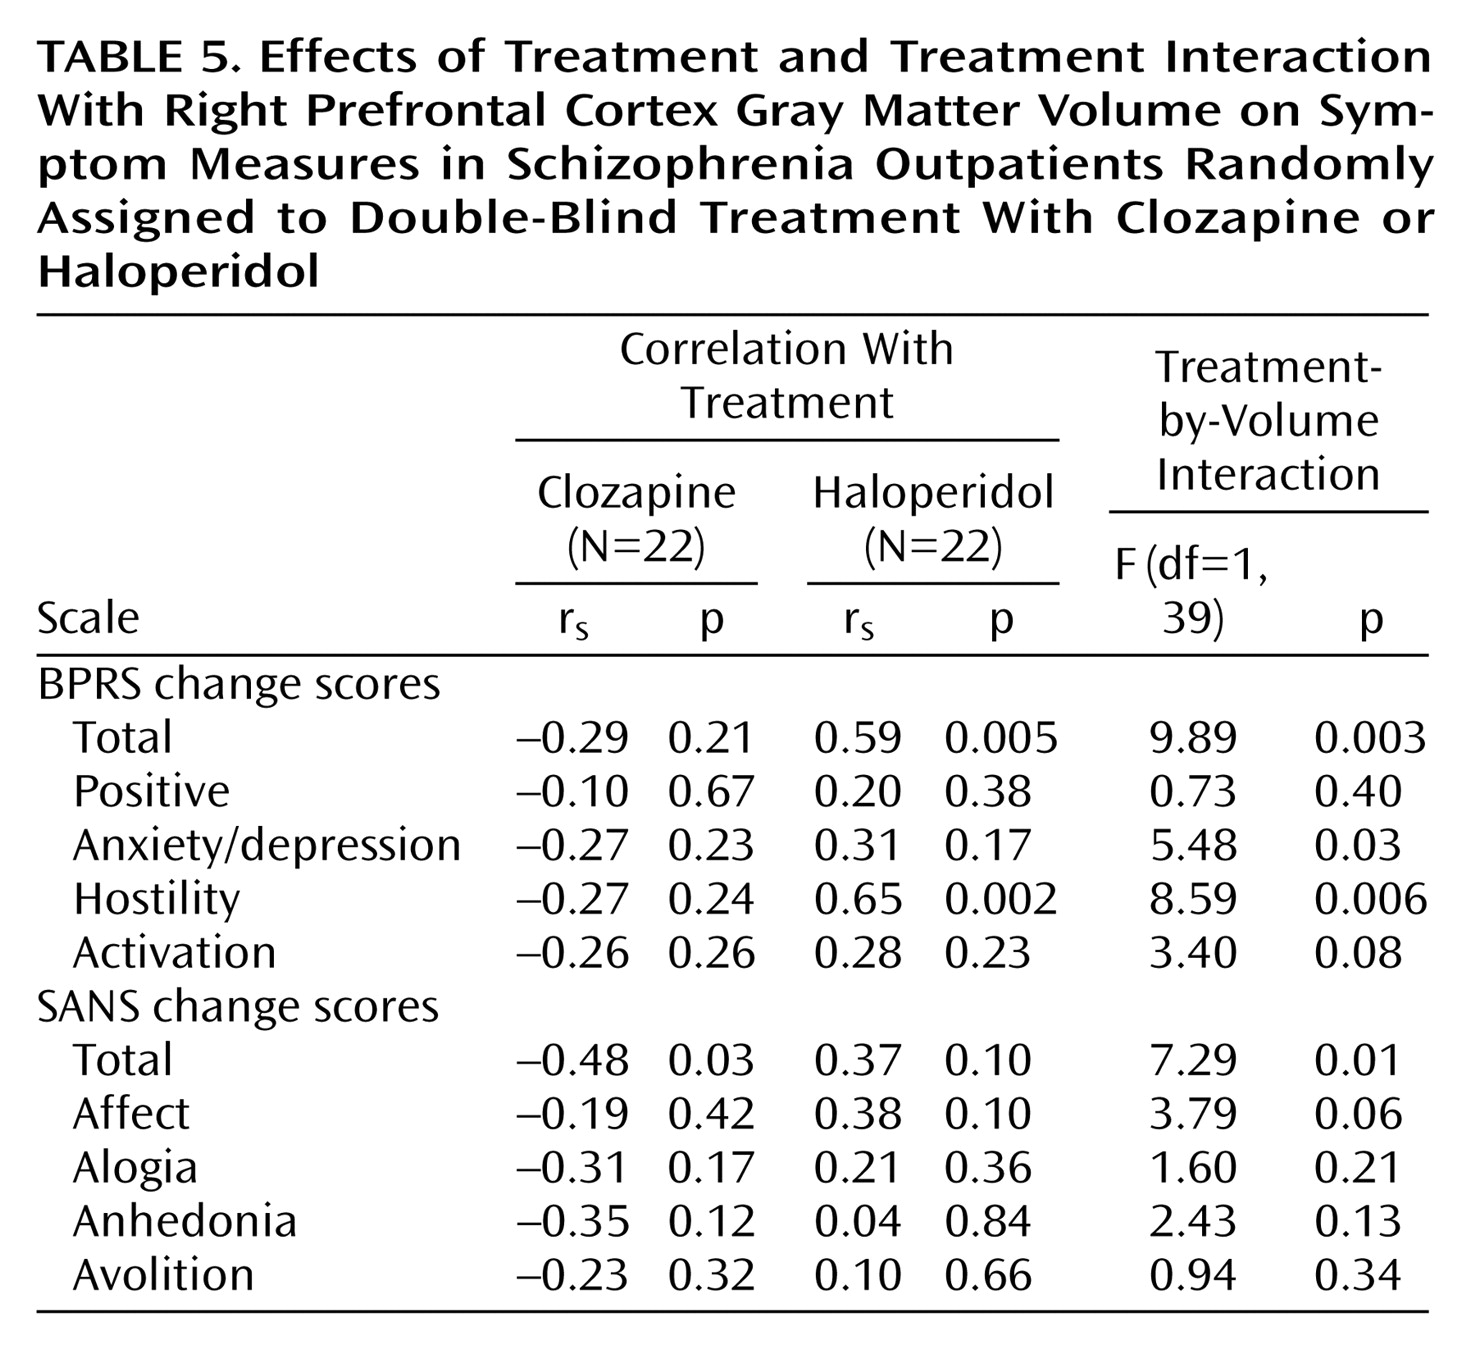
Further exploratory post hoc analyses were carried out to see if the interactions between right prefrontal cortex gray matter and BPRS and SANS total scores reflected effects on specific subscales (
Table 5). There was evidence for significant interactions between right prefrontal cortex gray matter volume and treatment for the BPRS subscales of hostility and anxiety/depression, with tendencies for larger right prefrontal cortex volumes to be correlated with more improvement in the clozapine group but with higher symptom levels in the haloperidol group. The Spearman rank correlation of BPRS hostility subscale score with right prefrontal cortex gray matter volume was statistically significant in the haloperidol group but not in the clozapine group (
Table 5). There was marginally nonsignificant interaction evidence for the SANS affect subscale. There were no significant interactions between right prefrontal cortex gray matter volume and treatment for the other three SANS subscales, although all showed a similar pattern of modest positive correlations between symptoms and right prefrontal cortex gray matter volume for the haloperidol group and negative correlations of symptoms with right prefrontal cortex gray matter volume for the clozapine group.
In order to examine the specificity of the interactions between right prefrontal cortex gray matter volume and symptom measures, we examined separately the interactions between left prefrontal cortex gray matter and treatment for BPRS total score, BPRS positive symptom items, and SANS total score. There were no significant interactions (BPRS total score: F=1.79, df=1, 39, p=0.19; BPRS positive symptom items: F=0.26, df=1, 39, p=0.61; SANS total score: F=1.82, df=1, 39, p=0.18).
The MANOVA analyses to test for treatment-by-structure interactions for Simpson-Angus Rating Scale total and akathisia item scores as dependent measures were nonsignificant. The MANOVA for the interaction between right prefrontal cortex gray matter volume and treatment was marginally nonsignificant (F=3.11, df=2, 37, p=0.057). Post hoc tests found a significant interaction between right prefrontal cortex gray matter and treatment for the Simpson-Angus Rating Scale akathisia item (F=6.15, df=1, 38, p=0.02) but not for the Simpson-Angus Rating Scale total score (F=0.78, df=1, 38, p=0.38). However, the Simpson-Angus Rating Scale akathisia item score had a limited range (0 to 3) and was not normally distributed. Therefore, to confirm these results, we compared the Spearman correlations in the haloperidol group (rs=0.58, p=0.007) and the clozapine group (rs=–0.23, p=0.33) by using the Fisher’s z-transformation test, obtaining marginal support for a difference in correlations between the two groups (z=1.904, p=0.057).
Discussion
The major finding of the study was the observation of significant interaction between treatment and right prefrontal gray matter volume for SANS total score and BPRS total score. In general, in clozapine-treated patients, larger right prefrontal gray matter volume was associated with better treatment response, whereas in haloperidol-treated patients, larger right prefrontal gray matter volume was associated with poorer treatment response. The observation of a significant relationship between right prefrontal cortex volume and SANS total score supports our a priori hypothesis for this region and symptoms. In the clozapine-treated patients, the correlation between change in SANS total score and right prefrontal gray matter volume was significant, i.e., patients with larger brain volumes exhibited a better negative symptom response. There were no significant relationships with any of the SANS subscales. The study failed to support our a priori hypothesis of a predictive relationship between caudate volume and negative symptom response. In contrast to our study hypothesis, there was no relationship between hippocampal volume and positive symptom response. In the haloperidol-treated patients, there was a significant inverse correlation between change in BPRS total score and right prefrontal gray matter volume, i.e., patients with larger brain volumes exhibited a poorer global response. There was also a significant inverse correlation between change in BPRS hostility subscale score and right prefrontal gray matter volume. We had not specified a priori hypotheses for either of these measures.
An important aspect of the study is that the examination of the predictive relationship between morphological brain measures and clozapine treatment response occurred in the context of a double-blind clinical trial. The double-blind study design limits selection bias and, more important, the presence of a comparison treatment arm provides a framework for the interpretation of the observed brain structure and clozapine treatment response relationships.
The relationship between right prefrontal gray matter volume and clozapine response is consistent with some but not all previous studies. In the CT structural imaging studies, sulcal measurements were used to examine the integrity of the prefrontal cortex
(3,
4). Presumably, there is an inverse relationship between sulcal and cortical gray matter measures (i.e., patients with smaller prefrontal sulci have larger prefrontal gray matter volumes). In the Friedman et al. study
(3), there was an inverse relationship between prefrontal sulcal prominence and negative symptom response, as measured by the BPRS, which would be consistent with the current study results. There are also two negative MRI structural imaging studies
(5,
6). In the first study, only global morphological measures are reported, with no specific frontal lobe measures
(5). In the second study, prefrontal volumes were specifically measured, but only prefrontal total volumes were reported
(6). There were not any separate analyses for prefrontal gray and white matter.
In functional imaging studies, clozapine responders showed higher perfusion in the right prefrontal cortex, thalamus, and left basal ganglia
(7,
8). The higher perfusion could be related to larger volumes of these structures. However, neither of these studies examined whether the magnitude of perfusion was related specifically to either positive or negative symptom response. Finally, the plausibility of the observed relationship between right prefrontal gray matter volume and negative symptom response receives indirect support from the Wolkin et al. study
(21), which observed that negative symptom severity was inversely related to glucose metabolism in the right prefrontal cortex.
Clozapine has been repeatedly observed to reduce caudate volumes in patients previously treated with conventional antipsychotics
(22). In a recent study, positive and general symptom response to clozapine was related to reduction in the left caudate volume after clozapine initiation
(23). In the present study, the MRI was obtained before the onset of clozapine treatment. Therefore, the only conclusion that we can make is that baseline caudate volume does not seem to predict clozapine response.
In the current study, there were significant group differences for the SANS total score and anhedonia subscale. In light of the lack of effect of clozapine for primary negative symptoms
(12,
24,
25), how can the observation of a significant predictive relationship between right prefrontal cortex gray matter volume and negative symptoms be interpreted? One possible explanation is that clozapine may not be exerting a direct beneficial effect on negative symptoms but rather that the modest negative symptom benefit of clozapine represents a reduction in side effects and that the worsening with haloperidol represents an exacerbation of side effects. Patients with larger right prefrontal cortex gray matter volumes may be better able to take advantage of the unique pharmacological profile of clozapine and experience a greater decrease in side effects, whereas patients with larger right prefrontal cortex gray matter volumes may be more susceptible to the side effects caused by haloperidol. There are several lines of evidence that support this interpretation. First, the group differences in negative symptom effect were not due to a pronounced benefit of clozapine for these symptoms. There was only a 7.3% improvement in SANS total score in the clozapine-treated patients, whereas there was a 10.3% worsening in the haloperidol-treated patients. Second, several studies have documented a relationship between change in negative symptoms and change in extrapyramidal side effects in clozapine-treated patients. In the studies of Kane et al.
(26) and Pickar et al.
(27), there were marked changes in both negative symptoms and extrapyramidal side effects. Lieberman et al.
(28) observed that the presence of extrapyramidal side effects during previous treatment with conventional antipsychotics was a predictor of good response to clozapine, and Rosenheck et al.
(29) observed that the differential effect of clozapine on negative symptoms disappeared when the analyses were corrected for change in extrapyramidal side effects. Third, in the post hoc analyses, there was a significant interaction between right prefrontal cortex gray matter volume and treatment for the BPRS anxiety/depression factor. Marder and Van Putten
(30,
31) have shown that anxiety and depression are correlated with extrapyramidal side effects and that they may in themselves represent subtle forms of extrapyramidal side effects. There was also a significant interaction for the Simpson-Angus Rating Scale akathisia item, with right prefrontal cortex gray matter volume significantly correlated with change in akathisia severity in the haloperidol-treated patients. In addition, although the interaction was not significant, right prefrontal cortex gray matter volume was significantly inversely correlated with change in Simpson-Angus Rating Scale total score (r
s=–0.51, p=0.02) in the clozapine-treated patients. The correlation was nonsignificant but in the opposite direction in the haloperidol-treated patients (r
s=0.21, p=0.37).
Clozapine has unique dopamine and serotonin receptor binding properties
(32,
33), which may serve to mediate the observed relationship between right prefrontal cortex gray matter volume and treatment response. Specifically, there is an abundance of 5-HT
1A and 5-HT
2A serotonergic receptors in the prefrontal cortex. These receptors regulate dopamine release. Clozapine has a high affinity for these receptors, and it may increase prefrontal cortex dopamine release through its action at these receptors, which would counteract the adverse effects of conventional antipsychotics
(34,
35).
In summary, we found that haloperidol-treated patients were more sensitive to the adverse effects of this drug if they had larger right prefrontal cortex gray matter volumes. In contrast, clozapine-treated patients were more likely to experience the benefit of the benign neurological side effect profile of this agent to the extent to which their right prefrontal cortex gray matter was larger in volume. The mechanisms underlying this relationship may be of considerable interest in developing new therapies for schizophrenia.
