A number of neuroimaging studies have examined morphometric changes in temporolimbic brain regions of patients with major depressive disorder. Several have reported volumetric differences in hippocampal size, but reports have been mixed. Conclusive evidence from volumetric magnetic resonance imaging (MRI) studies of lower hippocampal volume associated with major depressive disorder has been elusive. Studies have reported bilateral
(1,
2) and unilateral right
(3) and left
(4,
5) deficits relative to comparison subjects, whereas others have reported no change relative to comparison subjects
(6,
7). This discrepant body of literature has been summarized
(8–
10), but to date the studies have not been examined statistically in the aggregate. Furthermore, no reviews have systematically examined factors that might contribute to the discrepancies between reports.
Inclusion of the adjacent amygdala with the hippocampus in the region of interest may influence volumetric assessment of the combined complex, since the amygdala, sitting at the anterior head of the hippocampus, can be difficult to delineate and may add variance to the findings. Furthermore, volumetric differences in the amygdala may not mimic those in the hippocampus. In patients with depression, the amygdala has been reported to be either lower in volume
(7,
11) or higher in volume
(5,
12); higher volumes have been reported in patients with bipolar disorder
(13) or other neuropsychiatric disorders such as depression and epilepsy
(14,
15). Bowley and colleagues
(16) have reported a substantially lower glial density in the amygdala in major depressive disorder patients.
Despite these methodological differences, data from these studies are important. The hippocampus has increasingly been the focus of animal, postmortem, and clinical examinations of the pathophysiological underpinnings of depression, and the suggestion that it is lower in volume as a consequence of this illness has been influential in guiding these studies. We were interested, therefore, in examining these studies in the aggregate in order to determine whether the studies do, in fact, suggest there is lower hippocampal volume in patients with major depressive disorder. We were further interested in examining factors that may contribute to the disparate results in the literature so that future studies might attend to factors that may critically determine observed results. We therefore conducted a meta-analysis of studies published to date that used MRI to assess the volume of the hippocampus and related structures in patients with major depressive disorder.
Method
Studies were included if they met the following criteria: 1) the patient population had a diagnosis predominantly of major depressive disorder according to recognized criteria; 2) hippocampal volume was a dependent variable; 3) MRI analysis was used to assess hippocampal volume; and 4) comparison subjects were included.
An extensive MEDLINE search of online listings between August 1960 and August 2002 using the medical subject headings (MESH) “depression, major depressive disorder, unipolar depression, MRI, magnetic resonance imaging, hippocampus or amygdala” as well as cited references in articles or review papers revealed 20 scientific papers that met these criteria. One study that found lower left hippocampal volume
(17) was excluded, since volume measurements were not available because of the computer-driven hippocampal segmentation technique used. Pantel and colleagues reported in English
(18) and in German
(19); the report published in English was included in this analysis. Sheline et al. included the patient group from their 1996
(2) article in their 1999
(1) study; therefore, the 1996 study was excluded from the analysis. Two papers had divided their patient population into two groups, and we retained that division in our analysis. Vythilingam et al.
(20) compared both depressed subjects who had undergone abuse and those that had not with healthy subjects. MacQueen and colleagues
(21) looked at patients undergoing their first episode and those suffering multiple episodes of depression.
Data from the 17 retained papers
(1,
3–
7,
11,
12,
18,
20–27) were separated into categories for assessment. To assess the impact of the amygdala on measured volume, studies were placed into three categories: those that measured the volume of the hippocampus (12 studies), those that measured the volume of the amygdala (six studies), and those that measured the volume of the combined structure (four studies). To assess the impact of slice thickness on hippocampus volume measurements, 10 studies were divided into two categories on the basis of slice thickness: >1.5 mm (N=5) and ≤1.5 mm (N=5).
Standard deviations were pooled and z scores calculated for each group. The z scores were then summed and tested for significance by using a confidence level of 95%. Analyses were repeated after removing studies that included ECT-treated patients and then those that included bipolar disorder patients to assess the impact of these studies. Right and left sides were analyzed independently.
Results
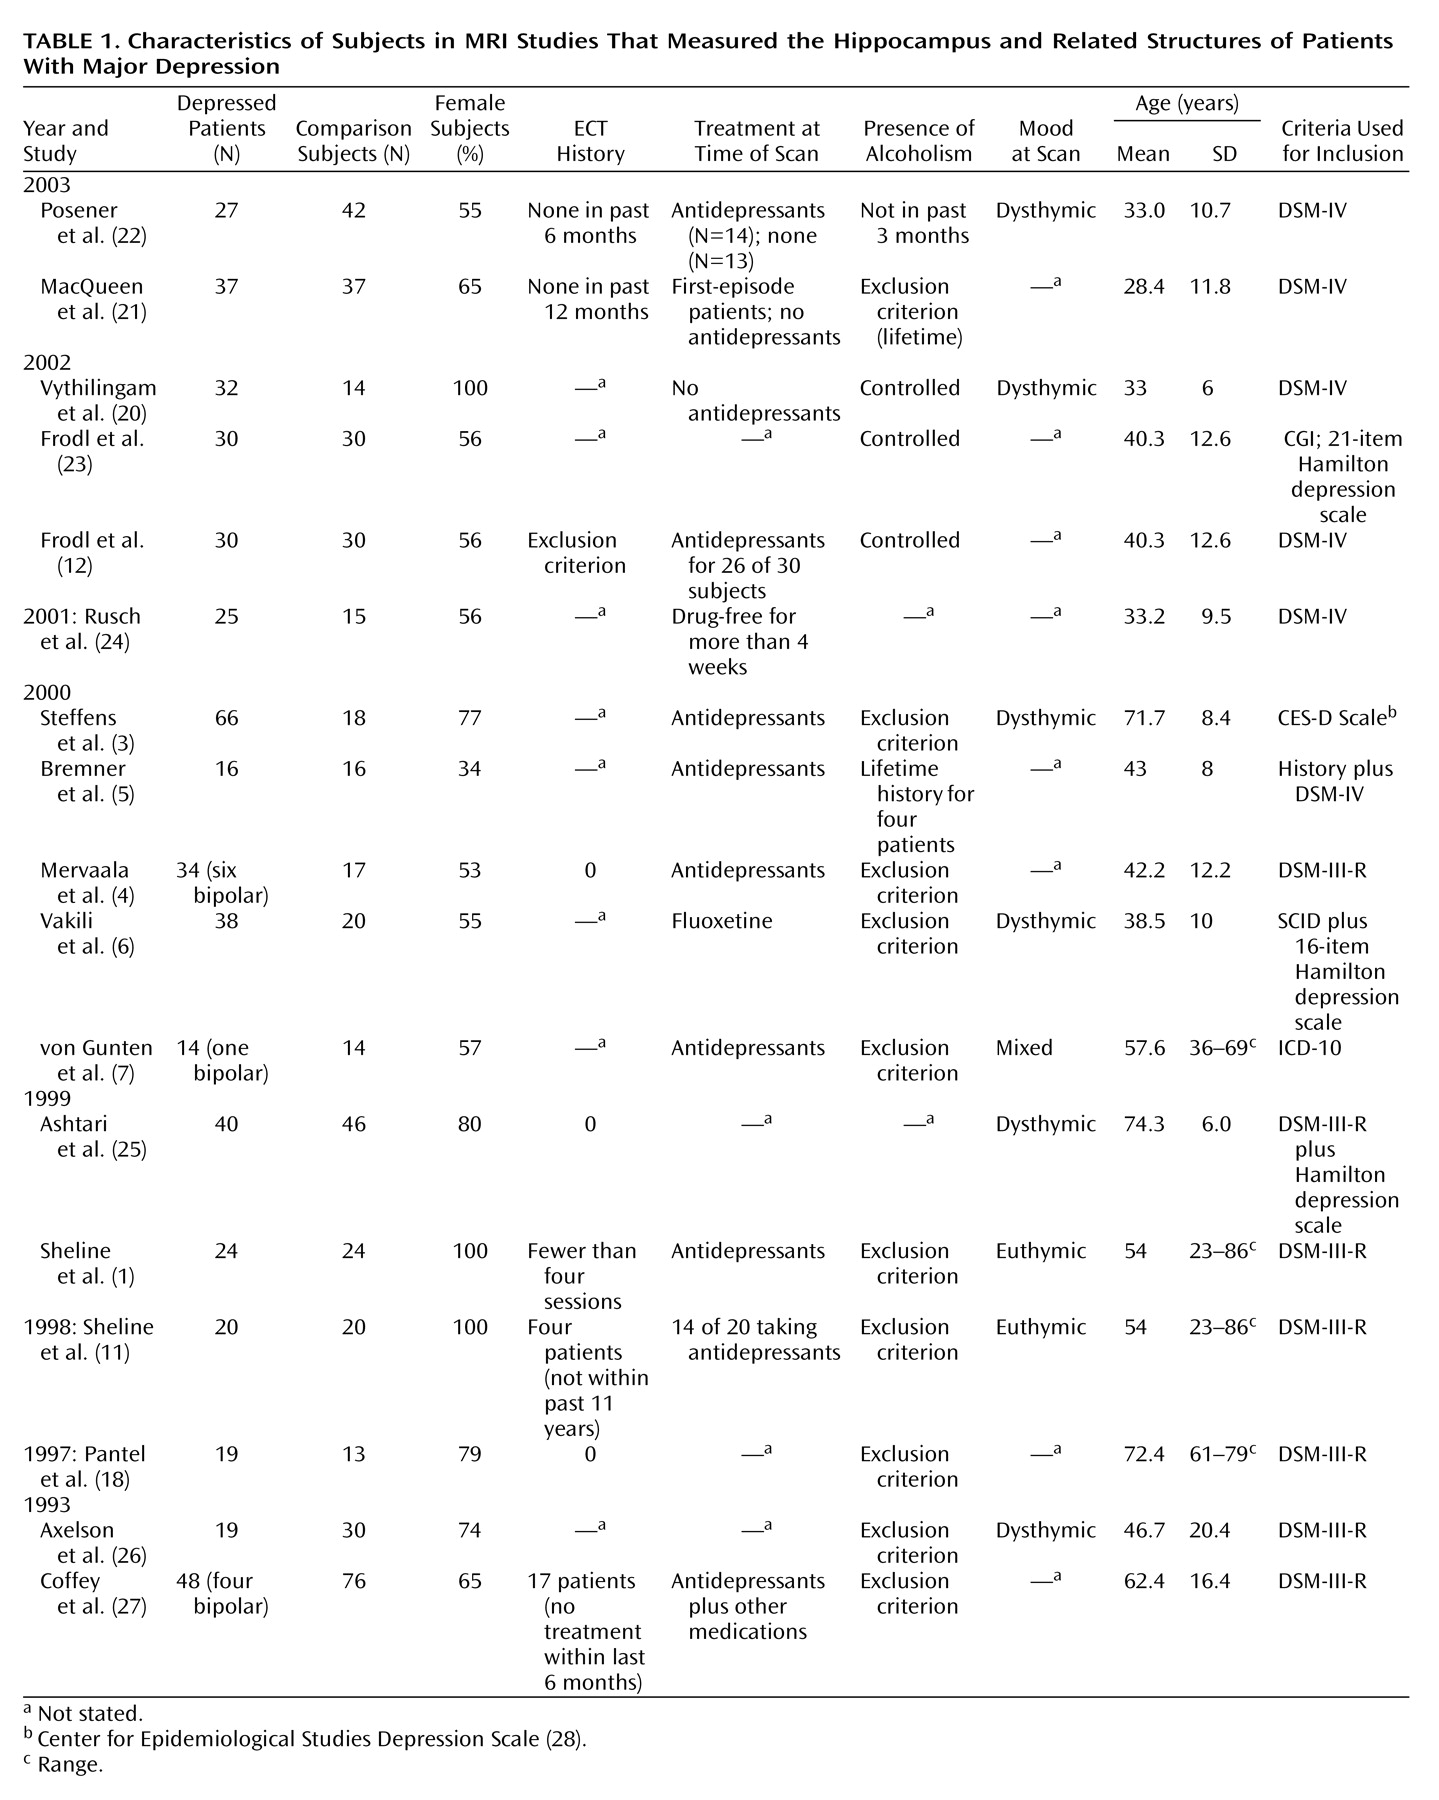
Subject parameters are recorded in
Table 1. A total of 434 patients and 379 comparison subjects were analyzed. Ages of patients ranged from 23 to 86 years of age. In only two studies were the subjects stated to be drug-free
(20,
24), although MacQueen et al.
(21) stated that all first-episode patients were never treated at the time of the beginning of the study for a minimum of 4 weeks. Subjects with current alcohol dependence were excluded from 10 of the 17 studies included for analysis, and mood at time scanned was euthymic for two studies
(1,
11), dysthymic for six studies
(3,
6,
20,
22,
25,
26), varied for one study
(7), and unrecorded for the others. Of the entire patient sample, 11 patients were diagnosed as bipolar, and an estimated 28 had undergone ECT. Removal of studies including ECT-treated patients and then those that included bipolar disorder patients from aggregate analysis did not change the significance of the finding of lower hippocampal volume in depressed patients (which will be subsequently discussed). With the ECT-treated patients removed, the left hippocampus and combined hippocampus and amygdala in the depressed subjects remained significantly lower (95% confidence interval (CI) of z scores=–0.398 to –0.109) as did the right hippocampus and combined hippocampus and amygdala (95% CI of z scores=–0.373 to –0.086). The same measurements remained significant after removal of the bipolar disorder patients (95% CI of z scores=–0.395 to –0.101 and –0.378 to –0.085, respectively).
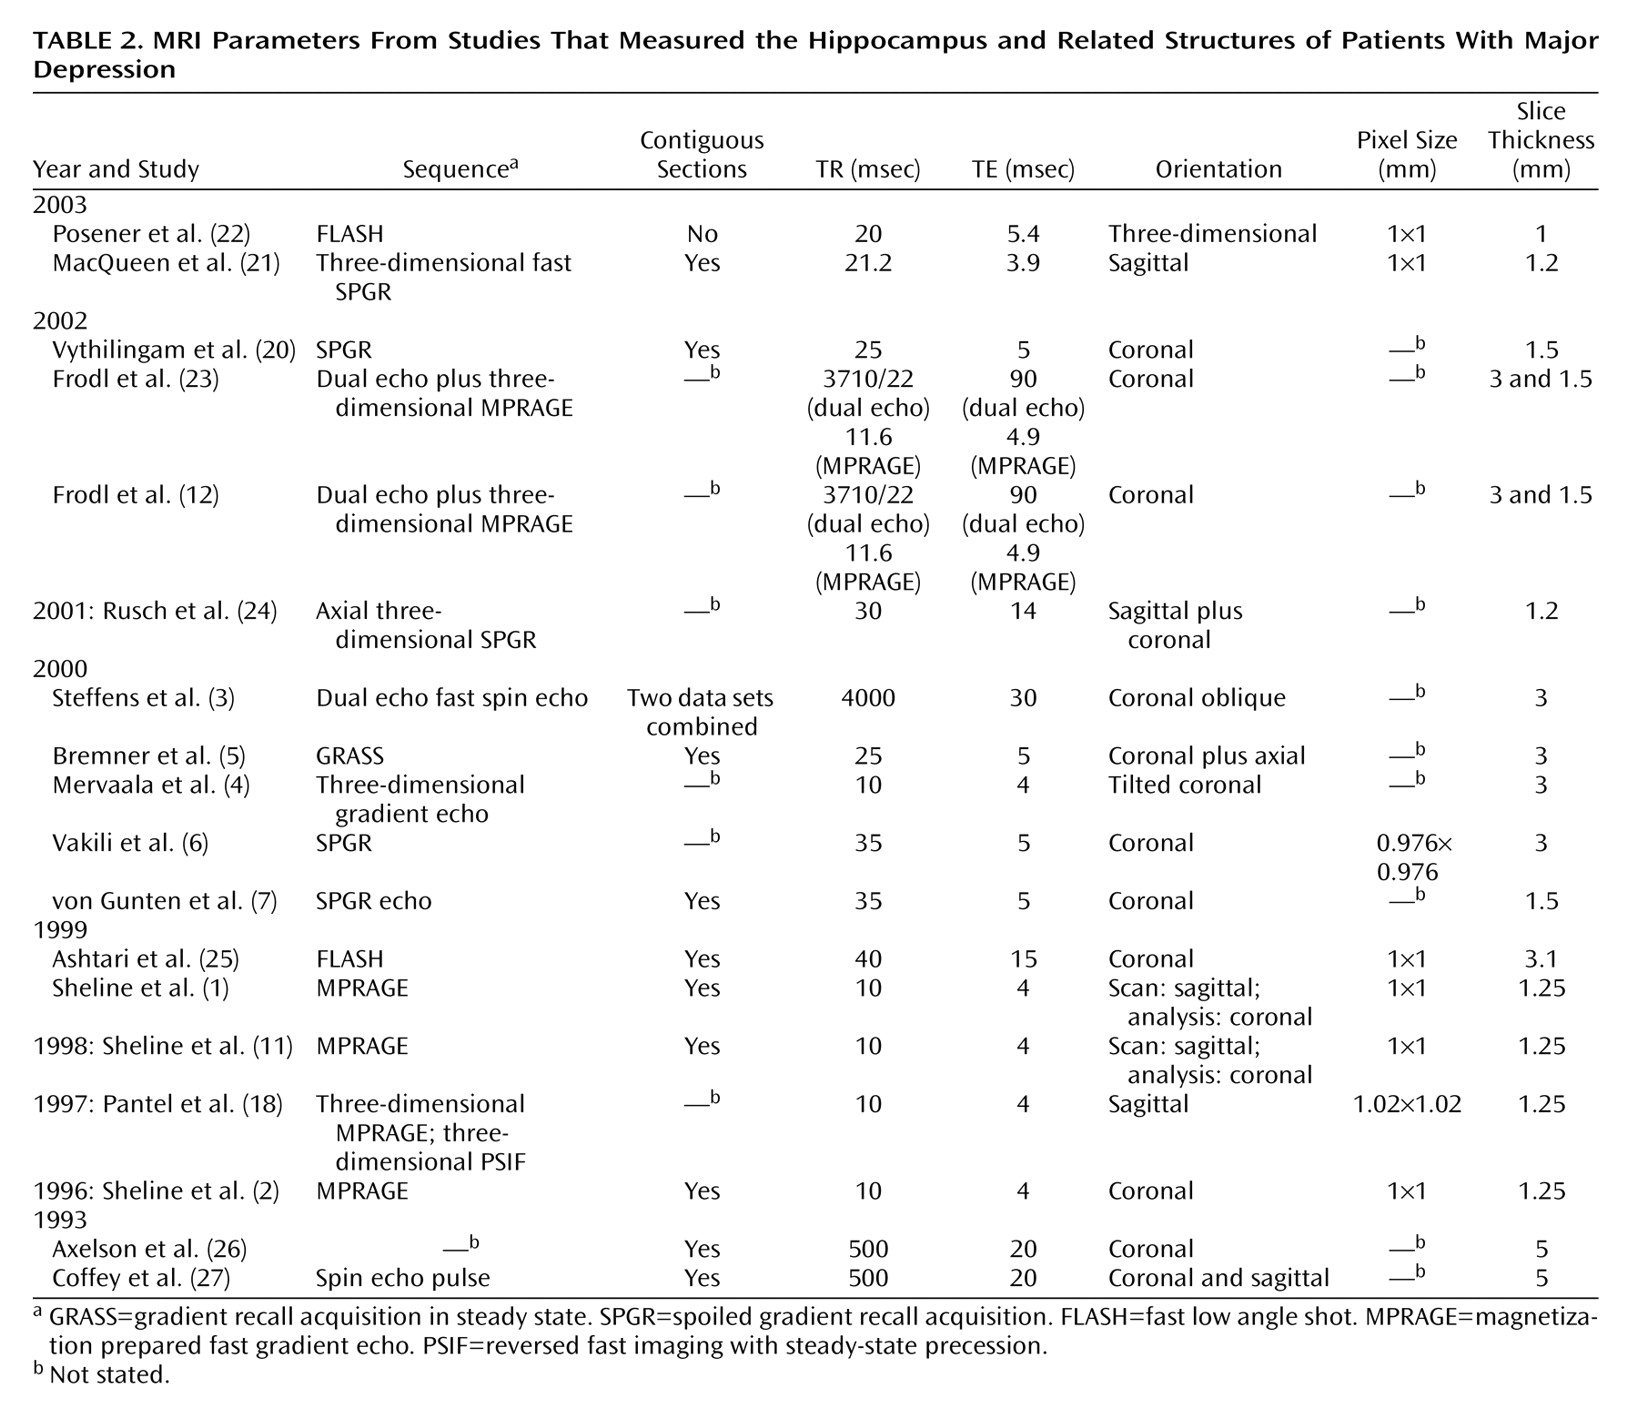
MRI parameters are recorded in
Table 2. Slice thickness varied between 5 mm and 1.0 mm thick, and in regression analysis, was shown to contribute minimally to variation in hippocampal volume (<10%, data not shown). Comparison of data collected using both thick and thin slices showed that a significant difference was retained between depressed patients and comparison subjects for both levels of MRI resolution with the left hippocampus (slice thickness >1.5 mm: 95% CI of z scores=–0.695 to –0.164; slice thickness ≤1.5 mm: 95% CI of z scores=–0.492 to –0.078) and with thick slices of the right hippocampus (slice thickness >1.5 mm: 95% CI of z scores=–0.645 to –0.164), but that the difference between depressed and comparison groups failed to reach significance with thin slices of the right hippocampus (slice thickness ≤1.5 mm: 95% CI of z scores=–0.417 to 0.004). Coronal, tilted coronal, and sagittal orientations were all used to collect the data. When evaluated as a group, studies measuring hippocampal volume by using MRI scans in the coronal or tilted coronal orientation (eight studies [
3–
7,
20,
23,
25]) retained significance (left hippocampus: 95% CI of z scores=–0.577 to –0.186; right hippocampus: 95% CI of z scores=–0.496 to –0.118), whereas studies that used multiple orientations (four studies [
1,
21,
22,
24]) retained significance on the right (95% CI of z scores=–0.542 to –0.010) but not on the left (95% CI of z scores=–0.519 to 0.014).
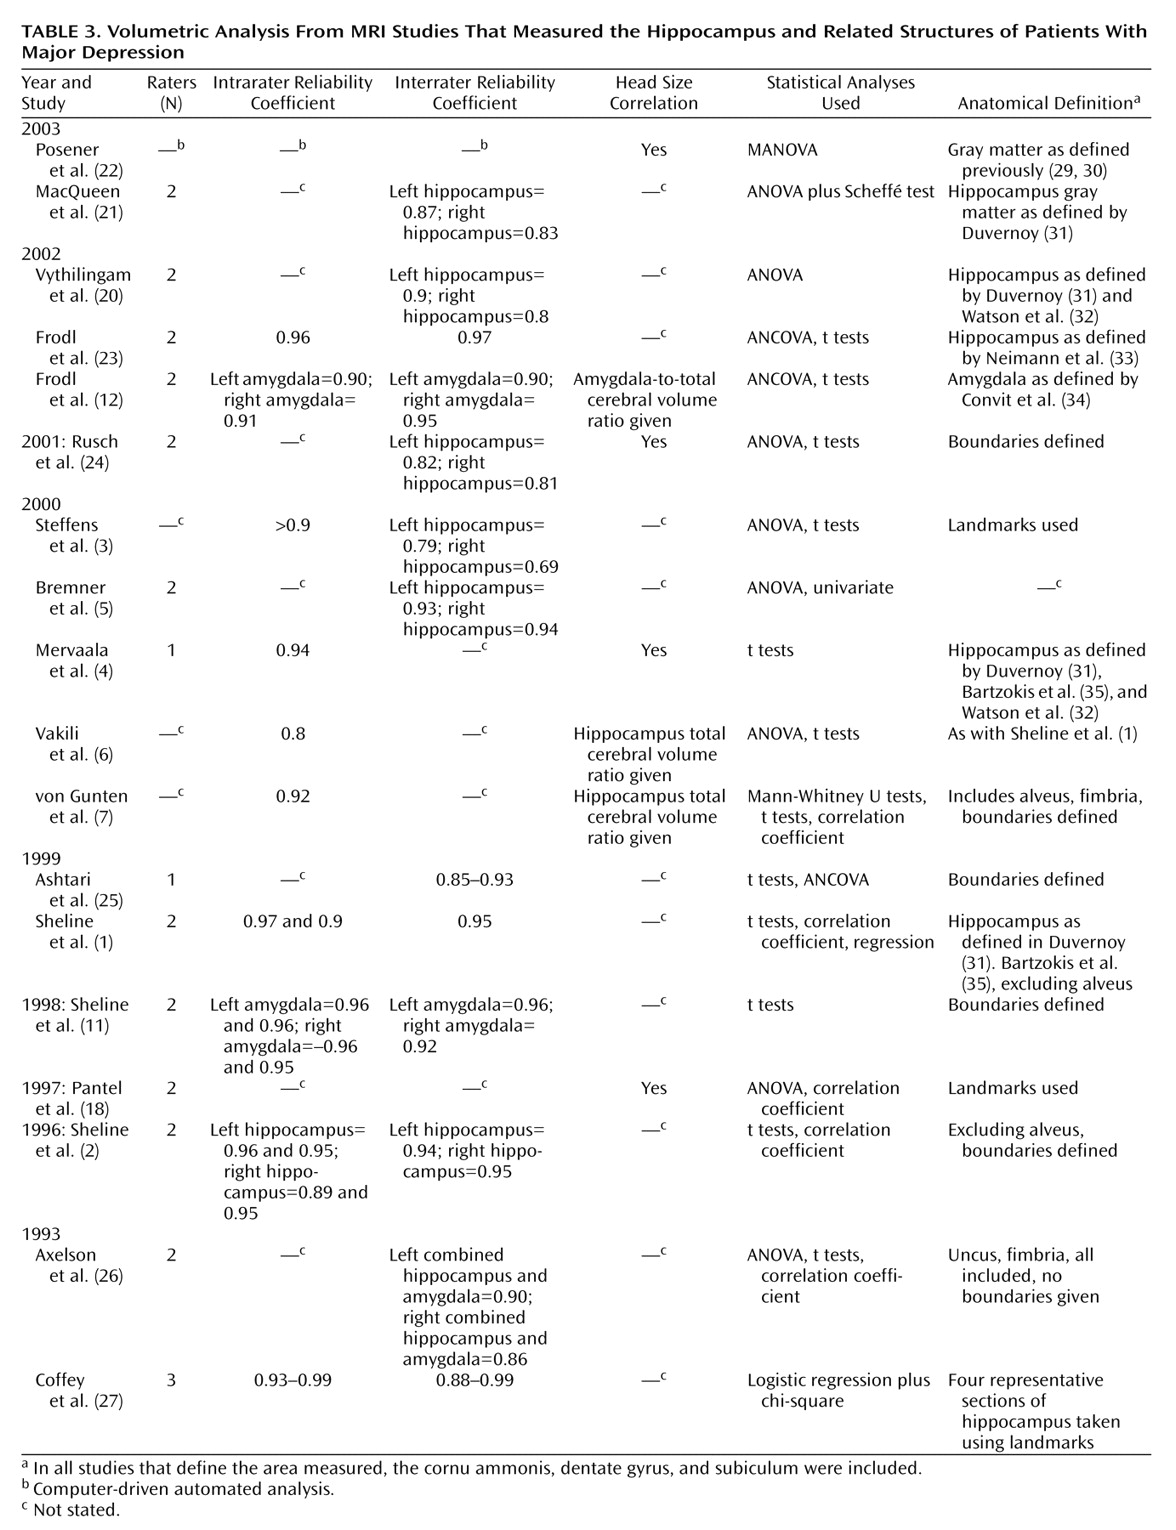
Table 3 records volumetric analysis parameters. Six of the 18 studies corrected for head size. The reported interrater reliability coefficients ranged from 0.69 to 0.99.
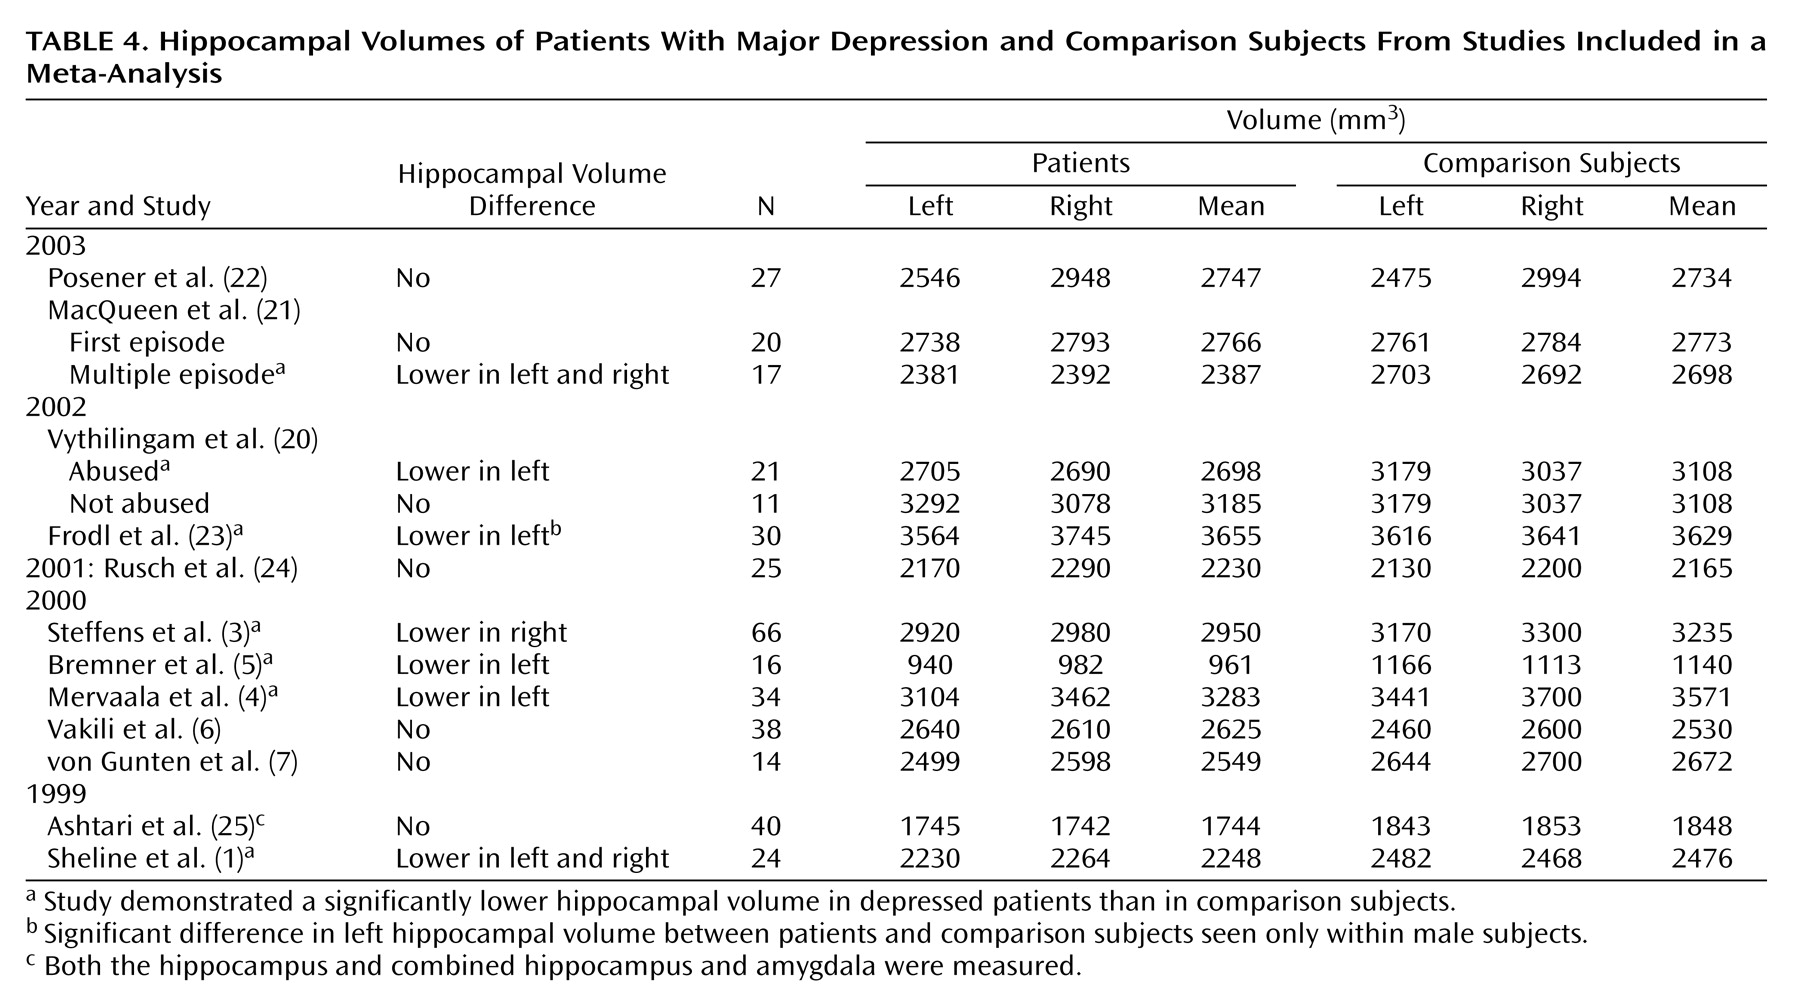
The volume of the hippocampus was measured for 393 patients and 303 comparison subjects in 12 studies (
Table 4). Hippocampal volumes (means of right and left) ranged from 961 mm
3 to 3655 mm
3 for patients and 1140 mm
3 to 3629 mm
3 for comparison subjects. The lowest measurement
(5) was obtained when the head and tail of the hippocampus were excluded and only the body of the hippocampus was measured. The resulting value was less than half the measured volume of the next lowest measurement. Frodl and colleagues
(23), who included the alveus in their measurements of hippocampal volume, had the highest values for both patients and comparison subjects. Despite variation in the measurement techniques and patient samples, combining results from studies measuring the hippocampus alone showed depressed patients had significantly lower volumes relative to comparison subjects in the left hippocampus (95% CI of z scores=–0.485 to –0.170) and in the right hippocampus (95% CI of z scores=–0.445 to –0.131). A significant difference was more often detected between patients and comparison subjects in the left hippocampus (six of 12 studies) than in the right hippocampus (three of 12 studies).
The volume of the amygdala was measured for 138 patients and 121 comparison subjects in six studies (
Table 5). Mean amygdala volumes for comparison subjects ranged from 1341 mm
3 to 2291 mm
3. The mean amygdala volume measured for the patient group ranged from 1624 mm
3 to 2298 mm
3. The Mervaala study
(4) had a mean amygdala volume 350 mm
3 greater than the next highest value for patients. The anatomical definition that resulted in these high values was not described in the published article and may include regions not measured by other studies. Sheline and colleagues
(11) measured only the core nuclei of the amygdala. Four of six studies showed significant differences between amygdala volumes of depressed patients relative to comparison subjects. These differences reflected both a higher amygdala volume
(5,
12 [Bremner et al. did not test for significance]) and a lower amygdala volume
(1,
7,
11) relative to comparison subjects. No significant difference was therefore detectable when analyzed in the aggregate between depressed patients and healthy subjects in the left amygdala (95% CI of z scores=–0.247 to 0.255) or the right amygdala (95% CI of z scores=–0.185 to 0.314).
The hippocampus and amygdala together were measured for 126 patients and 165 comparison subjects in four studies (
Table 6). The measured mean values (average of left and right) ranged from 3210 mm
3 to 4525 mm
3 for patients and 3300 mm
3 to 4685 mm
3 for comparison subjects (
Table 6). No significant difference between depressed patients and comparison subjects was found, either in any of the individual studies or in the aggregate, for the left combined hippocampus and amygdala (95% CI of z scores=–0.342 to 0.126) or right combined hippocampus and amygdala (95% CI of z scores=–0.392 to 0.077).
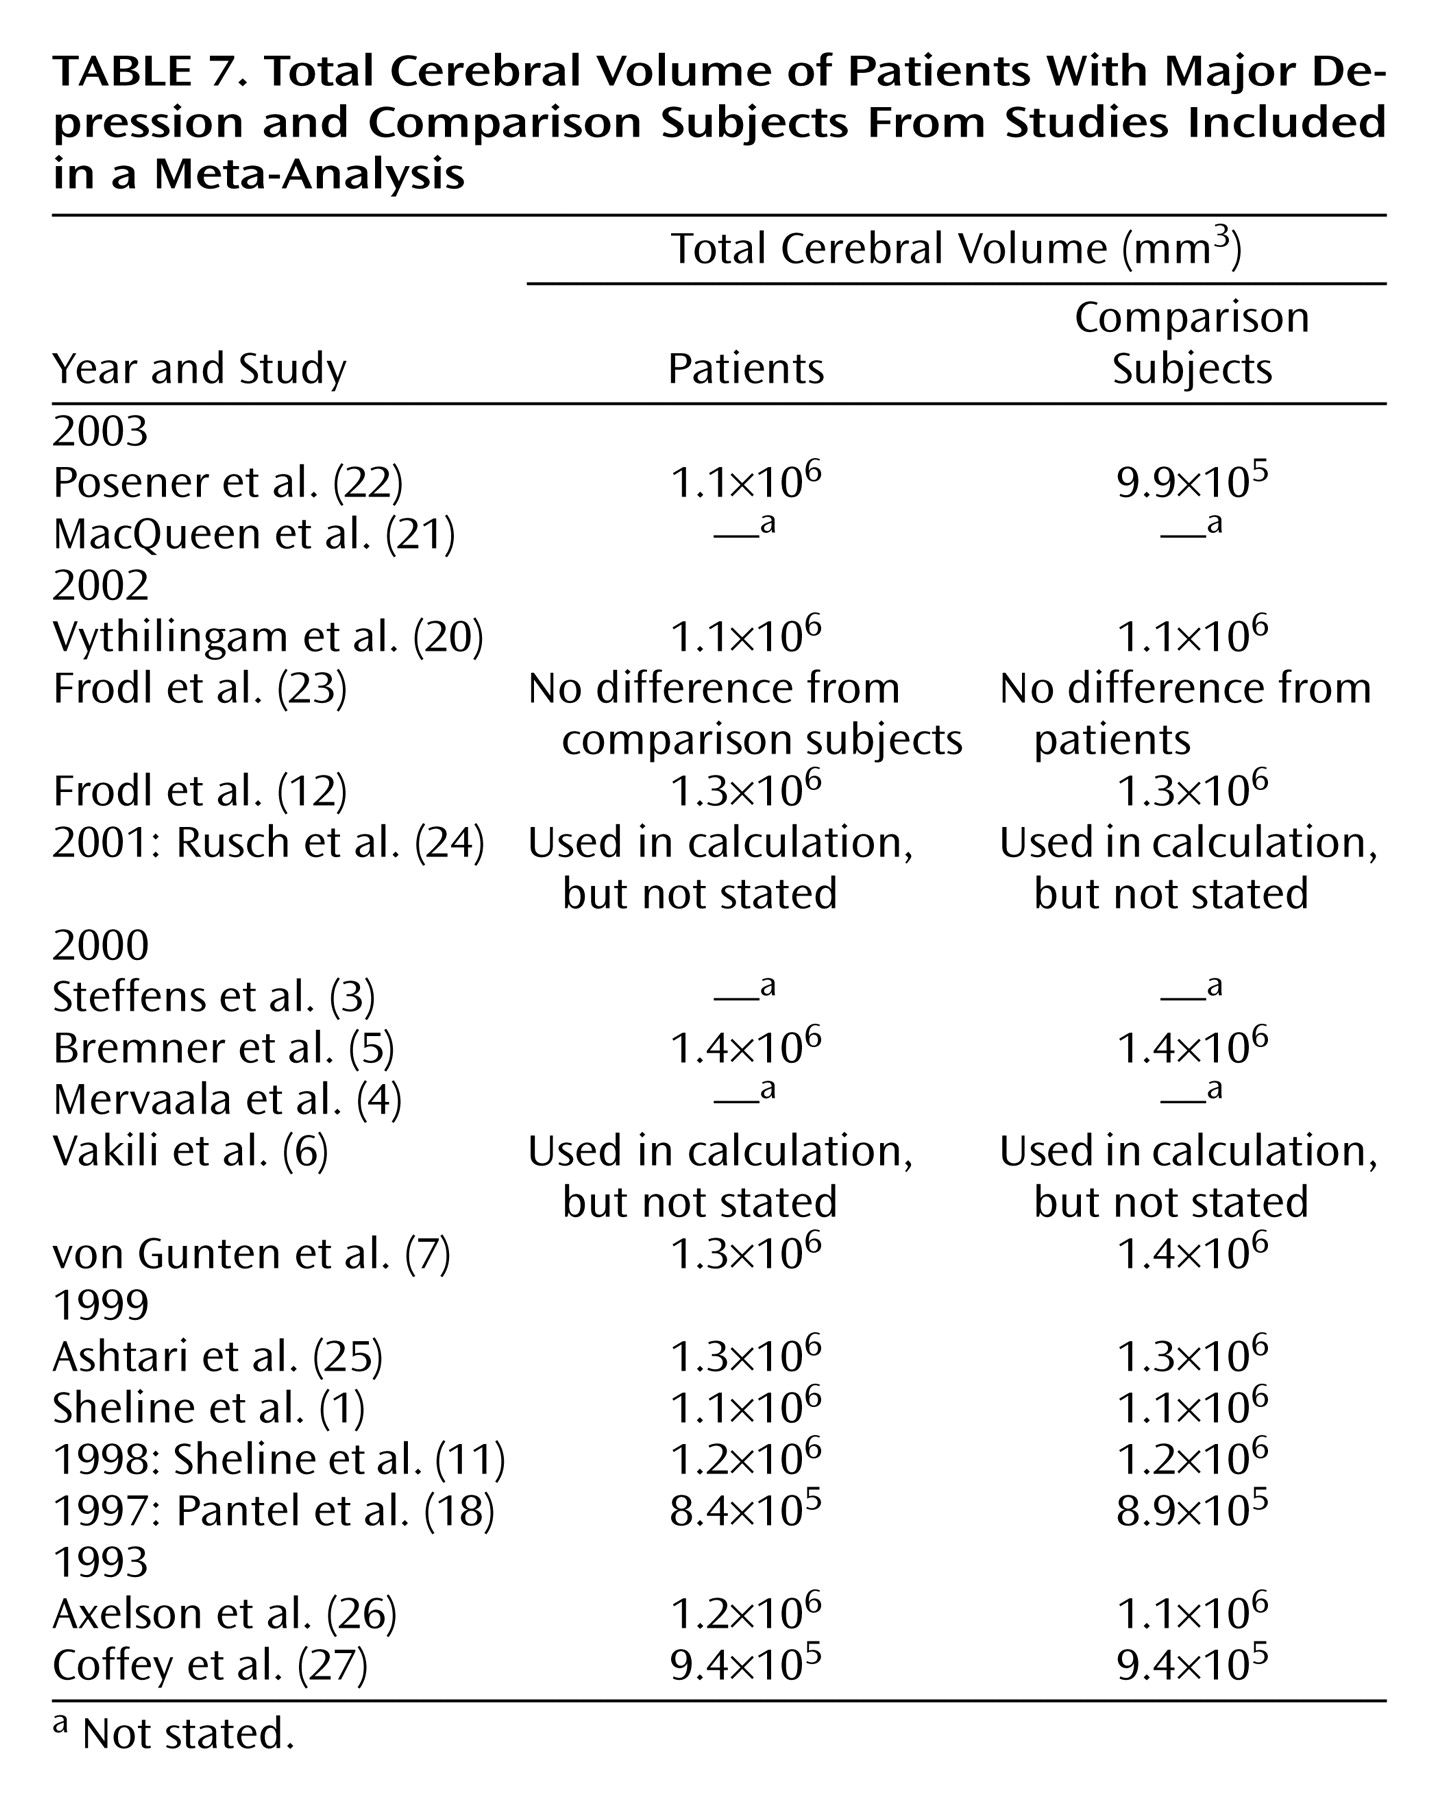
We examined whether differences in measurement of total cerebral volume (
Table 7) could account for variations in reported volumes of temporolimbic regions of interest. The anatomical definition of total cerebral volume varied between studies. Coffey and colleagues
(27) measured the volume of the cerebral hemispheres, excluding CSF-containing regions, giving a lower volume (9.4×10
5 mm
3) than those recorded in other studies. Other recorded total cerebral volume values for patients range from 1.1×10
6 mm
3 (1,
20,
22), to 1.4×10
6 mm
3 recorded by von Gunten et al.
(7), who included everything within the skull to the level below the cerebellum. The same range of values is apparent for comparison subjects, giving little difference between recorded total cerebral volume values for patients and comparison subjects. Total cerebral volume therefore added little to any explanation of the variation of the volume of the gray matter structures in question.
The 15 studies assessing hippocampal volume were analyzed in their entirety (
Table 4 and
Table 6). Significant differences remained between patients suffering from major depressive disorder and comparison subjects for volume in the left hippocampus plus combined hippocampus and amygdala (95% CI of z scores=–0.390 to –0.128) and right hippocampus plus combined hippocampus and amygdala (95% CI of z scores=–0.378 to –0.117).
Discussion
In this meta-analysis, we divided the studies into those measuring the hippocampus, those measuring the amygdala, and those measuring the combined hippocampus and amygdala. Within these groups the measured areas were more consistent, although interexperimental variation was still apparent. This within-group variation can be attributed at least partially to varying anatomical definitions of the target structures. Between groups, varying MRI protocols and heterogeneous subject groups differing in age and gender may have enhanced variation. Sheline
(10) has suggested that the lack of consensus between experimenters who found significant hippocampal atrophy in depressive patients and those who did not was at least partially due to the resolution of the MRI scans taken. Our analyses suggested that decreased slice thickness did not lead to increased sensitivity to hippocampal volumetric differences. When studies examining hippocampal volume (N=12) were divided into two groups by slice thickness, there remained significant hippocampal volume differences on both left and right sides between major depressive disorder patients and comparison subjects for the studies that used lower MRI resolution. This difference was lost on the right side in the group of studies that used higher resolution. A decreased slice thickness, therefore, does not positively influence detection of a difference between hippocampal volumes of major depressive disorder patients relative to comparison subjects. When studies assessing hippocampal volume in depressed subjects are examined in the aggregate, major depressive disorder patients have lower bilateral hippocampal volumes relative to comparison subjects. With five exceptions
(6,
7,
22,
24,
25), experimenters measuring the hippocampus separately from surrounding structures have been able to discern significantly lower hippocampal volume in depressed patients relative to comparison subjects, regardless of the MRI resolution used. The study performed by von Gunten et al.
(7) had a small study group size (N=14), with heterogeneous diagnoses of mild, moderate, and severe depression as well as bipolar disorder. The heterogeneity of this patient group may have contributed to the lack of hippocampal volumetric differences from comparison levels. Frodl et al.
(23), in a study that used first-episode patients with presumably fewer morphological consequences of long-term illness, detected a significant hippocampal deficit only in male patients relative to comparison subjects. Gender analyses done in other studies
(3,
6,
26), however, have found no significant differences. Low burden of illness may have contributed to the negative results found in studies performed by Rusch et al.
(24), Posener et al.
(22), and Vakili et al.
(6). The mean patient ages for these studies were among the lowest of any included in this analysis, and Rusch et al.
(24) included at least a portion of patients that appeared to be in a first episode of illness. Sheline et al.
(1) showed that a greater total number of past days ill was an important factor determining deficits in hippocampal volume size. This hypothesis is supported by the data from MacQueen and colleagues
(21), who demonstrated a logarithmic relationship between hippocampal volume and duration of illness. First-episode patients from this study, like those from the Rusch et al.
(24), Posener et al.
(22), and Vakili et al.
(6) studies with low mean age, showed no significant hippocampal volume differences relative to comparison subjects. The relationship among depression, abuse, and hippocampal volume has been examined only in a recent study
(20) and may play an important factor determining hippocampal atrophy. It is therefore difficult to interpret negative reports in the absence of specific information regarding the patients’ histories of past illness.
Studies have been contradictory about the relative amygdala volume in depressed patients compared with healthy subjects. A statistically significant deficit
(1,
7,
11) and no significant difference
(4) have both been reported, while studies by Bremner and colleagues
(5) (statistical significance not reported) and Frodl et al.
(12) showed higher amygdala volume in patients relative to comparison subjects. When the studies analyzing amygdala were examined in the aggregate, no significant difference in volume between patients and comparison subjects was apparent. This may be a result of a limited power provided by the six available studies and difficulty in measuring a compound structure with indistinct anatomical boundaries. Once again, patients’ past illness may be an important factor, since the patients in the Frodl et al.
(12) and Bremner et al.
(5) studies appear to be younger and perhaps have a lower past illness burden than those in studies such as that of Sheline et al.
(1).
The white matter delineation between the amygdala and the hippocampus can be difficult to detect, and therefore some studies have considered the amygdala and hippocampus together
(18,
22,
25,
27). Without exception these studies were unable to discern a statistically significant difference between the hippocampal volumes of depressed patients and comparison subjects. When these studies were included with those measuring the hippocampus alone, however, the robust significant difference detected in the latter studies was statistically retained. We suggest that the inclusion of the variable amygdala in the measurement of combined hippocampus and amygdala is a confounding variable, obscuring hippocampal volumetric differences between patients and comparison subjects. Given the contradictory results in studies examining the amygdala and the limits inherent in strictly delineating amygdala boundaries, it is perhaps not surprising that studies including the amygdala were more varied in their outcome than those of the hippocampus alone.
The lower hippocampal volumes in patients with major depressive disorder observed in imaging studies are consistent with recent postmortem studies and animal models of the pathophysiology of depression. Lower cortical volume in the subgenual prefrontal cortex
(36) and orbitofrontal cortex
(37) have been recorded in depressed patients relative to comparison subjects. Also differences in glial and neuronal cell density as well as neuronal size have been reported in the prefrontal cortex
(38) and in the anterior cingulate cortex
(39) of major depressive disorder patients relative to comparison subjects. These regions are intimately connected to the hippocampus (reviewed in reference
40), suggesting a possible deafferentation and subsequent atrophy of hippocampal neurons. Sapolsky
(41–
43) has suggested that hippocampal cell death leading to a loss of hippocampal volume might occur as a consequence of repeated stress with associated glucocorticoid excess. Structural changes to the hippocampus might be due to remodeling of key cellular elements, involving retraction of dendrites, decreased neurogenesis in the dentate gyrus, and loss of glial cells
(44–
48). Potential factors underlying this cellular remodeling include stress-induced elevated glucocorticoid levels, which are implicated in aneogenesis
(49) and induce cell cycle arrest in the peripheral cells
(50). Research has demonstrated that reduced hippocampal volume can rebound once hypercortisolemia due to Cushing’s disease is relieved
(51). Elevated glucocorticoid levels are associated with hippocampal atrophy in rats
(52,
53) and in primates
(42). Patients with major depressive disorder have demonstrated abnormalities of the hypothalamic-pituitary-adrenal (HPA) axis
(54). Among the most reproducible findings in patients with major depressive disorder is nonsuppression of the HPA axis by dexamethasone, a marker of HPA overactivation
(55). As the hippocampus is a major site in the glucocorticoid negative feedback circuit, reduction in hippocampal cell number may lead to less efficient inhibition of cells in the hypothalamus that produce corticotropin-releasing factor, resulting in increased glucocorticoids and worsening of the process (reviewed by Bremner
[56]).
Further supporting the notion that the hippocampus is important in the pathophysiology of major depressive disorder are data from neuropsychological studies. Recollection memory impairment is apparent in patients with major depressive disorder not only when they are dysthymic
(57–
59) but also in the euthymic state
(60,
61). It is reasonable, therefore, to suspect hippocampal change in depressed patients as recollection memory is critically dependent upon hippocampal integrity
(41). An emerging consensus from imaging, neuropsychological, and preclinical studies therefore supports the importance of the hippocampus in the pathophysiology of major depressive disorder. Future imaging studies may delineate the relation between illness course and other clinical variables and volume loss associated with this condition.
In summary, hippocampal volume is lower in patients with depression than in comparison subjects, detectable if the hippocampus is measured as a discrete structure in patients with longstanding illness. Slice thickness or other scan parameters do not appear to account for a substantive amount of the variance in results observed between studies. Rather variables related to the specificity of the structure studied, and perhaps clinical variables of the populations studied, account for most of the discrepancy between findings. Early childhood abuse, the incidence of which is elevated in depressed subjects, might result in the initiation of depression starting from childhood and resulting in long-term depression in young adults. Indeed, illness duration seems to be the critical factor in the detection of hippocampal volume deficits in patients suffering from depression. Whether the volumetric differences are apparent early in illness or detectable only in patients with recurrent illness is not yet well established. Although the effect of major depressive disorder on amygdala volume remains to be conclusively established, in studies to date, inclusion of the amygdala with the hippocampus appears to have decreased the likelihood of detecting volumetric changes in either structure.
