Study Selection
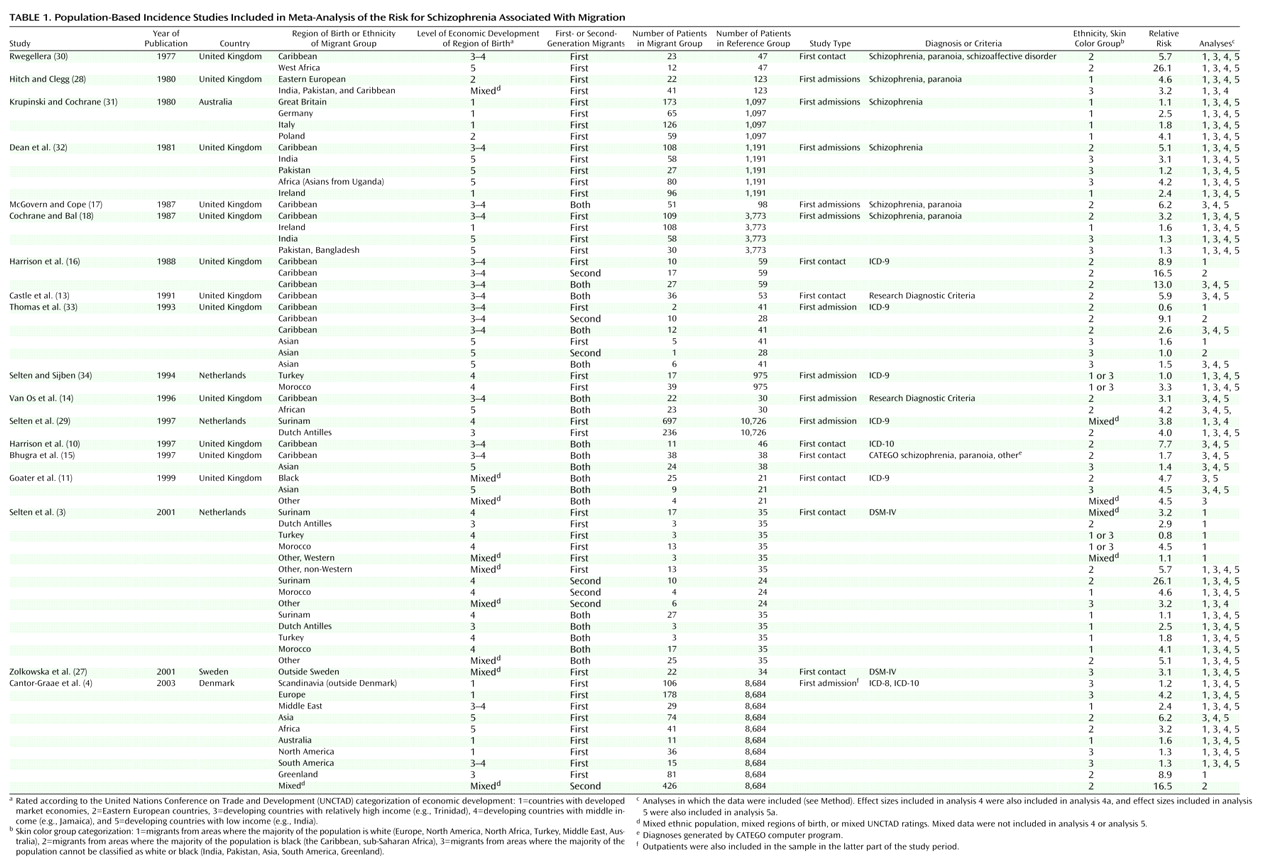
Using the key words “migration,” “ethnicity,” “psychosis,” and/or “schizophrenia,” a computerized search of MEDLINE was systematically conducted for possibly relevant publications appearing between January 1977 and April 2003. A database of all schizophrenia incidence studies published during this period was also searched (provided by Dr. John McGrath, Brisbane, Australia). Bibliographies from identified articles were cross-referenced.
To be included in the meta-analysis, studies had to fulfill the following criteria: 1) the study reported schizophrenia incidence rates for one or more migrant groups residing in a circumscribed area or provided numerators and denominators for such calculations, 2) the study included correction for age differences between the immigrant group and the reference group or provided data that made this correction possible, and 3) the study was published in an English-language, peer-reviewed scientific journal.
In most studies, the designation of migrant status was based on the country of birth of the subjects in question or their parents. Denominators for studies conducted in the United Kingdom, however, were based largely on categories derived from national censuses, with some studies using “whites”
(11,
13–15) or the “remainder of the general population” (e.g., references
10,
16) as the reference group. Thus, some members of the reference group might actually have recently migrated to the United Kingdom, and some “blacks” or members of ethnic minority populations might possibly have lived in the United Kingdom for more than two generations. This type of classification error would, however, primarily tend toward an attenuation of the relative risks currently obtained for migrants versus nonmigrants.
In selecting studies, we sometimes found that two or more articles reported epidemiological studies within the same region or time frame. When there was a complete overlap of samples, only one study was included in the analysis. The overlap of samples between the study by McGovern and Cope (Birmingham, England, 1980–1983)
(17) and that by Cochrane and Bal (England, 1981)
(18) was small, and both studies were included. Two Danish register studies
(4,
19) overlapped partly in the years studied. The study by Cantor-Graae et al.
(4) was selected because the information on ethnicity was more accurate and because that study included outpatients after 1995. The overlap between the studies by van Os et al.
(14) and Boydell et al.
(20), however, was large, and the former study was selected because it provided a better definition of ethnicity. One study conducted in Manchester, England, was excluded because no age correction could be performed
(21).
Studies that combined the results for schizophrenia with those for other psychoses (e.g., schizophrenia and paranoia or schizophrenia and paranoid psychosis) were included. When the same study reported separate results for psychoses and for schizophrenia, the results for schizophrenia were selected.
Some studies presented figures for the first generation only. Other studies reported separate relative risks for first- and second-generation migrants or combined the results for both generations into one figure. Consequently, we prepared three different data sets. The first data set concerned the effect sizes for first-generation migrants only; the second data set concerned those for second-generation migrants only. To make use of a large data set that could be regarded as an aggregate of the general migrant effect and that could yield maximal power for a series of statistical analyses, we also composed a third data set. This data set included 1) studies that did not distinguish between first- and second-generation migrants, 2) studies that made this distinction but from which one could extract figures for the two generations combined, and 3) studies that reported effect sizes for the first or the second generation only. Only one effect size for each migrant group described in the selected study was included in this third data set.
Meta-Analysis
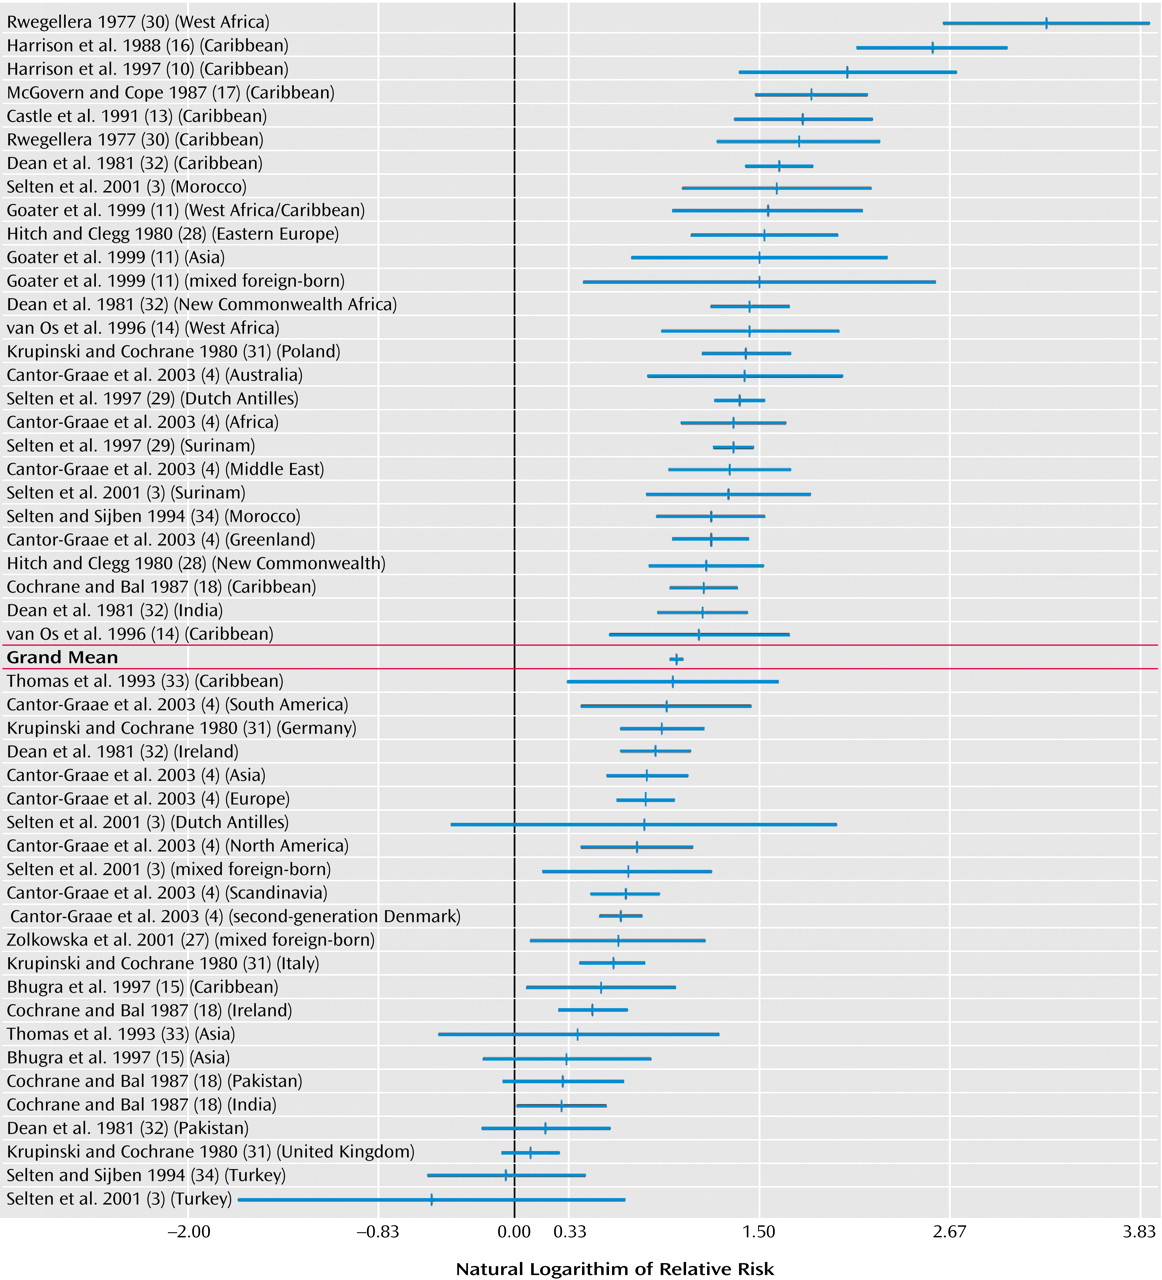
From each study, relative risks were obtained for one or more immigrant groups. Extraction of data and calculation of relative risks were performed by the two authors independently, and consensus was reached in case of discrepancies. The available data for numerators and denominators were used to calculate age- and gender-adjusted relative risks by Poisson regression analysis. When possible, separate relative risks were computed for first- and second-generation migrants and for male and female migrants.
There were large differences between studies in the presentation of details concerning numerators, denominators, and rates. In order to use the same method of variance estimation for all studies, we used the formula V=1/N
n + 1/N
m, where
Nn is the number of native cases and
Nm is the number of migrant cases (derived from the formula for the variance of odds ratios)
(22), as previously done by Aleman et al.
(23). In order to prevent studies with very large samples from dominating the analyses, the number of subjects in studies with more than 500 patients was set at 500, as suggested by Shadish and Haddock
(24). A homogeneity statistic, Q
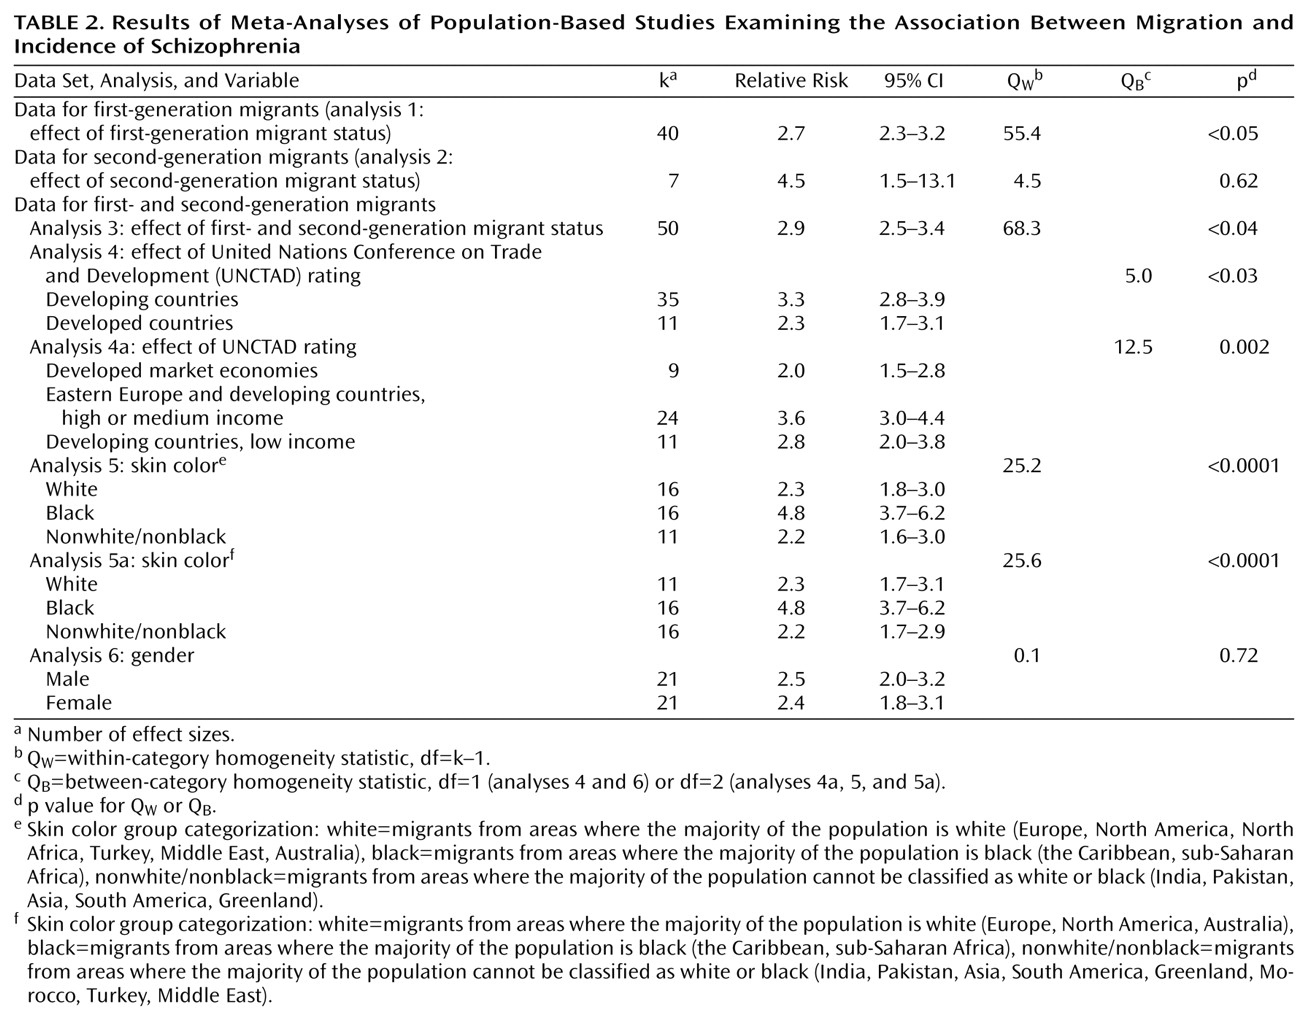
W, was calculated to examine whether the various effect sizes that are averaged into a mean value can be assumed to estimate the same population effect size. Significant values of Q
W indicate heterogeneity across studies. The Q
B statistic was used to test whether differences in effect sizes between groups (e.g., risks for male versus female migrants) were statistically significant.
Since the effect size distributions remained heterogeneous even after modeling the between-study differences, analyses were carried out within the mixed-effects model. This model assumes that the effects of between-study variables are systematic but that there is a remaining unmeasured random effect in the effect size distribution in addition to subject-level sampling error. All analyses were performed with the Meta Win 2.0 statistical package
(25).
We first analyzed the studies pertaining to first-generation migrants (data set 1, analysis 1) and second-generation migrants (data set 2, analysis 2). For the remainder of the analyses (analyses 3, 4, 4a, 5, 5a, and 6), data set 3 was used, starting with the computation of the mean relative risk for the studies in data set 3 (analysis 3).
In analyses 4 and 4a, the risks for migrants from developing countries were compared to those for migrants from developed countries. Countries were classified by using the United Nations Conference on Trade and Development (UNCTAD) classification of countries for the year 1995
(26). UNCTAD classifies countries into five categories: 1) countries with developed market economies, 2) Eastern European countries, 3) developing countries with relatively high income (e.g., Trinidad), 4) developing countries with middle income (e.g., Jamaica), and 5) developing countries with low income (e.g., India). In analysis 4, migrants from UNCTAD groups 1 and 2 were compared to migrants from developing countries as an aggregate category (UNCTAD groups 3–5). To compare extremes in developmental levels, we also examined a tripartite division: UNCTAD groups 1 and 2 versus groups 3 and 4 versus group 5 (analysis 4a). Migrants from regions (e.g., the Middle East) were classified according to the index of those countries from which most migrants originated. Effect sizes for groups with regionally mixed birthplaces, i.e., the groups studied by Zolkowska et al.
(27), the groups designated “other” in the study by Selten et al.
(3), blacks in the study by Goater et al.
(11), and second-generation migrants in the study by Cantor-Graae et al.
(4) were excluded from this analysis.
The effect of ethnicity as defined on the basis of skin color was examined in analysis 5 by comparing migrants from areas where the majority of the population is classified as white (Europe, North America, North Africa, Turkey, the Middle East, Australia; skin color group 1) to migrants from areas where the majority of the population is classified as black (the Caribbean, sub-Saharan Africa; skin color group 2) and to migrants from areas where the majority of the population cannot be classified as white or black (India, Pakistan, Asia, South America, Greenland; skin color group 3). In addition to excluding the three effect sizes for groups of mixed birthplace
(3,
4,
27), we excluded three effect sizes for migrants who constituted a mix of groups 2 and 3; i.e., the Asian and Caribbean migrants in the study by Hitch and Clegg
(28) and the Surinamese migrants in the study by Selten et al.
(3,
29). Migrants from Turkey, Morocco, and the Middle East were assigned to skin color group 1, i.e., white (analysis 5), and also, in a separate analysis, to skin color group 3 (analysis 5a). Finally, possible gender effects were examined in analysis 6.


