Design
This experiment measured aspects of sensory integration within working memory, known to be deficient among schizophrenic patients
(1). The main experiment involved a computer game requiring navigation in a virtual maze with “challenge” and “delay” rooms. Each challenge room had three doors, only one of which was the correct choice, while each delay room had a single door. The goal of the game was to reach the end of the maze as fast as possible, and the end was reached only after all the correct doors were opened.
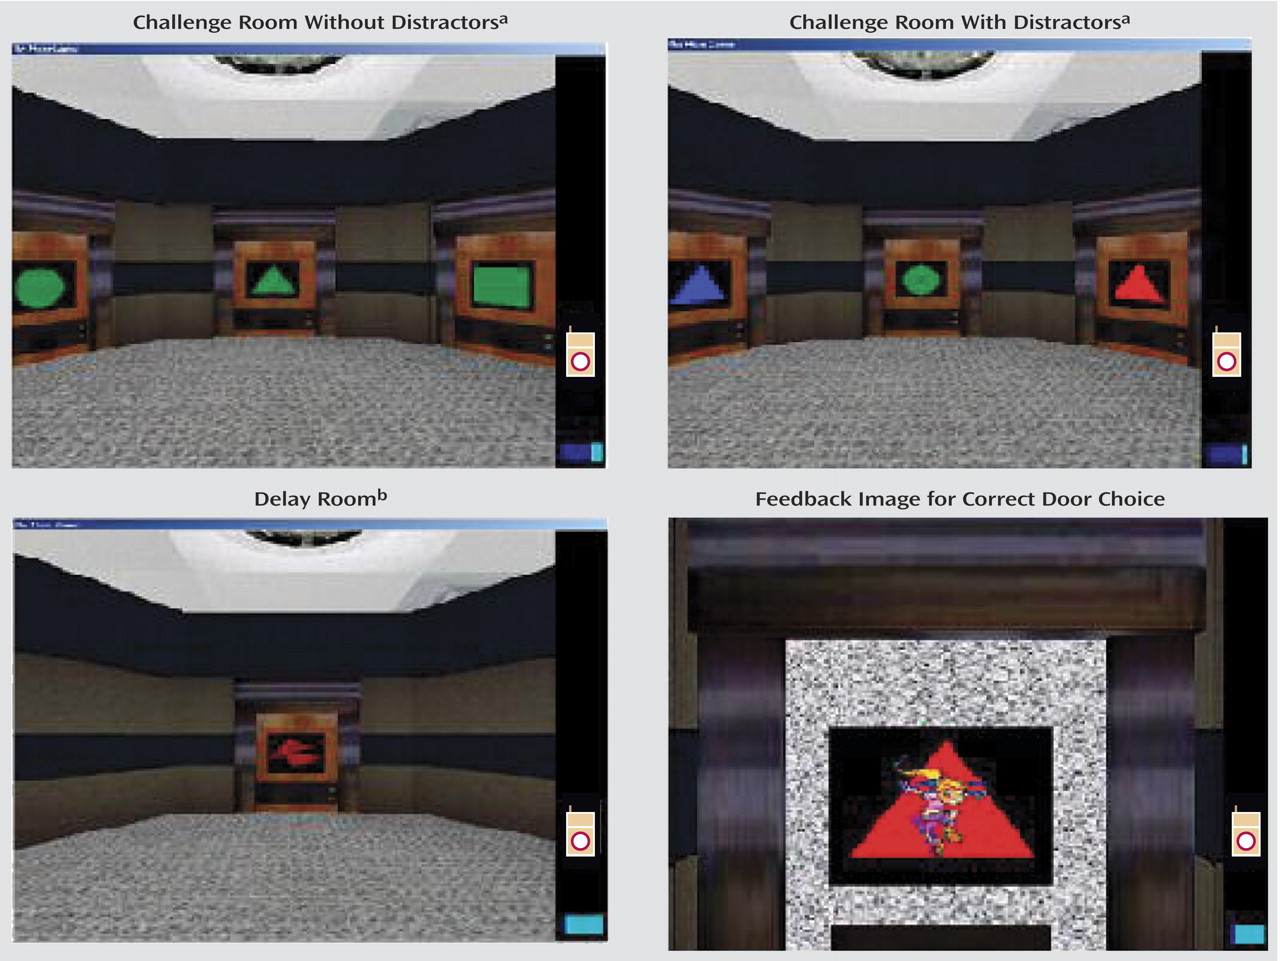
Each door in a challenge room was associated with up to three distinct features—shape (triangle, square, or circle), color (red, green, or blue), and sound (three different sounds) (
Figure 1). The sound was played when the subject examined the door. At each point in time, there was a certain door-opening rule, which determined which door should be used to exit a challenge room. For example, the rule might say that only red doors should be opened, in which case any red door, regardless of its shape or sound, could be used. There was always a single such door in each challenge room. The subject had to figure out the correct rule and open only the appropriate door (with the correct combination) in each challenge room. The rule randomly changed after 4–6 correct choices.
We created four experimental conditions by manipulating two factors: the number of features that defined the door-opening rule (one or two) and the presence or absence of a distractor feature on the doors (a feature that was not used in the rule) (see top two images in
Figure 1). The rule changed over time as indicated by a visual cue. When the correct door was chosen, the subject received a reward (cigarette or chocolate icon) and got encouragement (dancing figure with clapping hands) (lower right image in
Figure 1).
Between challenge rooms, the subject passed through a few delay rooms, each of which had only one door. The door in a delay room was also associated with a colored shape and sound, consistently different from those used on doors in challenge rooms (lower left image in
Figure 1). The delay rooms masked the target stimulus and imposed an active load on working memory, as the subjects needed to remember the correct rule during navigation. We manipulated the number of delay rooms to achieve a constant 20-second delay between successive challenge rooms.
The maze design was inspired by the Wisconsin Card Sorting Test
(2), in which the subject needs to sort a deck of cards into four piles. At any moment the sorting should be done according to one feature (out of three), which changes after 10 consecutive correct placements. In a similar manner, each room in our maze had three doors characterized by two visual features and one auditory feature (instead of three visual features in the Wisconsin Card Sorting Test). While in the Wisconsin Card Sorting Test only one out of the three features displayed is important at any moment, we controlled both the number of features that defined the door-opening rule (one or two) and the number of features displayed (one, two, or three). There were two additional differences: 1) how the rule was defined—in the maze, the subjects needed to remember feature values (e.g., category values such as red rectangle), while in the Wisconsin Card Sorting Test the task requires the subject to remember a category, and 2) explanation—our subjects received detailed explanations of the task, followed by a training session, while no explanation is offered in the standard Wisconsin Card Sorting Test.
Method
The participants were 39 schizophrenic patients and 21 healthy comparison subjects matched by gender (male), age, and education level. The subjects’ mean age was 32.3 years (SD=7.9), and the mean number of years of education was 10.6 (SD=2.6). The patients were diagnosed according to DSM-IV criteria and were rated for symptom severity with the Positive and Negative Syndrome Scale (PANSS)
(3) during an interview by a clinical psychiatrist (A.P.). Schizophrenic patients with a history of neurological disorders, comorbidity, or drug abuse were excluded from the study. The patients were medicated with therapeutic doses of risperidone and olanzapine. Five patients also received long-acting medications (three patients received haloperidol decanoate, and two patients received long-acting fluphenazine). In all, the patients received a mean daily dose equivalent to 414 mg of chlorpromazine. All subjects volunteered and received payment. After complete description of the study to the subjects, written informed consent was obtained. The study was approved by the internal review board of Sha’ar Menashe Mental Health Center and the Israeli Ministry of Health, in accordance with the Helsinki Declaration.
The experiment included a training phase intended to bring all subjects up to their best level of performance, followed by the actual game. Training consisted of three stages. First, the subjects learned how to open correct doors without movement; during this stage the subjects experienced all types of door-opening rules. Second, the subjects learned how to navigate in the maze at the desired speed. Finally, they practiced in a game-like session, with emphasis on achieving the fewest errors (rather than speed). During training the experimenter (A.S.) intervened when three or more consecutive errors occurred, in which case the subject was reminded of the goals of the task, was encouraged to verbalize his strategy, and received compliments on correct choices.
The duration of the sessions varied among subjects, since a session ended only after a fixed number of correct doors were chosen. Upon any incorrect door choice, the subject was presented with another challenge room with the same set of doors, shifted in position. Thus, the session duration was positively correlated with the number of errors. In general, it took the patients roughly twice as long to complete the training as the comparison subjects took (58.6 and 28.6 minutes, respectively), while the durations of the test sessions were more similar (31.7 and 26.4 minutes, respectively). This difference was reflected in the set of measurements defining a subject’s profile.
A sense of reality was obtained with three-dimensional glasses, a head tracker, and a joystick. The subjects used the joystick to navigate and to open doors. The navigation button enabled movement in four directions: forward, backward, left, and right. A change in the direction of movement could also be made by turning the head.
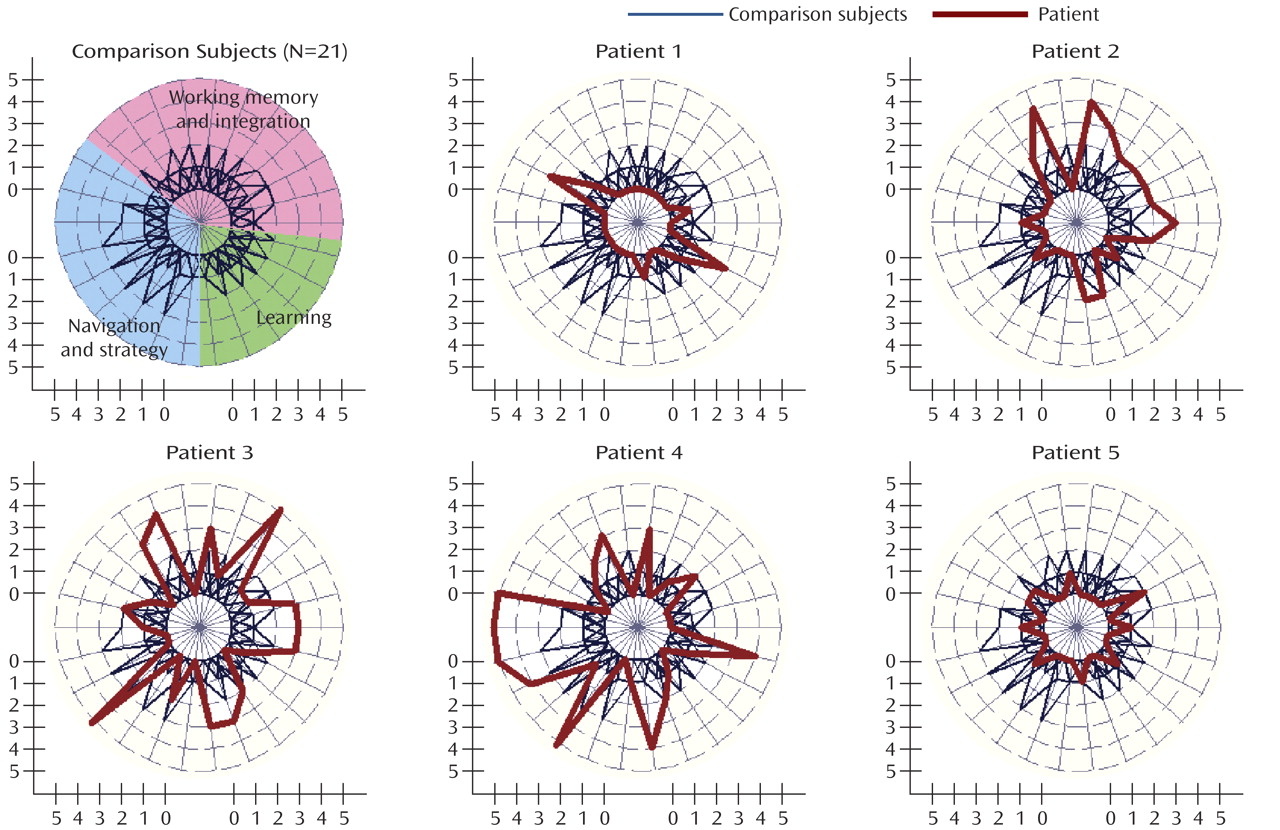
We collected 26 measurements for each subject based on a variety of continuous physical measures. These included error scores and response time, the position and direction of gaze at any time, and the rate of improvement with time. The 26 measurements defined the subject’s performance profile and can be divided into three groups: working memory and integration, navigation and strategy, and learning.
Measurements
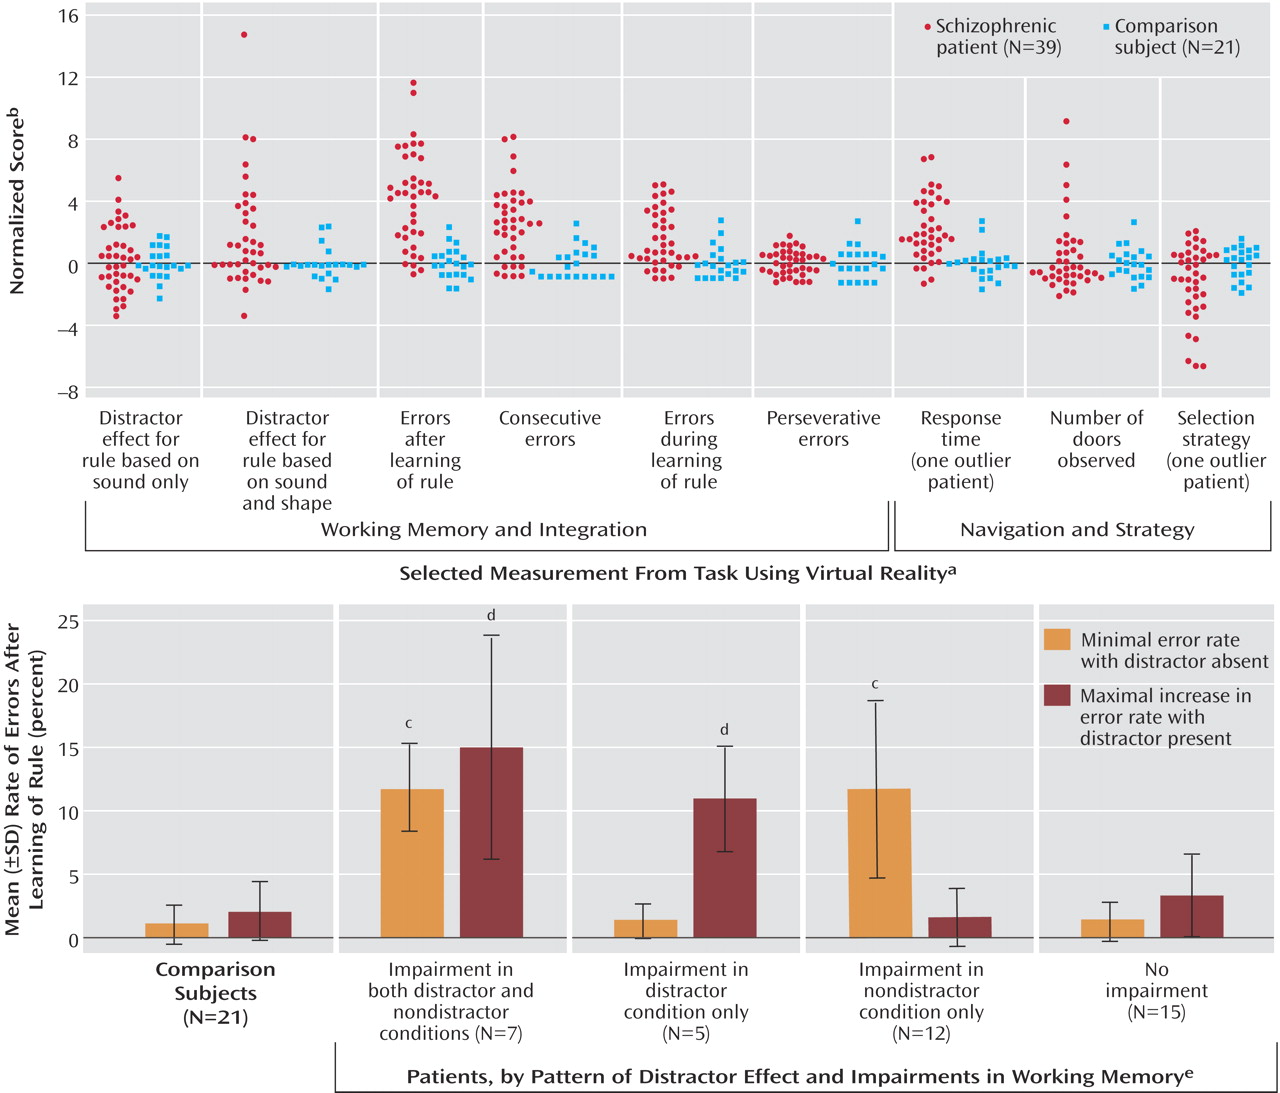
The variables reflecting working memory and integration included various error scores, a perseveration measure, and the effect of distractors. In calculating error scores we differentiated 1) errors made while the subject was learning the rule (after the rule changed), 2) errors made during use of the rule, and 3) the number of consecutive errors. Perseveration errors occurred in all of these error categories and included any repeated selection of a previous incorrect choice and any erroneous choice that was consistent with a previous door-opening rule that had already changed. Perseveration was measured as the ratio between the number of perseveration errors and the total number of errors. The distractor effect was calculated as the error rate when the distractor was present minus the error rate when the distractor was absent.
The measurements of navigation and strategy included response time, navigation profile, and strategy. The navigation profile included a measure combining navigation speed with the number of collisions with walls and a histogram of the subject’s movements (forward, backward, or rotation). Decision strategy was measured by the number of doors inspected in each room and the time spent looking at each door. To assess the subject’s selection strategy, we compared the histogram of the locations of all selected doors with the histogram of the locations of correct doors.
The measurements of learning included the rate of improvement over time in the variables reflecting working memory and integration, in response time, and in navigation speed.
All the data were normalized so that within the comparison group the values for each variable were distributed with a mean value of 0 and a standard deviation of 1. A subject was noted to differ from the expected (normal) value for a given variable if his normalized absolute value exceeded 2.
Analysis
Classification
We designed a classification routine based on the performance profiles. First, we estimated the distribution of performance profiles with the comparison group only. For simplicity, we made the false assumptions that the variables were independent and that each variable had normally distributed values. We then estimated the probability of each subject’s performance profile under the estimated distribution. Finally, we fixed a threshold to best discriminate between the comparison subjects and the patients in a leave-one-out paradigm. Specifically, we fixed a probability value that best separated the comparison and patient groups, using 38 out of the 39 patients; we then checked the prediction regarding the remaining patient. The sensitivity of this procedure was 0.85, with 33 out of 39 patients being predicted correctly. (Canonical variate analysis correctly classified 31 patients, for a sensitivity of 0.79. Multivariate analysis of variance indicated that the comparison and patient groups differed significantly with p=0.00002.)
In the preceding procedure we used all 26 measurements defining the performance profiles. However, with only 21 data points there is a high risk of overfitting the distribution of the comparison group. We therefore looked for a minimal subset of features that would give the same classification accuracy. We applied the same procedure while using all subsets of two to six features. The minimal subset of features that achieved the same accuracy contained four measures: distractor effect (sound and shape rule), error rate when the rule was used during training, consecutive error rate, and response time. This set of four features achieved a sensitivity similar to that for the leave-one-out classification paradigm—0.85.
Finally, we tested the estimation procedure using a similar leave-one-out approach. Specifically, we estimated the distribution of the comparison group based on 20 of the 21 subjects, fixed the threshold on the basis of the same 20 comparison subjects and all of the patients, and checked the prediction regarding the missing comparison subject. As expected from the preceding counting argument, the reduced set of four features was more robust than the full set of 26 measurements, with 100% correct classification of the comparison group (specificity, 1.00). With 26 measurements, only 86% (18 out of 21) of the comparison subjects were classified correctly.
Correlations with symptoms
To study the correlation between our measurements and the subjects’ PANSS scores, we assigned “absent” to the comparison subjects on all symptoms and normalized the PANSS scores to a 0–5 range: 0=absent or minimal, 1=mild, 2=moderate, 3 or 4=severe, 5=extreme. The analysis revealed a number of significant correlations (Spearman’s r≥0.4, t≥3.32, df=58, p<0.01): 1) the error rate during use of the rule (after the rule was learned) was significantly correlated with five positive and four negative symptoms, 2) the consecutive error rate was correlated with six negative symptoms, 3) the distractor effect for the sound-based door-opening rule was correlated with six positive symptoms, while the distractor effect for the sound-and-shape rule was correlated with only one positive symptom (conceptual disorganization), 4) longer response time was correlated with six negative symptoms, and 5) poor selection strategy was correlated with six positive symptoms. None of the variables showed any significant correlation with age. When using canonical correlation analysis to measure correlations between mixtures of variables, we found two significant correlations including the same group of highly correlated measures and symptoms.
Discussion
Perseveration is a common indicator of schizophrenia
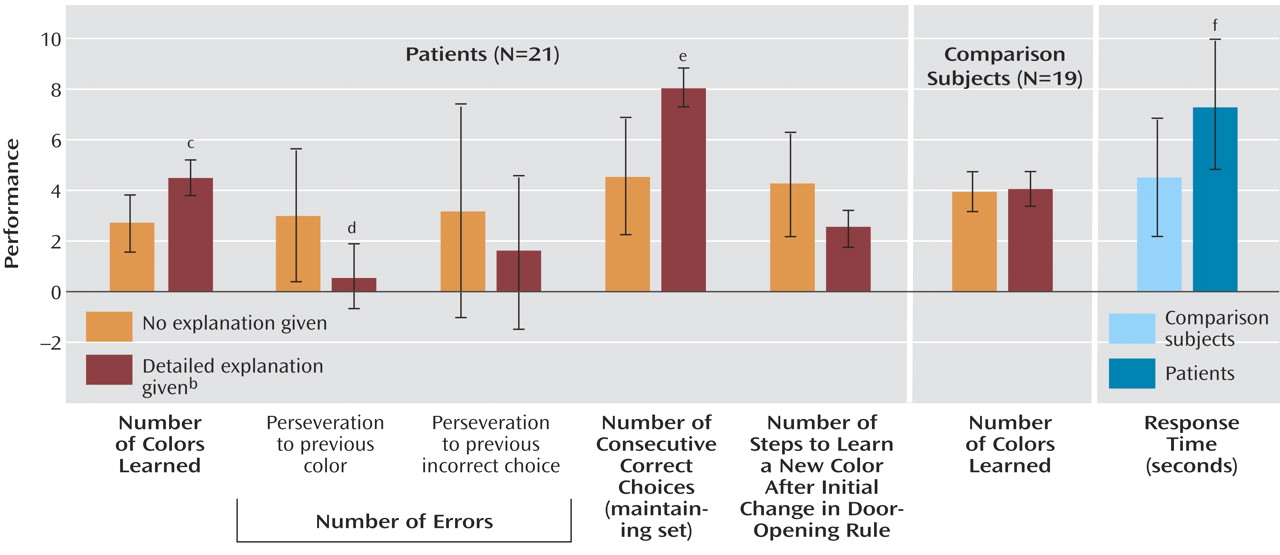
(4). However, our approach to measuring perseveration differed in two ways from the classical procedure such as used in the Wisconsin Card Sorting Test. First, we measured perseveration by a ratio—the number of perseverative errors divided by the total number of errors. This is because when the number of total errors is high, the number of perseverative errors is expected to be high as well, irrespective of the source of error. Indeed, the numbers of total and perseverative errors showed a high correlation (r
s=0.87). Second, in our experiment the subjects received a detailed explanation of the task, in addition to extensive training. This difference might explain the discrepancy between our results and those in the relevant literature. To test this hypothesis, we designed an additional experiment, described in the next section.
We also noted an interesting dissociation between the patients’ ability to learn a new rule and their ability to recover from a mistake. While 23 patients showed high rates of consecutive errors, only 15 patients showed high error rates when they were learning a new rule.


