A genome scan using 297 families with a proband who had recurrent early-onset major depressive disorder (defined as onset before age 31 for the probands and age 41 for affected relatives) observed significant evidence for linkage on chromosome 15q25.3-q26.2 (lod [logarithm of the odds ratio for linkage] score=3.73)
(4) . The most significant scores were observed for the markers D15S652 and GATA128A02. Fine mapping in that region using single nucleotide polymorphisms (SNPs) provided a more significant result with a z likelihood ratio score of 4.69 (equivalent Kong-Cox lod score=4.78) at ∼92 Mb on the physical map (University of California, Santa Cruz [UCSC] Genome Browser, build 34)
(7) .
An independent genome scan of 497 sib pairs with recurrent depression found a modest signal for linkage at the same position of chromosome 15q, with the most significant marker (D15S1047) located approximately 11 Mb proximal to D15S652
(8) . Another genome scan, using 87 pedigrees from Utah with recurrent early-onset depression and anxiety disorders, found suggestive evidence for linkage to 15q in this same region
(6) . Sex-specific analyses provided stronger evidence in favor of linkage in this region in males (lod score=2.88) for the phenotypes depression or anxiety for the marker D15S1515 on 15q26.2.
There are a number of neuron-related genes located in 15q25.3-q26.2 identified in the linkage studies of this region, including neurotrophic tyrosine kinase receptor 3 ( NTRK3 ), neugrin, neurite outgrowth associated ( NGRN ), transducer of regulated cAMP response element-binding protein 3 ( TORC3 ), synaptic vesicle glycoprotein 2B ( SV2B ), and repulsive guidance molecule member A ( RGMA ). Key among these genes is NTRK3 . NTRK3 is a member of the TRK family of tyrosine protein kinase genes, which includes trkA ( NTRK1 ) and trkB ( NTRK2 ). The protein product of the NTRK3 gene, trkC, is expressed preferentially in the brain, with transcripts in the hippocampus, cerebral cortex, prefrontal cortex, cingulate cortex, and the granular layer of the cerebellum (http://www.brain-map.org/welcome.do; http://symatlas.gnf.org/SymAtlas/). The neurotrophin family consists of nerve growth factor (NGF), brain-derived neurotrophic factor (BDNF), neurotrophin-4/5 and neurotrophin-3. TrkC is the receptor for neurotrophin-3 (NTF3) but does not bind NGF or BDNF.
Specifically supporting neuronal plasticity as a mechanism in the genetic susceptibility to mood disorders has been the finding of association of BDNF with mood disorders in several samples
(11 –
14) . More pertinent to the study of childhood-onset mood disorders is our previous finding for association of BDNF in a case-control sample of probands with mood disorders that began before the age of 14.9 years
(11) and evidence for association of childhood-onset mood disorders in a sample of families from Hungary (
12 ; we used the same sample in this study).
Given our previous data indicating BDNF as a susceptibility gene in this sample and given this gene’s location in the chromosome 15q region linked to early-onset depression, in this study we investigated the NTRK3 gene as a susceptibility gene in childhood-onset mood disorders.
Results
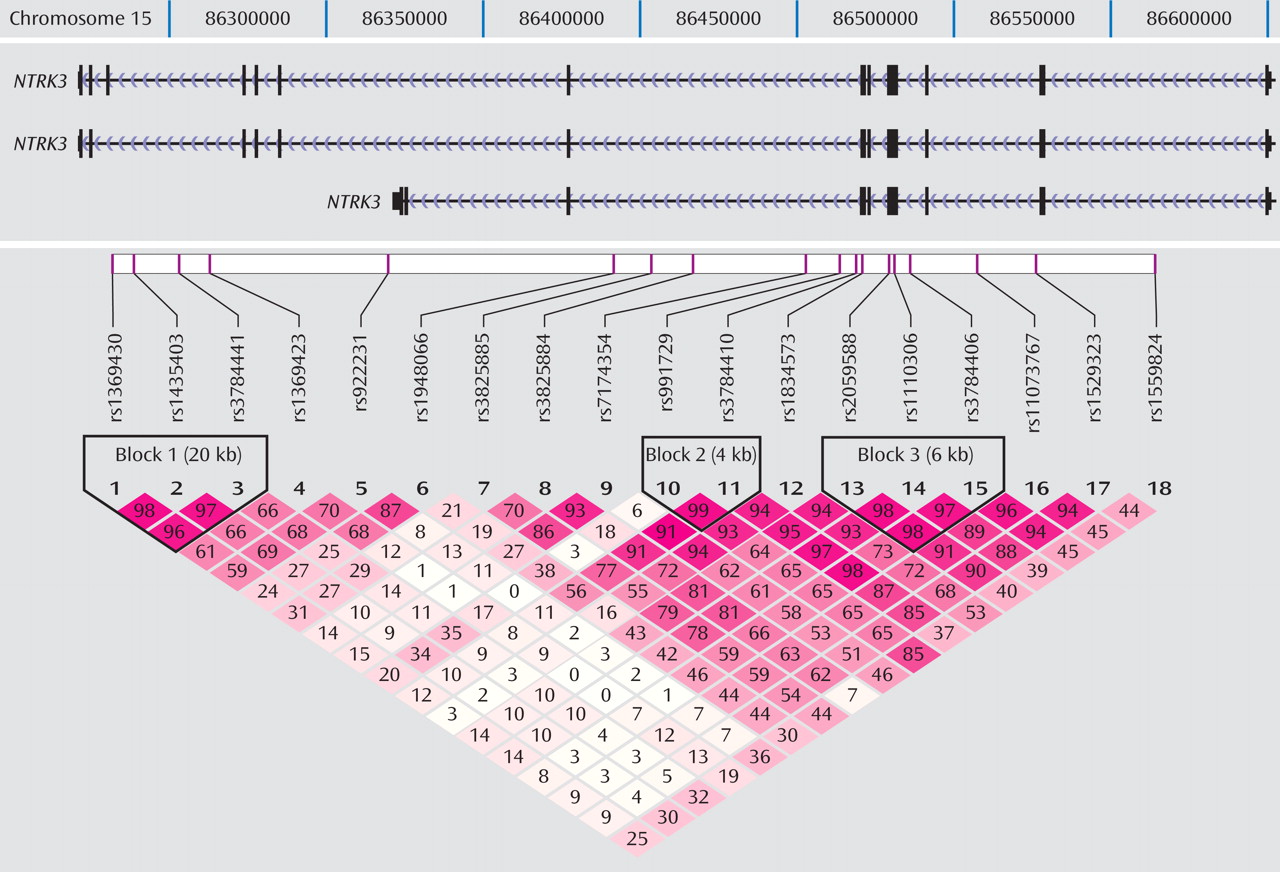
Figure 1 shows the location of the 18 markers we genotyped across the
NTRK3 gene in relation to the exon-intron structure and the degree of LD between markers (D′) of the gene. Note that because of the scale of
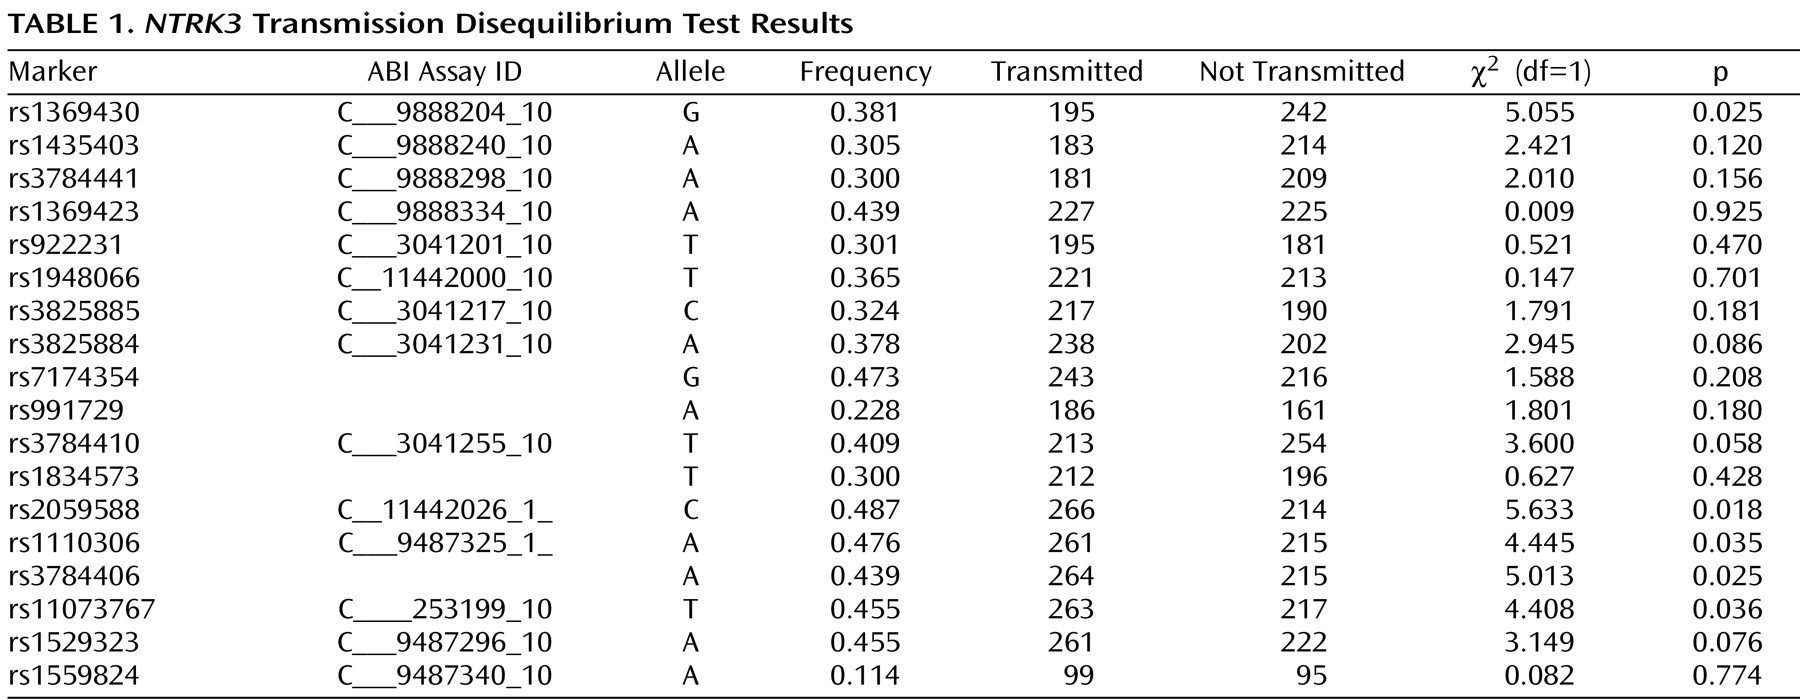
Figure 1, exons that are separated by small introns are not distinguishable from each other (see http://genome.ucsc.edu/cgi-bin/hgGateway). Of the 18 markers genotyped for the final analyses, five provided evidence of association using the transmission disequilibrium test (
Table 1 ). We note that the exon structure of this gene is complex with alternatively spliced exons indicated in the UCSC Genome Browser (http://genome.ucsc.edu/cgi-bin/hgGateway). Additional exons may still be identified. Our current exon prediction is based on exon nomenclature on the UCSC web site (March 2006, build 36.1). Four of the five positive markers were located in introns 4 through 12, and the fifth was located in intron 16. The markers across introns 4 through 12 were in a region of high LD and were highly correlated, showing a similar transmission pattern. The most significant marker was rs2059588, with a p value of 0.018. This value did not maintain global significance after permutation testing (p=0.2178, SE=0.01305). We screened exons 5 through 12 in the area spanning the region of four of the positive markers using denaturing high-performance liquid chromatography in DNA from 48 of the probands to identify DNA changes with potential to change the coding sequence or the predicted splice sites of the gene. We did not identify any DNA variation in these exons.
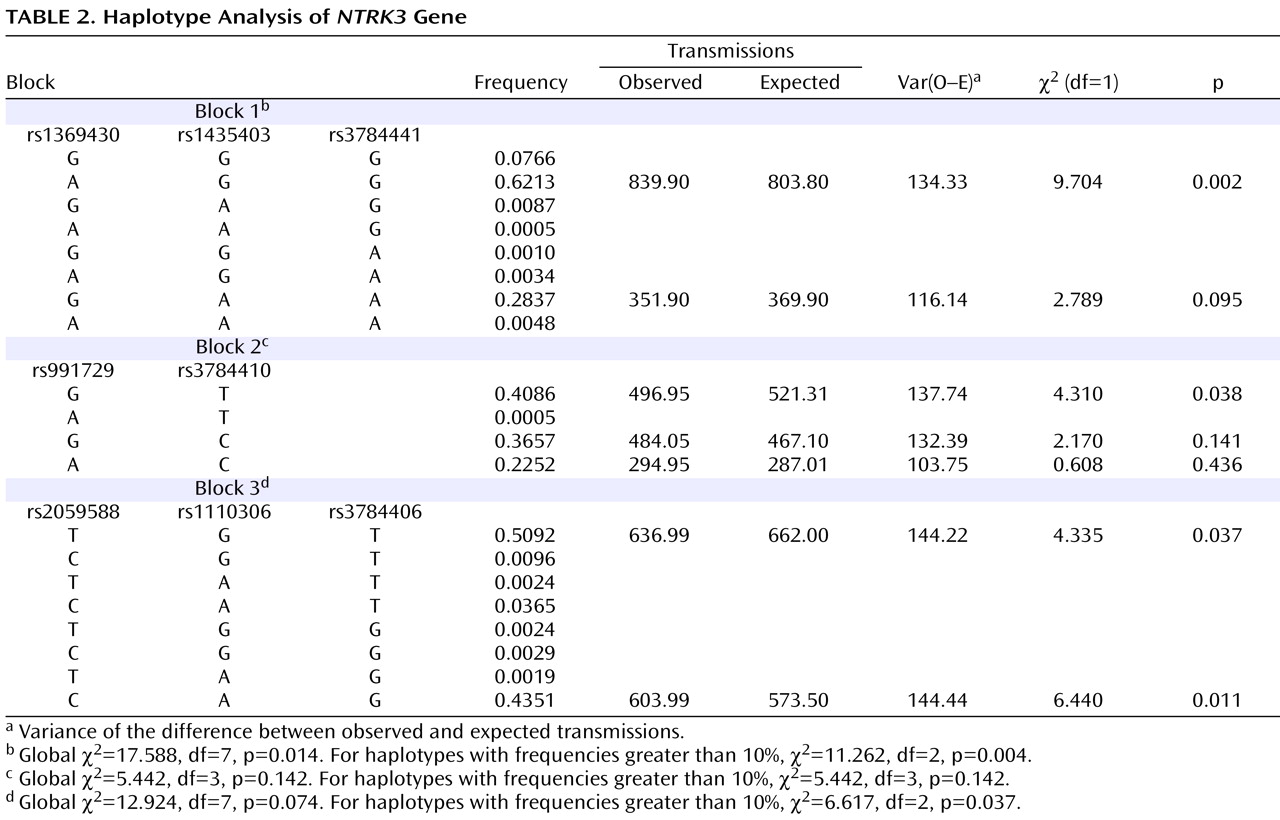
Haplotypes were analyzed using the three blocks of strong LD across the gene (LD blocks shown in
Figure 1, results shown in
Table 2 ). Blocks were defined by the algorithm set out by Gabriel and colleagues
(23) . Haplotype blocks can be defined using a number of different methods, including LD based, diversity based, and recombination. Blocks defined by LD and recombination-based methods generally provide similar blocks. We also compared the blocks defined by the Gabriel et al. algorithm with the blocks defined using the solid spine of LD and the four-gamete rule algorithms in Haploview 3.2 for comparison. All three methods defined the first block as containing the three markers (rs1369430, rs1435403, and rs3784441) located in the 3′ end of the gene. Block 3 was defined by the same markers for both the Gabriel et al. and the four-gamete rule algorithms with an additional two markers (rs11073767 and rs1529323) included in the block defined by the solid spine of LD algorithm.
The results were significant for two of the three blocks analyzed. For the first block, composed of markers rs1369430, rs1435403, and rs3784441, the common haplotype (frequency 0.62) was overtransmitted to affected offspring (χ
2 =9.704, df=1, p=0.002), with a global χ
2 value of 11.262 (df=2, p=0.004) for the two haplotypes with frequency greater than 10% and the pooled analyses of the haplotypes with frequency less than 10% (
Table 2 ). For the third block, composed of markers rs2059588, rs1110306, and rs3784406, two haplotypes with frequency greater than 10% were biased in transmission (one overtransmitted and one undertransmitted), with a global χ
2 value of 6.617 (df=2, p=0.037).
Discussion
Previous genome scans for mood disorders have implicated the 15q region
(4,
6 –
8,
24) . Located in the interval between the most significant single markers and flagged in the 15q region from the Holmans et al.
(4) and McGuffin et al.
(8) genome scans is the
NTRK3 gene, which is located 7 Mb distal to D15S1047
(8) and 5 Mb proximal to D15S652
(4) . This gene is also located 9.5 Mb proximal to the most significant marker on 15q from the Camp et al. study
(6) .
The results reported here, particularly the significant results from the haplotype analyses, indicate that genetic variation in the
NTRK3 gene could contribute to the linkage signals in the 15q region reported in genome scans for mood disorders. The significance of the most positive single marker results, after correcting for multiple tests, is quite modest, particularly given the number of informative transmissions provided by this large sample of families. This may indicate that the gene is not a major contributor to the overall risk for depression as previously indicated from linkage studies of this region
(25) . However, as we have not identified the functional DNA change contributing to depression, the amount of LD between the chosen markers and the functional DNA changes will influence the power of the analyses. When we started our study of this gene, 10 tag SNPs were identified based on HapMap, release 19/phase II (October 2005). The current version of HapMap (release 22/phase II, April 2007) indicates that 57 markers would be required to tag the major haplotypes with r
2 >0.80 and minor allele frequency >0.20. As additional genetic variation is identified for this gene, additional markers may be required. Thus, the full complexity of LD is difficult to capture at this point. Markers with weak LD to the functional DNA variants will underestimate the contribution of a gene to the phenotype, and this will undoubtedly influence the power to fully detect the contribution of this gene to mood disorders. Furthermore, if there are multiple DNA changes contributing to the phenotype on different haplotypes, association analyses will not provide evidence for a strong relationship. Thus, until the functional DNA changes are identified, the risk conferred by this gene cannot be fully estimated.
Independent support for this gene as a contributor to early-onset depression was presented at the 2007 World Congress on Psychiatric Genetics
(26) . Interestingly, the associated markers in that study were located in the same region where we identify association in this sample. This independent support for association is encouraging, and functional studies are now warranted. Given the large size (∼400 kb) and complex LD structure of
NTRK3, identifying the contributing DNA changes is likely to be challenging. Our association results point to a large 28-kb region spanning exons 5–12 as well as a 3′ region. We have ruled out coding region changes in the exons we have screened, suggesting the possibility that changes in a gene regulatory element may contribute to risk. Genetic variation that results in changes to gene expression, rather than variation in the coding regions, is predicted to play a major role in complex traits
(27 –
29) . The tasks of identifying the regulatory elements and determining the contribution of DNA variation within the region will not be trivial. Regulatory elements can be located anywhere within a gene as well as in the area surrounding the gene, even megabases away
(30) . Transcription factor binding sites are small (∼5–8 bp), and degenerate, which makes it difficult to use bioinformatic tools alone to predict regulatory elements
(31) . Redundancy in the sequence of the transcription binding sites makes it difficult to predict the impact of a single nucleotide change, and because of the modularity of the binding sites, a combination of changes may be required to result in a change of function
(31) . Recently the position of modified histones (e.g., methylation and acetylation) has been used to map regulatory elements, and we plan to use chromatin immunoprecipitation to modified histones and microarrays (ChIP-chip) to map regulatory regions across the gene (32; Z. Xu et al., unpublished 2008 data; J.M. Couto et al., unpublished 2008 data).
Twin and family studies indicate that mood disorders are complex, with multiple genes involved, and any one gene will be unlikely to have a large contribution to risk. Association studies now point to a few candidate genes with support from multiple studies
(33), but currently it is unknown how these genes work, either independently or in concert, to contribute to risk. On smaller subsets of the sample of families used here, we have previously identified association to the genes encoding BDNF
(12), arginine vasopressin (AVP) (E.L. Dempster et al., unpublished 2008 data), and the receptor for arginine vasopressin 1B
(34) .
Several lines of evidence suggest the possibility of interaction of BDNF and the hypothalamic-pituitary-adrenal (HPA) axis in risk for mood disorders, including the observation that glucocorticoids down-regulate the expression of BDNF
(35) . BDNF expression appears to co-localize with AVP and corticotropin-releasing hormone (CRH) in the hypothalamic paraventricular nucleus
(36,
37) . Studies show that immobilization stress in rats induces an increase in BDNF expression that precedes the increase of both CRH and AVP in the hypothalamic paraventricular nucleus
(37), and chronic exogenous administration of BDNF into the brains of rats was found to mediate changes in the HPA axis
(38) . The relationship of
NTRK3 to the HPA axis, on the other hand, is not clear. One study indicated that
NTRK3 mRNA is not regulated by corticosterone in the rat hippocampus
(39), whereas a later study indicated that early postnatal corticosterone regulates neurotrophins including
NTRK3 in the hippocampus
(40) . Thus, at present, an integrated model to how these genes contribute to risk is not possible. The association findings reported here for
NTRK3 and the identification of functional variants will likely spark more focused functional studies on the interrelationship of these genes.


