Startle EMG.
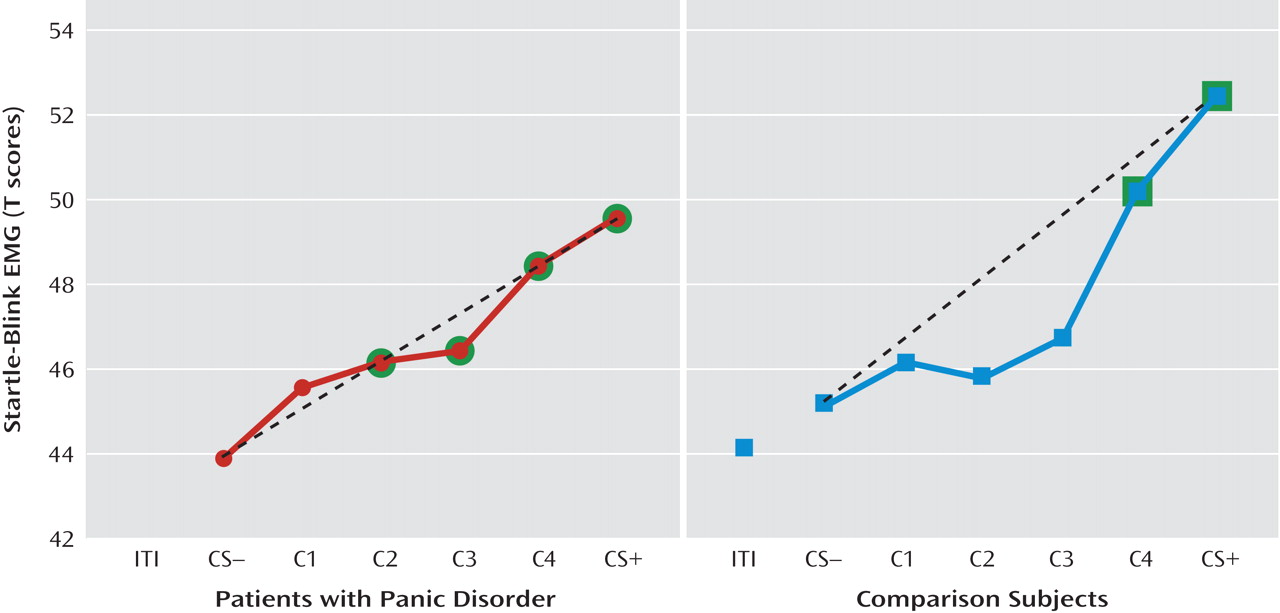
Robust enhancement of startle during conditioned danger versus conditioned safety cues persisted during generalization for both patients and the comparison group (p values <0.0001, d values >1.13) and no stimulus type-by-group interaction was observed. Additionally, generalization of fear conditioning was evidenced by main effects of stimulus type in both patients (F=5.87, df=5, 14, p=0.004; d=0.55) and comparison subjects (F=8.16, df=5, 14, p=0.001; d=0.64), which were driven by downward gradients in startle magnitude as the presented stimulus differentiated from the conditioned danger cue (
Figure 2). The pattern of this downward gradient differed across groups, as reflected by a significant stimulus type-by-group interaction (F=2.54, df=5, 32, p<0.05; d=0.51) that was attributable to between-group differences in the quadratic component of their respective slopes (stimulus type-by-group quadratic trend: F=4.94, df=1, 36, p=0.03; d=0.71). Follow-up tests on the stimulus type-by-group quadratic interaction were assessed using a Hochberg-adjusted p value of 0.025 and revealed a significant quadratic component in the generalization gradient of comparison subjects (F=13.95, df=1, 18, p=0.002; d=0.82) but not panic patients.
Figure 2 illustrates this group difference in quadratic components by displaying generalization gradients across groups separately. The dotted lines denote hypothetical linear decreases in startle potentiation from conditioned danger to conditioned safety cues, with which to visualize the presence and absence of a quadratic departure from linearity among comparison subjects and patients, respectively. Comparison subjects displayed a marked deviation from linearity, characterized by a steep curvilinear (quadratic) decline in conditioned fear as the presented stimulus differentiates from the conditioned danger cue. By contrast, the absence of a quadratic function in panic patients is evidenced by little deviation from linearity, indicating a more gradual decline in conditioned fear as stimuli move down the continuum of similarity. This less steep decline among patients demonstrates stronger generalization of fear from the learned danger cue to resembling stimuli as a conditioning marker of panic disorder.
To identify the point on the continuum of similarity at which startle potentiation ceased to generalize for patients and comparison subjects, planned comparisons were conducted whereby the conditioned safety cue was the reference condition compared against the conditioned danger cue as well as intermediary classes of generalization stimuli (classes 1–4). Hochberg's adjustment for multiple comparisons was applied to each of these five contrasts in patients and comparison subjects separately. Results in patients (criterion p=0.02) indicate startle potentiation to the conditioned danger cue (p<0.0001, d=1.14) that generalized to class 4 (p=0.002, d=0.80), class 3 (p=0.01, d=0.66), and class 2 (p=0.02, d=0.56) but not class 1 (p=0.11, d=0.37). By contrast, results in comparison subjects (criterion p=0.008) indicate startle potentiation to the conditioned danger cue (p<0.0001, d=1.27) that generalized to class 4 (p=0.001, d=0.78) but not class 3 (p=0.12, d=0.37), class 2 (p=0.54, d=0.14), or class 1 (p=0.37, d=0.20). As denoted by data points outlined in green in Figure 2, generalization of fear-potentiated startle in panic patients can be described as extending as far as the third approximation of the conditioned danger cue (i.e., class 2), whereas that of comparison subjects extended only to the closest approximation (i.e., class 4). This group difference demonstrates that panic patients require less danger cue similarity to trigger the conditioned fear response, and it provides further evidence for stronger fear generalization among patients with panic disorder.
Online risk ratings.
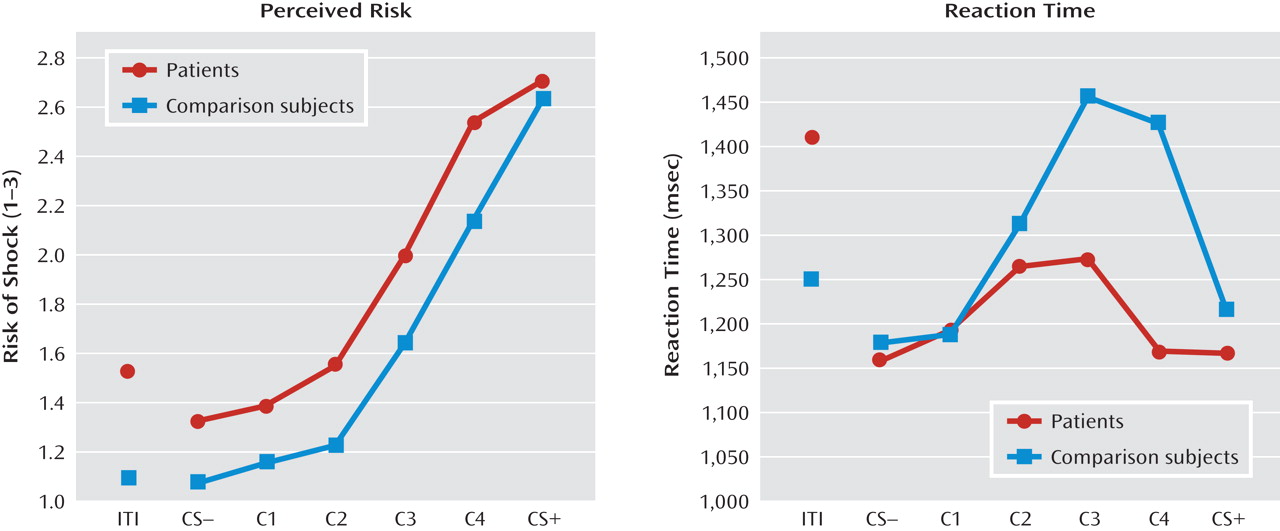
Conditioned elevations in perceived risk to the conditioned danger cue (versus conditioned safety cue) were displayed by both patients and comparison subjects (p values <0.0001, d values >1.55), and such elevations did not differ by group. Additionally, both groups displayed conditioned generalization as indexed by main effects of stimulus type in both patient and comparison groups (both p values <0.0001, d values >1.63) that were driven by graded decreases in perceived risk as the presented stimulus diverged from the conditioned danger cue (see
Figure 3, left panel). Furthermore, a main effect of group was observed (F=4.88, df=1, 36, p=0.004; d=0.70), indicating higher risk ratings among panic patients regardless of stimulus type, and a significant stimulus type-by-group quadratic trend emerged (F=4.89, df=1, 36, p=0.03; d=0.70). This stimulus type-by-group interaction was driven by a group-by-class 4 (versus danger cue) interaction (F=8.45, df=1, 36, p=0.006; d=0.92) whereby panic patients, relative to comparison subjects, displayed less reduction in perceived risk from the conditioned danger cue to its closest approximation, class 4.
Reaction times.
A main effect of stimulus type (F=4.46, df=5, 32, p=0.003; d=0.34) was observed and consisted of quadratic (F=18.19, df=1, 36, p=0.0001; d=0.68) and cubic components (F=5.62, df=1, 36, p=0.02; d=0.38). Reaction time data in both groups form inverted U's (see Figure 3, right panel), suggesting slower risk ratings for stimuli with less certain threat information (classes 1–4) and faster risk ratings for stimuli communicating more certain threat or safety information (i.e., threat and safety signals). Consistent with this visual assessment, overall analyses of data revealed the quickest reaction times to the safety cue, with responses to class 2, class 3, and class 4 each significantly slower than the safety cue (p values <0.009, d values >0.45); significantly slower responses to class 4 and class 3 versus the danger cue (p values <0.02, d values >0.41); and equally fast responses to the conditioned danger relative to the conditioned safety cue (p=0.41, d=0.13). This pattern of results implicates reaction times as an index of threat uncertainty, with longer reaction times reflecting more uncertainty.
Although both groups displayed the inverted-U pattern, a stimulus type-by-group cubic trend was observed (F=7.345, df=1, 36, p=0.01; d=0.86). This interaction was driven by significantly faster responses to class 4 in patients relative to comparison subjects (p<0.05, d=0.45), as group differences between all other stimulus classes were nonsignificant, and reaction times to class 4 versus the danger cue were significantly longer for healthy comparison subjects (p=0.004, d=0.40) but not patients (p=0.94, d=0.06). That response times for class 4 and the danger cue were not significantly different among panic patients suggests that patients were equally certain of risk for shock whether presented with the closest approximation of the danger cue or the danger cue itself. Conversely, among comparison subjects, the significant increase in threat uncertainty from the danger cue to class 4 suggests a decrease in perceived risk from the danger cue to its first approximation. This group difference in reaction time mirrors group differences in risk ratings from the danger cue to class 4 (see Figure 3, left panel). Specifically, as confirmed above by the significant interaction between group status and risk ratings to the danger cue versus class 4, decreases in perceived risk among patients from the danger cue to class 4 were smaller than those among comparison subjects.
Retrospective anxiety.
Conditioned danger relative to conditioned safety cues were rated as more anxiety provoking (mean=7.54, [SD=1.92] compared with mean=1.68, [SD=1.41]; p<0.0001, d=2.51), demonstrating the persistence of conditioning during the generalization test. Additionally, ratings for conditioned danger and safety cues did not differ across patients (CS+: mean=7.68, SD=2.08; CS–: mean=2.05, SD=1.87) and comparison subjects (CS+: mean=7.39, SD=1.79; CS–: mean=1.28, SD=0.46), as indicated by a nonsignificant group-by-stimulus type interaction (p=0.52, d=0.21).
