Abstract

Objective:

The purpose of this study was to examine neural activity and connectivity within cortico-striato-thalamo-cortical circuits and to reveal circuit-based neural mechanisms that govern tic generation in Tourette's syndrome.

Method:

Functional magnetic resonance imaging data were acquired from 13 individuals with Tourette's syndrome and 21 healthy comparison subjects during spontaneous or simulated tics. Independent component analysis with hierarchical partner matching was used to isolate neural activity within functionally distinct regions of cortico-striato-thalamo-cortical circuits. Granger causality was used to investigate causal interactions among these regions.

Results:

The Tourette's syndrome group exhibited stronger neural activity and interregional causality than healthy comparison subjects throughout all portions of the motor pathway, including the sensorimotor cortex, putamen, pallidum, and substantia nigra. Activity in these areas correlated positively with the severity of tic symptoms. Activity within the Tourette's syndrome group was stronger during spontaneous tics than during voluntary tics in the somatosensory and posterior parietal cortices, putamen, and amygdala/hippocampus complex, suggesting that activity in these regions may represent features of the premonitory urges that generate spontaneous tic behaviors. In contrast, activity was weaker in the Tourette's syndrome group than in the healthy comparison group within portions of cortico-striato-thalamo-cortical circuits that exert top-down control over motor pathways (the caudate and anterior cingulate cortex), and progressively less activity in these regions accompanied more severe tic symptoms, suggesting that faulty activity in these circuits may result in their failure to control tic behaviors or the premonitory urges that generate them.

Conclusions:

Our findings, taken together, suggest that tics are caused by the combined effects of excessive activity in motor pathways and reduced activation in control portions of cortico-striato-thalamo-cortical circuits.
Tourette's syndrome is a neuropsychiatric disorder that preferentially affects the face, neck, shoulders, and vocal apparatus to produce involuntary motor and vocal tic behaviors. Anatomical, functional, and lesion studies suggest that Tourette's syndrome is caused by a failure of cortico-striato-thalamo-cortical circuits to inhibit the somatosensory urges and associated motor enactments that constitute tic behaviors (18). However, this hypothesis has yet to be verified by studies of isolated neural activity of the functionally distinct regions that compose cortico-striato-thalamo-cortical circuits, in tics that occur spontaneously in Tourette's syndrome patients compared with healthy individuals performing similar behaviors voluntarily.
Prior functional imaging studies of Tourette's syndrome have attempted to correlate regional brain activity with the temporal occurrence of tics (9, 10), but they have not compared activity during spontaneous tics in Tourette's syndrome patients with activity during similar voluntary behaviors in healthy subjects. They also have not assessed causality among brain regions during tics because they could not detect isolated neural activity from each of the functionally distinct regions that compose cortico-striato-thalamo-cortical circuits. One study computed the cross-correlations of brain activity in the primary motor cortex with activity in the somatosensory and supplementary motor cortices and subcortical nuclei and then compared those correlations between Tourette's syndrome patients during tic behaviors and healthy subjects simulating tic behaviors (11). Group differences were detected only in the supplementary motor area. This limited finding might be attributed to the inherent constraints of region-of-interest analyses, which use a predetermined set of regions rather than those in which activations are found empirically (12).
We therefore acquired functional magnetic resonance imaging (fMRI) data from 13 Tourette's syndrome patients while they alternately either allowed their tics to occur spontaneously (spontaneous tics) or voluntarily produced a single tic-like behavior at a time of their own choosing (voluntary tics). We also acquired fMRI data from 21 healthy comparison subjects who alternately either produced a practiced tic-like behavior at a time of their own choosing (self-paced mimicked tics) or an identical behavior at a time of the experimenter's choosing, as cued by a simple auditory tone (cue-paced mimicked tics). This combination of two diagnostic groups performing two tasks each produced four run types of fMRI data. We hypothesized that we would detect greater neural activity within sensorimotor portions of cortico-striato-thalamo-cortical circuits in the Tourette's syndrome group during spontaneous tics than in the healthy comparison group during self-paced mimicked tics in direct proportion to the severity of tic symptoms. We also hypothesized that reduced activity would be detected in brain regions thought to exert control over these motor pathways (13).
Despite these strong a priori hypotheses, sensorimotor and control portions of cortico-striato-thalamo-cortical circuits involve multiple brain regions, and the precise location of the regions that generate, control, or modulate tic behaviors and premonitory urges in persons with Tourette's syndrome remains uncertain. We therefore used a data-driven approach—independent component analysis—to detect coherent, spatially localized, and task-related blood-oxygen-level-dependent (BOLD) activity in each run type of fMRI data. Independent component analysis is a multivariate method for analysis of fMRI data sets that allows for the separation of noise from physiological signals without knowledge a priori of the defining characteristics of the noise and signal or how they are intermixed (14, 15). Independent component analysis maximizes mutual information within a component while minimizing it between components to identify BOLD activity within brain regions that are functionally distinct and spatially isolated from one another (14, 16, 17). Because BOLD activity is an index of task-related neural activity (18), the regional isolation of BOLD activity using independent component analysis is thought to identify regions in which neural activity is coherent (i.e., where BOLD signals are mutually phase-coupled) and that therefore constitute either a neural circuit or a portion of one circuit (14, 16, 17). We applied independent component analysis, together with a hierarchical extension of our partner matching algorithm (17), to identify independent components that were reproducible across individuals and across each fMRI run type during the production of tics or tic-like behaviors. To clarify how circuits that generate tics interact with those that control them, we also calculated the Granger causality index (19, 20) as a measure of causal interactions among components of cortico-striato-thalamo-cortical circuits that are known to generate or control motor behaviors (5, 2124).

Method

Participants

Thirteen participants with Tourette's syndrome and 21 age-matched healthy comparison subjects were scanned (Table 1 [also see the data supplement accompanying the online edition of this article]). Comparison subjects were not included if they had a prior diagnosis of psychiatric illness. Tourette's syndrome patients were excluded if they had a lifetime illness other than obsessive-compulsive disorder (OCD) or attention deficit hyperactivity disorder (ADHD). Tourette's syndrome patients were required to have a right-sided facial tic to ensure a location of neural generator comparable to at least one tic across participants and to ensure comparability of behavior during spontaneous and mimicked tics. Patients who had large-amplitude excursion tics were excluded from analyses to minimize motion artifact. All Tourette's syndrome patients reported premonitory urges. The following assessment measures were used to evaluate tic disorders, OCD, and ADHD: the Schedule for Tourette and Other Behavioral Syndromes (25), the Yale Global Tic Severity Scale (26), the Yale-Brown Obsessive Compulsive Scale (27), and the ADHD Rating Scale (28). All participants provided written informed consent, and the study was approved by the institutional review boards of Columbia University and New York State Psychiatric Institute.
TABLE 1. Demographic and Clinical Characteristics of Tourette's Syndrome Patients and Healthy Comparison Subjectsa
CharacteristicTourette's Syndrome Group (N=13)Healthy Comparison Group (N=21)
 MeanSDMeanSD
Age (years)33.513.332.511.1
Yale Global Tic Severity Scale scoreb
    Motor plus phonic tics, currentc24.110.1b  
    Motor plus phonic tics, worst everd33.16.8c  
 N%N%
Comorbidity
    Obsessive-compulsive disorder (OCD)646.1  
    Attention deficit hyperactivity disorder (ADHD)215.4  
    OCD and ADHD17.7  
    None646.1  
Medication
    Selective serotonin reuptake inhibitors430.8  
    α-adrenergic agonists17.7  
    Benzodiazepines17.7  
    Medication free753.921100
a
The male/female breakdown was 8 and 5, respectively, in the Tourette's syndrome group and 12 and 9 in the healthy comparison group. One-sample t tests were conducted for each of 15 clusters, covarying for age and sex, to generate 15 random-effect independent component maps; test statistics for age and sex, respectively, were t=0.41, df=32, p=0.68 and χ2=0.06, p=0.80.
b
Data were available for only 12 of the 13 Tourette's syndrome patients.
c
The score range was 11–39.
d
The score range was 26–44.

Experimental Design

Each diagnostic group underwent two types of fMRI scan runs that were unique to each group and that were event-related in design. In the Tourette's syndrome group, one run type, spontaneous tics, permitted all tics to occur spontaneously and naturally, without forcing or inhibiting them. The other run type for this group, voluntary tics, involved a voluntary movement that emulated a right-sided facial tic at a rate that eliminated the premonitory urge normally preceding that tic, thereby eliminating the participant's need to perform the spontaneous tic. For the healthy comparison group, both run types consisted of voluntary movements emulating a single right-sided facial tic. In one run type, self-paced mimicked tics, these movements were self-paced, and in the other run type, cue-paced mimicked tics, they were prompted by an auditory cue at the same rate as the self-paced mimicked tics. Pacing with a sensory cue was included for comparison subjects because tics are usually performed in response to an internal cue (the premonitory urge); the auditory cue was included to control, in part, for this cue-driven feature of tics. For further details about the study design and rationale, see the online data supplement.

Image Acquisition

Imaging was performed on a General Electric 1.5-T Signa scanner (Milwaukee). Functional images consisted of 10 axial slices acquired using a gradient-recalled single-shot echo planar pulse sequence (repetition time=1,200 msec, echo time=60 msec, flip angle=60°, matrix=128×64, field of view=40 cm×20 cm, providing an in-plane resolution of 3.125 mm×3.125 mm), with 102 images acquired per run type. We acquired four run types of fMRI data corresponding to the two conditions for both groups.

Image Analysis

We used three standard fMRI data preprocessing procedures: slice timing and motion correction, spatial normalization, and smoothing. Independent component analysis was conducted for the preprocessed run types, using information criteria to determine the number of sets of independent components to generate. Hierarchical partner matching, an extension of our previously validated partner matching algorithm (17), was used to identify task-related independent components that were reproducible across participants and run types. Briefly, partner matching involves a measure of spatial similarity (Tanimoto distance) to locate independent components that “match” across all participants and run types (17). This procedure allows for identification of corresponding components across participants, given that components never perfectly align across participants. Our hierarchical extension of partner matching automatically determines the optimal number of components to generate for each participant and each run type. First, information criteria are used to estimate the lower and upper bounds of the numbers of independent components to generate. Then, from this space of possible components (from the lower to the upper bound, in increments of 10), sampling determines the optimal number of components to generate for each participant and each run type. Finally, the matched components are combined, and partner matching is used to identify those independent components that are most reproducible across participants, diagnostic groups, and run type (i.e., task), independent of the choice of the number of independent components that are generated. We used Granger causality to analyze causal influences across the regions identified by these components (see the online data supplement).

Results

Reproducible Independent Components

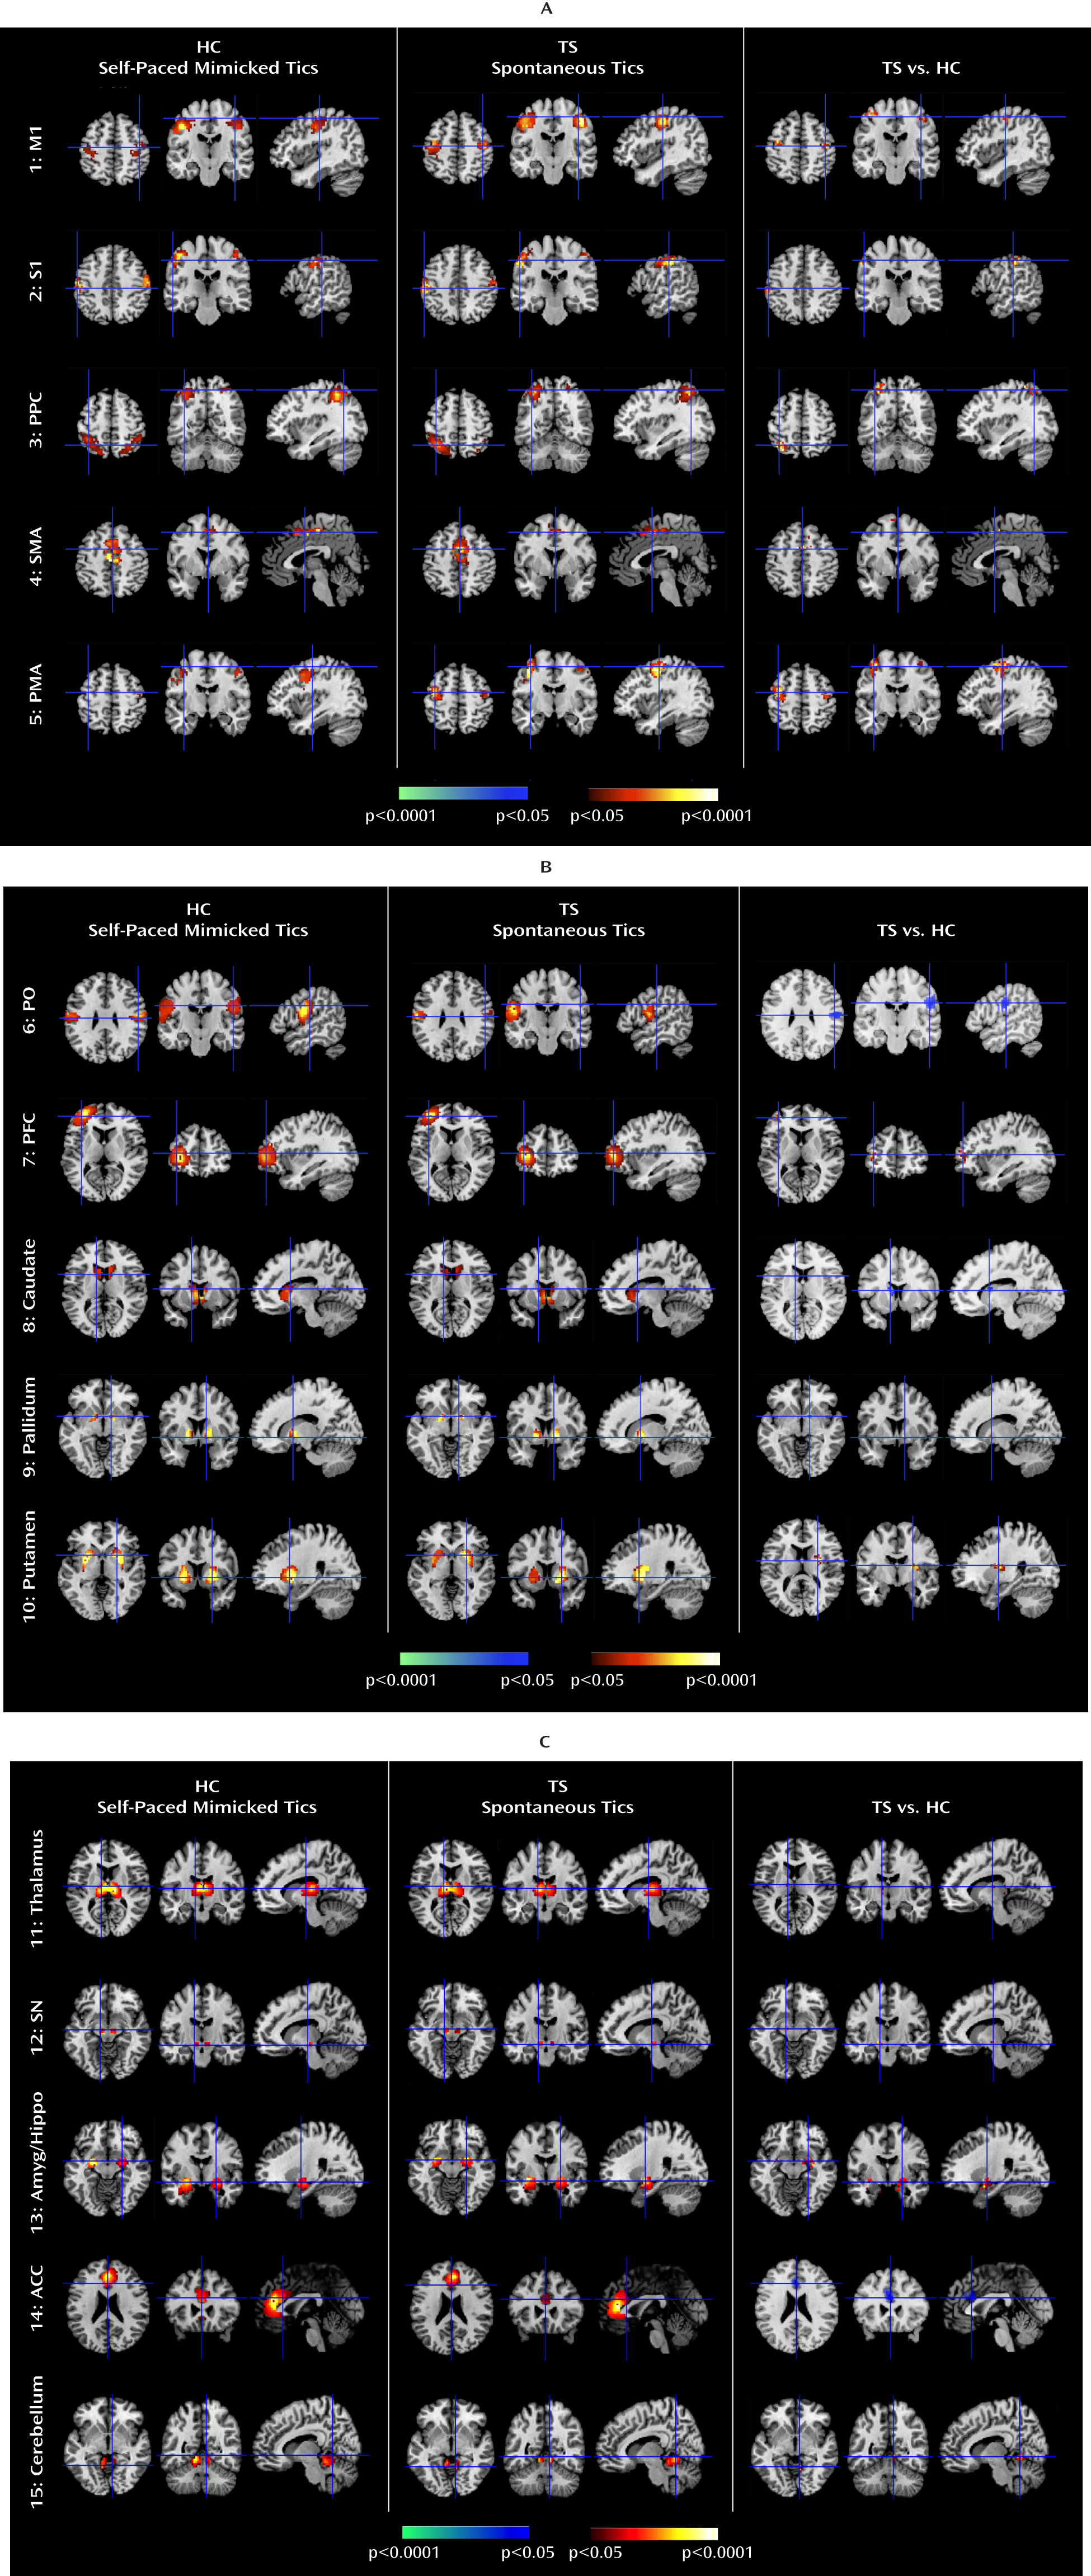
Twelve different sets of independent components for each run type within each participant were generated by independent component analysis. Fifteen clusters of independent components that were significantly reproducible in their spatial patterns across participants, diagnostic groups, and run types were identified by hierarchical partner matching applied to the 12 sets of components. We used the general linear model in SPM to perform a one-sample t test on each of the 15 clusters, covarying for age and sex, to generate 15 random-effect independent component maps (Table 2, Figure 1). Each of the 15 maps represented neural activity in regions that should be functionally interconnected to perform similar functions (16, 17).
TABLE 2. Location and Between-Run-Type Comparisons of the 15 Independent Component Maps
 Region Comparison Between Run Typesa
 Left HemisphereRight Hemisphere Tourette's Syndrome Spontaneous Tics vs. Healthy Comparison Self-Paced Mimicked TicsTourette's Syndrome Voluntary Tics vs. Healthy Comparison Cue-Paced Mimicked TicsTourette's Syndrome Spontaneous vs. Voluntary TicsHealthy Comparison Self- vs. Cue-Paced Mimicked TicsCorrelation With Tic Severity (Tourette's Syndrome Only)a
Independent ComponentTalairach Coordinates (x, y, z)T ScoreTalairach Coordinates (x, y, z)T ScoreFunctional AnatomySpontaneous TicsVoluntary Tics
1–45, –19, 4714.0242, –16, 446.73Primary motor cortex (Brodmann's area 4)IncreasedIncreased  r=0.82, p<0.001r=0.81, p<0.01
2–48, –19, 3811.1157, –13, 4111.40Primary somatosensory cortex (Brodmann's area 3b)IncreasedIncreasedIncreased   
3–36, –61, 4710.9035, –58, 565.59Posterior parietal cortexIncreasedIncreasedIncreased r=0.81, p<0.001r=0.96, p<0.001
40, 2, 509.170, –25, 567.11Supplementary motor cortex (Brodmann's area 6)IncreasedIncreased  r=0.74, p<0.01r=0.65, p<0.05
5–51, –1, 448.7748, –4, 445.30Premotor area (Brodmann's area 6)IncreasedIncreased    
6–60, –16, 239.7463, –13, 1713.24Parietal operculum (Brodmann's area 40)Decreased   r=–0.80, p<0.01r=–0.65, p<0.05
7–30, 47, 521.37  Left prefrontal cortex (Brodmann's area 45)IncreasedIncreased  r=0.75, p<0.01r=0.68, p<0.01
8–6, 11, 824.696, 8, 524.24Left and right caudate nucleiDecreasedDecreased  r=–0.90, p<0.001 
9–15, –7, 59.8418, –4, 117.24Left and right pallidumIncreasedIncreased  r=0.71, p<0.01r=0.65, p<0.05
10–27, –4, 28.3224, 2, 28.33Left and right putamenIncreasedIncreasedIncreased  
11–3, –19, 1413.219, –25, 1414.63Left and right thalamusIncreasedIncreased  r=0.72, p<0.01r=0.77, p<0.01
12–9, –16, –88.458, –18, –96.42Substantia nigraIncreasedIncreased  r=0.74, p<0.01r=0.73, p<0.01
13–21, –16, –711.1627, –10, –107.31Amygdala/hippocampal complexIncreasedIncreasedIncreased  
140, 35, 2325.22  Anterior cingulate cortex (Brodmann's area 24)DecreasedDecreased  r=–0.87, p<0.001r=–0.64, p<0.05
15–6, –52, –79.129, 46, –107.13Cerebellar lobules IV–VIncreasedIncreased  r=0.86, p<0.01r=0.87, p<0.01
a
Data are shown for significant findings only.
FIGURE 1. Comparisons of Neural Activity Between Tourette's Syndrome Patients and Healthy Comparison Subjectsa
a The images show the activity in each of the 15 clusters of independent components: panel A, components 1–5; panel B, components 6–10; and panel C, components 11–15. The first set of three columns displays the random-effect group activity maps detected from 21 healthy comparison subjects (HC) who generated self-paced mimicked tics. The first column is an axial view, the second is a coronal view, and the third is a parasagittal view. The second set of three columns displays the corresponding group activity maps detected from the 13 participants with Tourette's syndrome (TS) who generated spontaneous tics. The third set of three columns displays t contrast maps comparing the group activity maps from the healthy comparison and Tourette's syndrome groups shown in the first and second set of columns. Each row in the first and second set of columns displays one group activity map that was generated by applying a one-sample t test to one of the 15 clusters of independent components. Each number at the left side of each row indicates that the group activity map on that row corresponds to a numbered cluster of independent components listed in Table 2. Any two group activity maps within the same row across the first and second columns are significantly similar to one another in their spatial configurations. The images show that relative to healthy comparison subjects, Tourette's syndrome patients had stronger activity (as evidenced by the color red in the TS versus HC columns) in the primary motor cortex (M1), primary somatosensory cortex (S1), posterior parietal cortex (PPC), supplementary motor area (SMA), premotor area (PMA), left prefrontal cortex (PFC), pallidum, putamen, thalamus, substantia nigra (SN), amygdala/hippocampal complex (Amyg/Hippo), and cerebellar lobules IV–V. Relative to healthy comparison subjects, Tourette's syndrome patients had weaker activity (as evidenced by the color blue in the TS versus HC columns) in the parietal operculum (PO), caudate, and anterior cingulate cortex (ACC).

Comparing Activity Across Diagnostic Groups

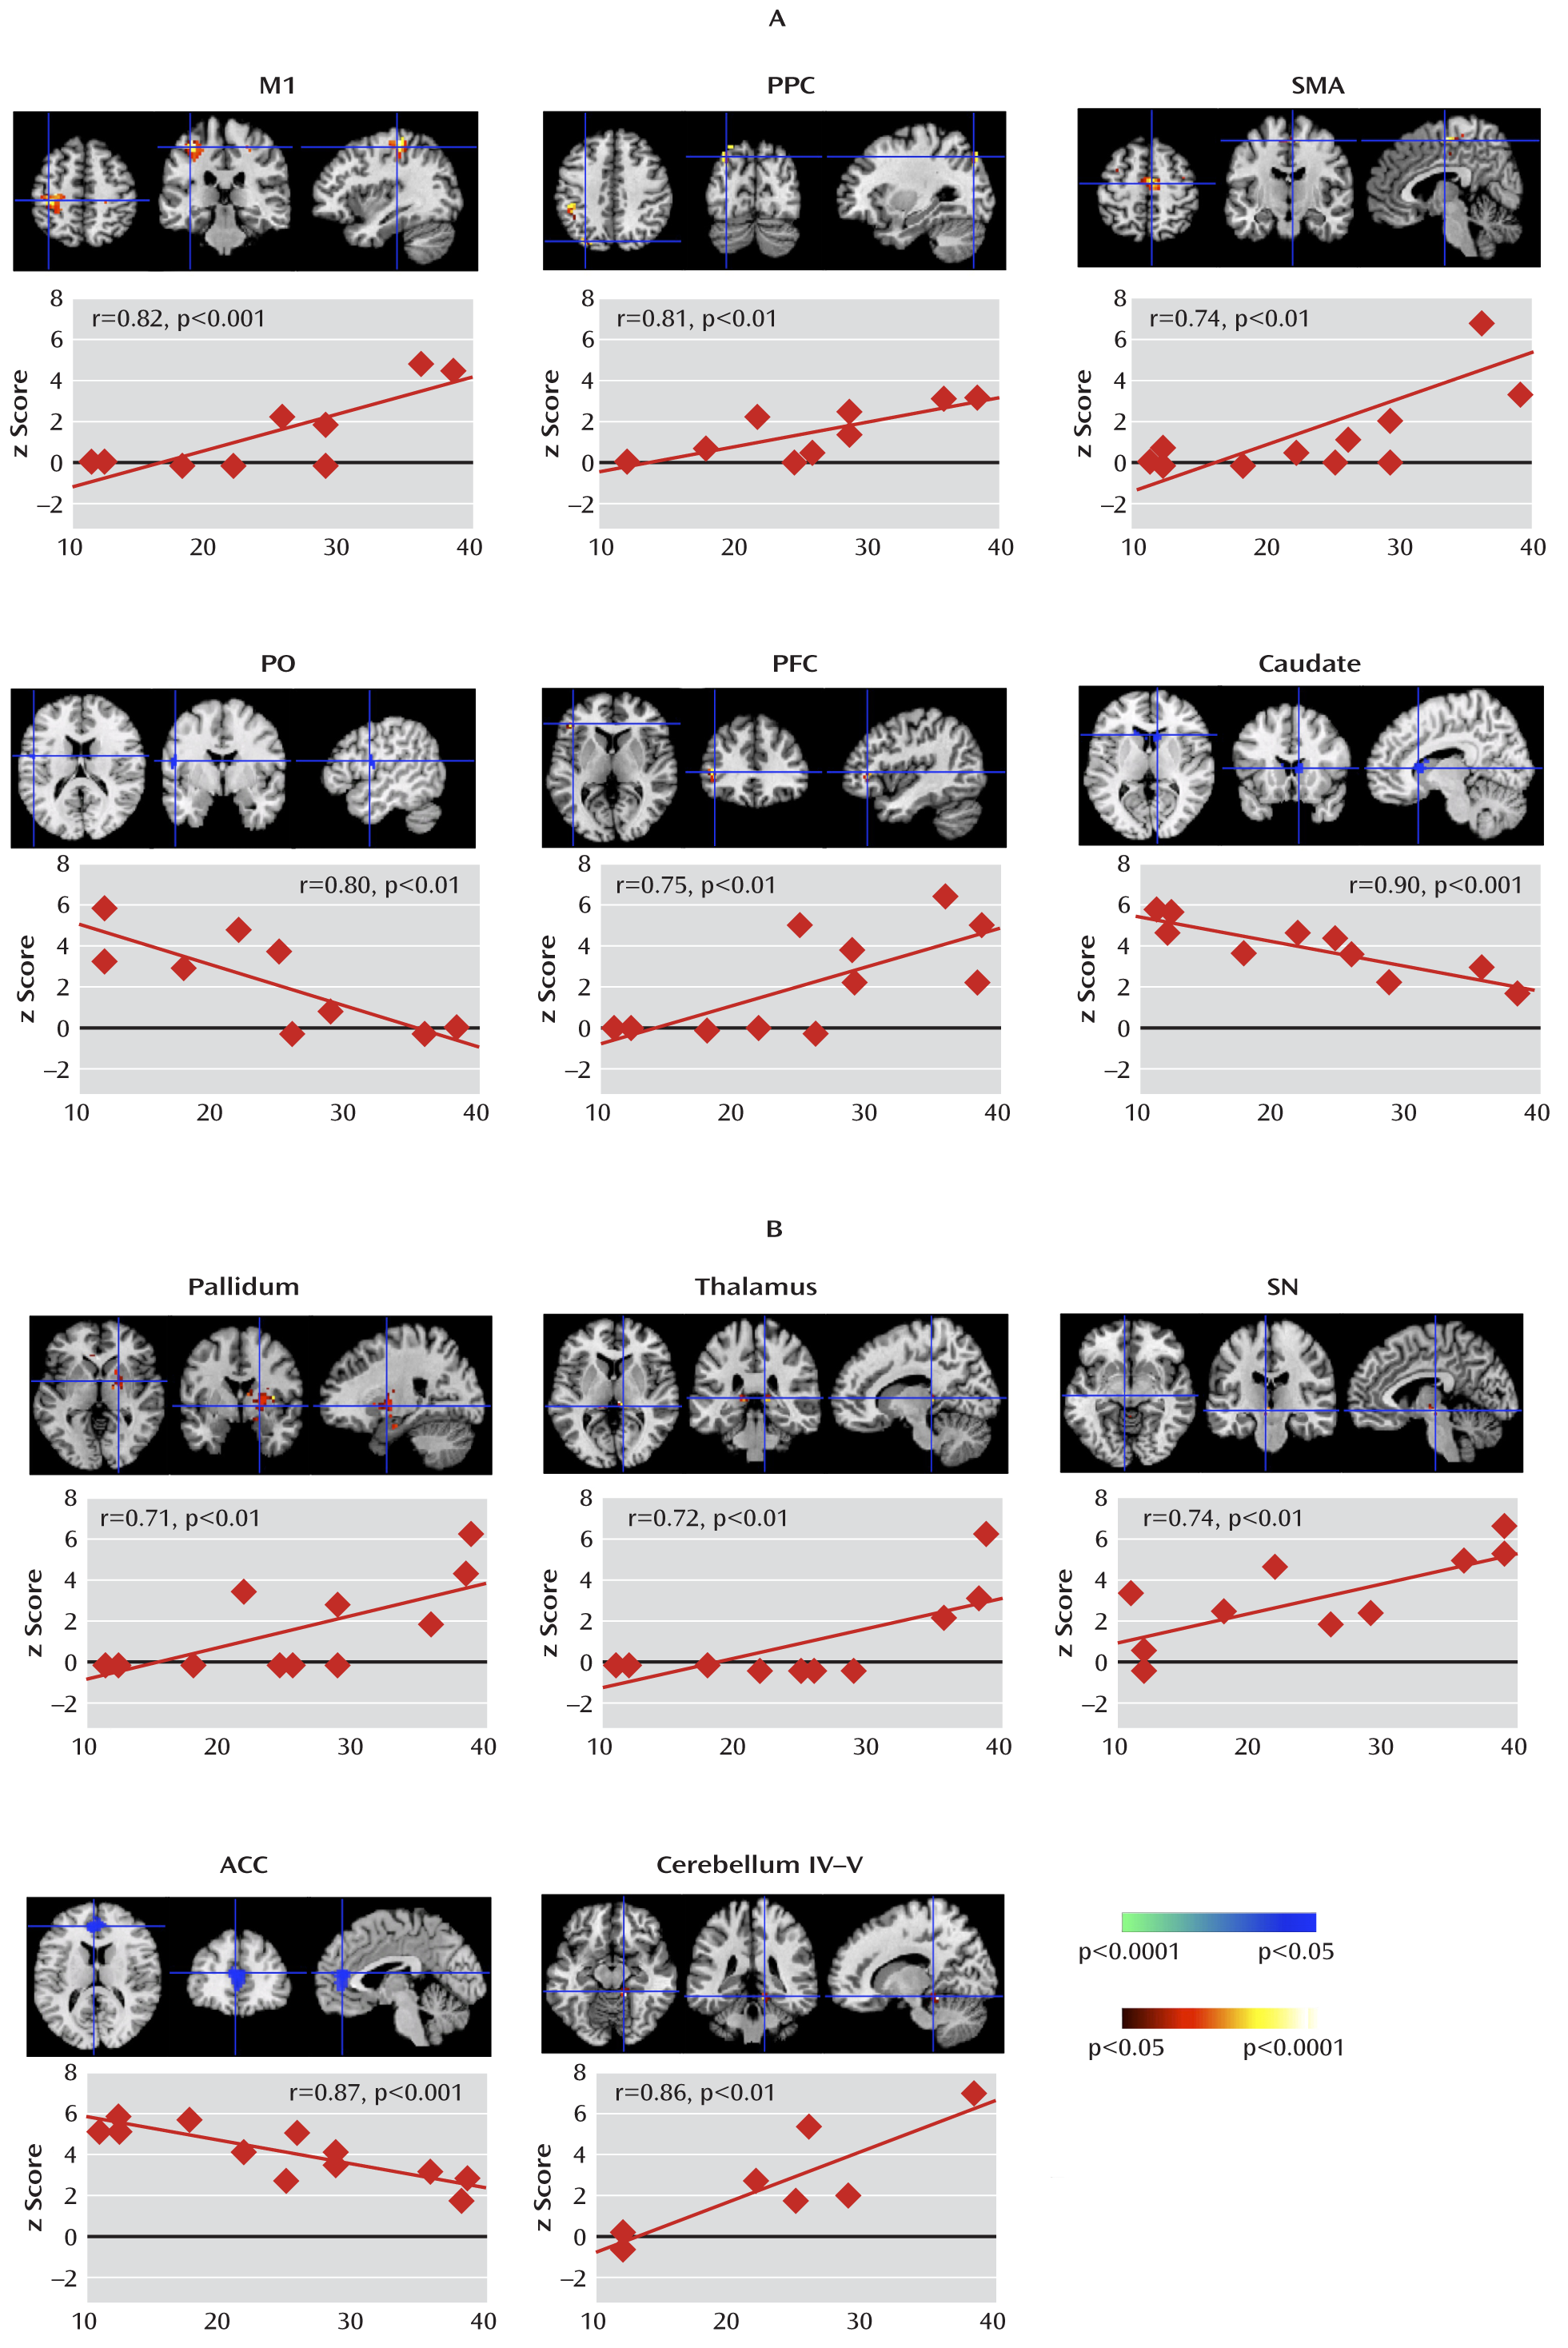
Activity between the Tourette's syndrome and comparison groups was compared using general linear modeling, while covarying for age and sex in each of the 15 clusters of independent components. Generally, neural activity was significantly stronger in the Tourette's syndrome group during spontaneous tics than in the comparison group during production of self-paced mimicked tics in the 12 regions (Figure 1, Table 2), and activity in most of these regions in the Tourette's syndrome group correlated positively with tic severity (Figure 2). The regions with significant correlations with current tic severity were as follows: primary motor cortex (r=0.82, p<0.001); posterior parietal cortex (r=0.81, p<0.01); supplementary motor area (r=0.74, p<0.01); left prefrontal cortex (r=0.75, p<0.01); left and right pallidum (r=0.71, p<0.01); each hemi-thalamus (r=0.72, p<0.01); substantia nigra (r=0.74, p<0.01); and cerebellar lobules IV–V (r=0.86, p<0.01). In a small number of regions, activity was weaker in the Tourette's syndrome group and correlated inversely with tic severity (Figure 2). These regions included the anterior cingulate cortex (r=–0.87, p<0.001), both caudate nuclei (r=–0.90, p<0.001), and the parietal operculum (r=–0.80, p<0.01). We detected nearly identical group differences when comparing neural activity in Tourette's syndrome patients during voluntary tics with activity in healthy subjects during cue-paced mimicked tics, except the groups did not differ with regard to activity in the parietal operculum and activity in the caudate did not correlate significantly with tic severity (Table 2). All these group differences were unchanged when covarying for medication treatment, OCD, and ADHD among Tourette's syndrome patients.
FIGURE 2. Correlations of Blood-Oxygen-Level-Dependent Activity With Tic Severity in Tourette's Syndrome Patientsa
a Each panel (A and B) is labeled by the name of the location of significant activity identified in the specific group activity map. The upper portion of each panel displays the correlation map produced by calculating, at every voxel across the 12 Tourette's syndrome patients for whom tic severity scores were available, the correlation coefficient between tic severity and the z score for each of the 15 clusters of independent components when generating spontaneous tics. Fifteen component maps were obtained, but four had no voxels containing significant correlations with tic severity, and thus only the remaining 11 maps that did contain significant correlations are shown. Each set of images is accompanied by the corresponding scatterplot for the correlation of tic severity with the z scores of that activity map averaged across voxels in the identified cluster. Neural activity correlated significantly with severity scores in the primary motor cortex (M1) (r=0.82, p<0.001), posterior parietal cortex (PPC) (r=0.81, p<0.01), supplementary motor area (SMA) (r=0.74, p<0.01), parietal operculum (PO) (r=–0.80, p<0.01 [inversely correlated]), left prefrontal cortex (PFC) (r=0.75, p<0.01), caudate (r=–0.90, p<0.001 [inversely correlated]), pallidum (r=0.71, p<0.01), thalamus (r=0.72, p<0.01), substantia nigra (SN) (r=0.74, p<0.01), anterior cingulate cortex (ACC) (r=–0.87, p<0.001 [inversely correlated]), and cerebellar lobules IV–V (r=0.86, p<0.01).

Comparing Activity Across Tasks Within Each Diagnostic Group

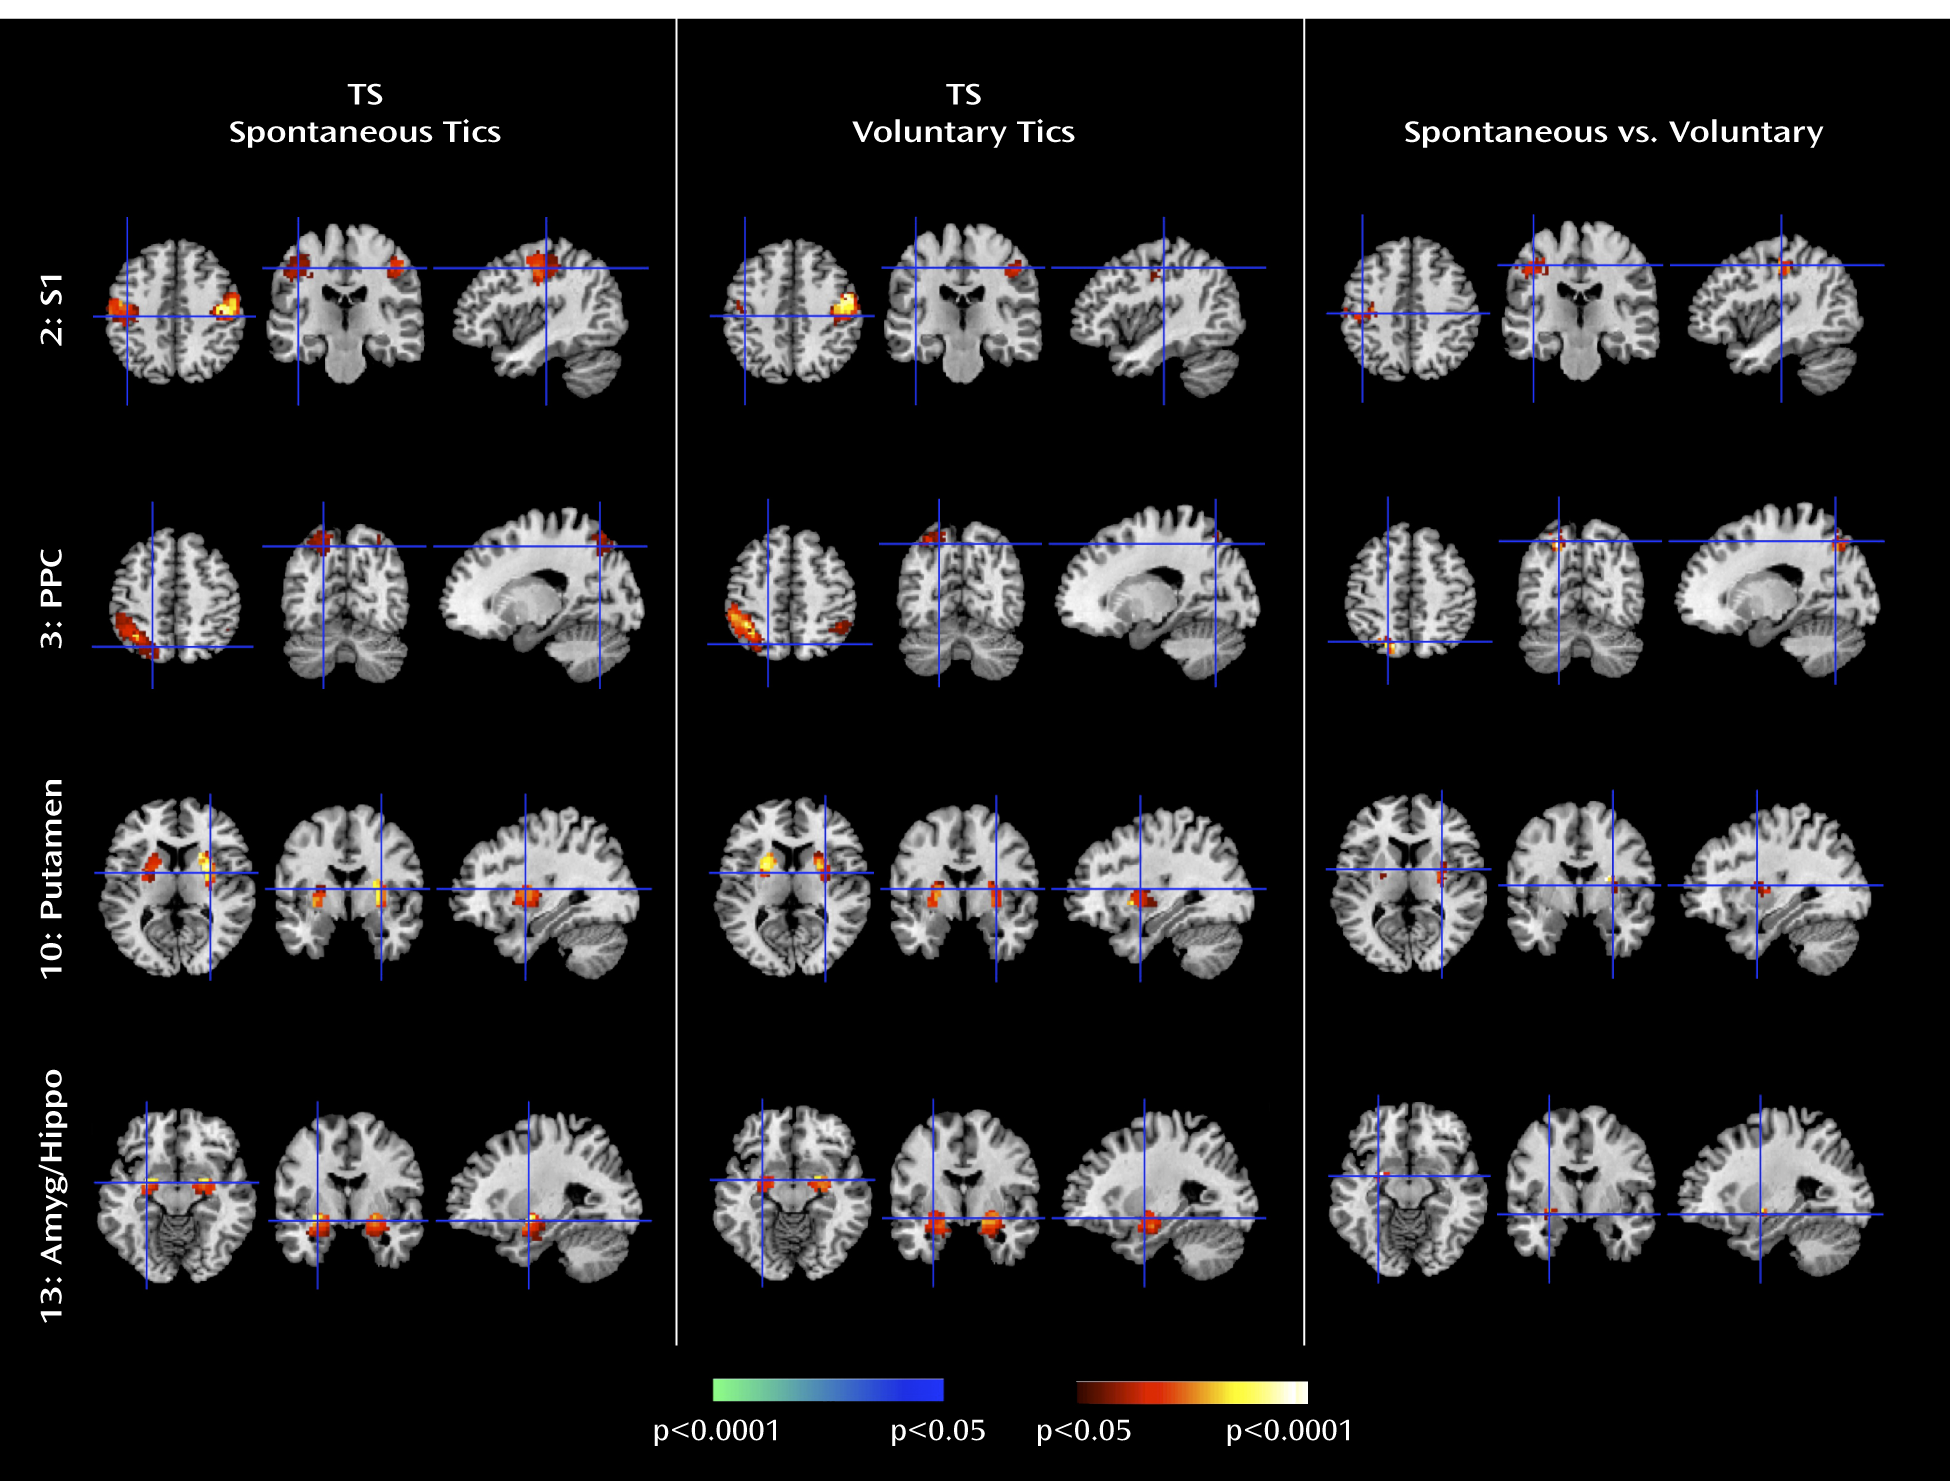
We performed a paired t test assessing within-subject differences in each of the 15 clusters across the two tasks within each group. This comparison in healthy subjects during self- versus cue-paced mimicked tics assessed whether pacing with a cue generated significant differences in component activity relative to a self-generated behavior. We detected no significant differences in component activity in healthy subjects across the two tasks. We also compared activity in Tourette's syndrome patients during spontaneous tics to activity during voluntary tics (Figure 3) to identify activity uniquely associated with the generation of spontaneous tics. Significantly stronger activity was detected during spontaneous tics within the primary somatosensory and posterior parietal cortices, the putamen, and the amygdala/hippocampus complex compared with activity during voluntary tics.
FIGURE 3. Comparison of Blood-Oxygen-Level-Dependent Activity for Spontaneous and Voluntary Tics in Tourette's Syndrome Patientsa
a The first set of 3 columns displays the random-effect group activity maps detected from the 13 Tourette's syndrome patients as they generated spontaneous tics. The second set of three columns displays the random-effect group activity maps detected in the same 13 patients when generating voluntary tics. The third set of three columns displays the t-contrast maps that compare activity when generating voluntary tics with activity when generating spontaneous tics. Regions containing significant (p<0.05) differences were the left primary somatosensory cortex (S1), posterior parietal cortex (PPC), putamen, and amygdala. In each instance, activity during spontaneous tics was greater than during voluntary tics.

Granger Causality Interactions

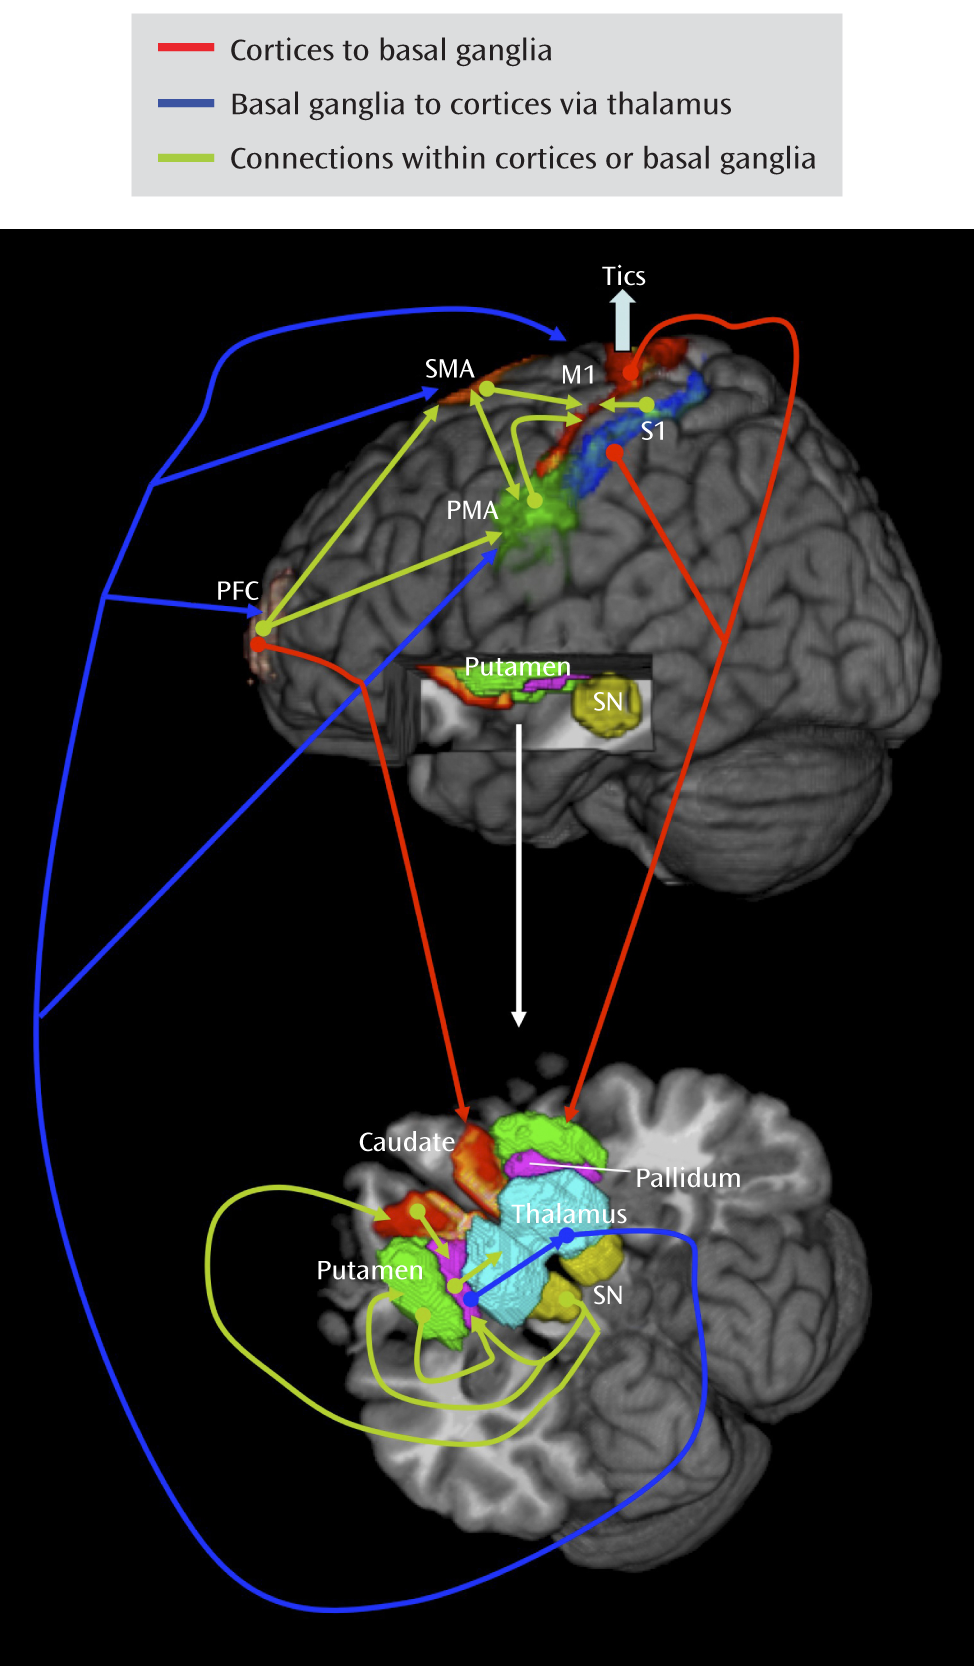
Granger causality indices (GCIs) were used to assess the causal interactions between the time courses of the independent components involved in motor generation or control, which are the primary motor and somatosensory cortices, supplementary motor and premotor areas, putamen, caudate, pallidum, thalamus, substantia nigra, and prefrontal cortex (Figure 4) (21, 22, 24). This analysis produced two types of causality indices for each run type: 1) GCIA→B (influence of region A on B) and 2) GCIA→B|C (influence of region A on B through region C), where C indicated activity in the thalamus when assessing causal influences from the basal ganglia to the cortices. The Wilcoxon rank test was used to compare GCIA→B and GCIA→B|C for all connections defined by the motor circuit (Figure 4), comparing each connection within and across diagnostic groups for the four run types (see the online data supplement). The data were represented by the median and the interquartile range. Causal influences were stronger in the Tourette's syndrome group during spontaneous tics than in the comparison group during self-paced mimicked tics in the connections from the premotor to supplementary motor area (0.031 [0.024–0.088] versus 0.008 [0.004–0.034], respectively; p<0.01) and vice versa (0.023 [0.009–0.067] versus 0.011 [0.004–0.018]; p<0.05); from the primary somatosensory cortex to the primary motor cortex (0.071 [0.021–0.146] versus 0.012 [0.004–0.067]; p<0.05); from the substantia nigra to the caudate (0.069 [0.041–0.112] versus 0.015 [0.006–0.043]; p<0.01) and to the putamen (0.028 [0.020–0.056] versus 0.011 [0.005–0.023]; p<0.05); and from the pallidum to the supplementary motor area via the thalamus (0.066 [0.034–0.100] versus 0.022 [0.014–0.045]; p<0.05).
FIGURE 4. Motor Circuits Hypothesized to Generate or Control Tics in Tourette's Syndromea
a The image shows volume renderings (generated using in-house Java three dimensional-based volume rendering software) of the maps of independent components representing activity in motor pathways, including the premotor area (PMA), supplementary motor area (SMA), primary motor cortex (M1), primary sensory cortex (S1), caudate, putamen, pallidum, substantia nigra (SN), thalamus, and prefrontal cortex (PFC), overlayed on a high-resolution anatomical template. Structures are color-coded (and some are represented in the two hemispheres). The connections indicate the hypothesized directions of effective connectivity between regions based on previously published preclinical studies (21, 22, 24).
Causal influences were stronger in the Tourette's syndrome group during voluntary tics than in the comparison group during cue-paced mimicked tics in the connections from the prefrontal to premotor cortices (0.028 [0.015–0.054] versus 0.008 [0.002–0.023], respectively; p<0.05) and to the supplementary motor cortex (0.037 [0.019–0.072] versus 0.012 [0.004–0.019]; p<0.01); from the premotor to supplementary motor area (0.046 [0.024–0.162] versus 0.006 [0.002–0.036]; p<0.05); from the premotor cortex to the primary motor cortex (0.069 [0.041–0.176] versus 0.024 [0.002–0.043]; p<0.01); from the primary somatosensory cortex to the putamen (0.065 [0.015–0.152] versus 0.015 [0.007–0.042]; p<0.05); from the pallidum to the thalamus (0.049 [0.016–0.070] versus 0.019 [0.010–0.042]; p<0.05); and from the substantia nigra to the caudate (0.064 [0.025–0.073] versus 0.016 [0.005–0.026]; p<0.01). We compared the causal influences between run types within each of the groups but did not detect significant differences.
We also calculated the Spearman's rank correlation between causality indices and symptom severity in the Tourette's syndrome group. During spontaneous tics, a positive correlation was detected in the connections between the primary motor cortex and putamen (rs=0.60, p<0.05). During voluntary tics, positive correlations were detected in the connections from the premotor cortex to the primary motor cortex (rs=0.69, p<0.05), from the primary somatosensory cortex to the primary motor cortex (rs=0.61, p<0.05), from the pallidum to the supplementary motor area via the thalamus (rs=0.66, p<0.05), and from the pallidum to the primary motor cortex via the thalamus (rs=0.80, p<0.01).

Discussion

We isolated neural activity within independent components representing portions of cortico-striato-thalamo-cortical circuits that are involved in planning, controlling, and executing motor behaviors, including the primary motor, supplementary motor, premotor, somatosensory, and prefrontal cortices and the putamen, caudate, pallidum, thalamus, and substantia nigra (21, 24, 29). We detected these components during the expression of spontaneous tics in the Tourette's syndrome group and during the voluntary imitation of a facial tic in both the Tourette's syndrome and healthy comparison groups. Activity in the Tourette's syndrome group was greater during spontaneous tics than in the comparison group during self-paced mimicked tics in most sensorimotor portions of cortico-striato-thalamo-cortical loops. Moreover, activity within these regions correlated positively with the severity of tics in the Tourette's syndrome group, indicating that increasing activity within sensorimotor portions of these loops accompanied more severe tic behaviors. These findings demonstrate that tics engage the same neural circuits that support the expression of normal voluntary motor behaviors in healthy individuals. More severe tic symptoms simply produce more activity in these motor circuits.
Analyses of Granger causality demonstrated that the activity within sensorimotor pathways in the Tourette's syndrome group during the spontaneous generation of tics follows a chain of causal influences within the pathways that have long been postulated in the generation of movement: from the premotor to supplementary motor area, from the primary somatosensory cortex to the primary motor cortex, from the pallidum via the thalamus to the supplementary motor area, and from the substantia nigra to the striatum. These measures of causal influence were stronger in the Tourette's syndrome group than in the comparison group, suggesting an enhanced functional coupling of activity between successive nodes in this circuit in Tourette's syndrome. Furthermore, the top-down causal influence from the primary motor cortex to the putamen during spontaneous tics, and the bottom-up influence from the pallidum to the primary motor cortex via the thalamus during voluntary tics, correlated positively with tic severity, confirming that a stronger generation of tics may be caused by a greater interaction between the motor cortices and striatum.
In contrast, activity in the anterior cingulate, parietal operculum, and caudate was significantly less in the Tourette's syndrome group during spontaneous tics than in the comparison group during voluntary mimicking tics, with less activity in each of these regions in the Tourette's syndrome group accompanying more severe symptoms. The anterior cingulate and caudate represent cognitive control portions of cortico-striato-thalamo-cortical loops (23, 30) that can modulate activity in sensorimotor portions of the striatum via striato-nigro-striatal (31) and striato-thalamo-striatal circuits (32). Activity in the anterior cingulate and caudate are known to increase during the successful and willful suppression of tic behaviors (33), with greater caudate activation accompanying fewer tic symptoms. Thus, reduced activity in the anterior cingulate and caudate during spontaneous tics in the Tourette's syndrome group likely represented deficient engagement of circuits that inhibit either tic behaviors or the sensorimotor urges that produce them. These findings remained significant when comparing activity during spontaneous tics in the Tourette's syndrome group with activity during cue-paced mimicked tics in the comparison group, demonstrating that group differences were not simply the consequence of spontaneous tics being generated by cues (the premonitory urge). Thus, our findings suggest that tics are caused by the combined effects of excessive activity in motor pathways and reduced activity in control portions of cortico-striato-thalamo-cortical circuits, consistent with evidence of abnormal development of control regions in Tourette's syndrome patients (34).
The Tourette's syndrome group exhibited greater activity in the putamen, somatosensory cortices (including the primary somatosensory cortex and parietal operculum), and amygdala/hippocampus complex during the spontaneous generation of tics than during the voluntary imitation of tics, a contrast designed to help identify regions that contribute to the generation of spontaneous tics. Conceptually, spontaneous tics should differ from voluntary tics in the presence of 1) a “tic generator” during spontaneous tics, 2) premonitory urges associated with spontaneous tics (with the urges themselves possibly being the tic generators), or 3) volitional control during voluntary tics. Differences in neural activity between spontaneous and voluntary tics could derive from any of these three sources. However, given the intense sensory and emotional salience of the premonitory urge in the subjective experience of Tourette's syndrome patients (35, 36), the differences in activity that we detected in primarily sensory and emotional pathways seem most likely to derive from intense sensory and emotional experiences associated with premonitory urges in the Tourette's syndrome group. Therefore, we suspect that greater activity in somatosensory cortices likely represented the sensory features of those urges, whereas greater activity in the amygdala/hippocampus complex likely represented either the emotional discomfort associated with the urges before the tic or the relief experienced following the tic. The stronger Granger causality index from the primary somatosensory cortex to the primary motor cortex during spontaneous tics in the Tourette's syndrome group than during self-paced mimicked tics in the comparison group further suggests that activity in sensory cortices from these premonitory urges causally influenced activity in motor pathways.
Greater activity found in the amygdala in the Tourette's syndrome group can have alternative explanations. The emotional experiences signaled by the amygdala can influence motor pathways via projections to the ventral striatum, which in turn influences motor areas in the dorsal striatum (31). These pathways are similar to those implicated in addictive behaviors (37), which, like the tics in Tourette's syndrome, have compulsory qualities.
The Tourette's syndrome group had greater neural activity than the comparison group within the substantia nigra during the performance of spontaneous and voluntary tics. Causal influences of the substantia nigra on the caudate were also stronger in the Tourette's syndrome group during spontaneous tics than in the comparison group during the performance of both self-paced and cue-paced mimicked tics. The pars compacta of the substantia nigra contains dopaminergic neurons that project to the striatum, and excessive striatal dopaminergic activity has long been suspected to play a role in Tourette's syndrome (38). Our findings may therefore reflect overactive nigrostriatal dopaminergic activity in the disorder.
Our findings permit a detailed understanding of the circuit-based disturbances that together generate tics. They suggest that increased activity in the primary somatosensory cortex, putamen, and amygdala/hippocampus may represent activity associated with the premonitory urge and act as a trigger for tic behaviors. They also indicate that the primary sensory cortex exerts a causal influence on the putamen that is greater in the Tourette's syndrome patients than in the healthy subjects, presumably within the projection from the sensory cortex to the putamen that is known to be glutamatergic and excitatory. These findings further suggest that increased activity in the putamen in the Tourette's syndrome group exerts an increased causal influence on the pallidum, a projection that is inhibitory (γ-aminobutyric acid-ergic). The pallidum sends an inhibitory projection to the thalamus, and the thalamus in turn sends an excitatory projection to the motor cortex, a pathway that our data indicate overall had a stronger causal influence in the Tourette's syndrome group than in the comparison group. The stronger inhibitory influence of the putamen on the pallidum would therefore ultimately disinhibit thalamic excitation of the cortex, which should increase the production of tics, consistent with dysfunction in the direct pathway of cortico-striato-thalamo-cortical circuits in Tourette's syndrome (5). Finally, our findings indicate that the putative trigger from the premonitory sensory urge and the excess activity in motor portions of cortico-striato-thalamo-cortical circuits combines with reduced activity in the anterior cingulate and caudate—the putative control portions of these circuits—to yield disinhibited and poorly regulated motor activity in proportion to tic severity.
This study has several limitations, including a small sample size, inclusion of medicated patients and patients with comorbid illnesses, and absence of adults with remitted symptoms. A follow-up study with a larger sample would help to assess more rigorously any possible effects of medications and comorbid illnesses. Our study, similar to prior studies, was unable to control stringently for the strength, duration, or pacing of tics across conditions or groups (although visually the tic behaviors were indistinguishable across conditions and groups). Finally, our partner matching technique detects independent components that are reproducible and can be compared across conditions and groups; it does not permit identification of components unique to a condition or group.
This is the first time, to our knowledge, that neural activity in all major components of a cortico-striato-thalamo-cortical circuit has been detected using an analysis of BOLD signals. Comparing activity in this circuit during a pathological involuntary behavior (spontaneous tics) with activity during a similar normal voluntary behavior (voluntary or mimicked tics) across patient and healthy comparison groups allowed us to demonstrate that tics engage the same motor circuit as normal voluntary behaviors. This comparison also permitted us to identify the somatosensory cortices, putamen, and amygdala/hippocampal complex as regions that likely subserve the experience of premonitory sensory urges and their associated emotional content. Finally, the comparison also allowed us to show that tics likely arise as a combined consequence of this sensory trigger, its contributions to the excessive activity in motor pathways, and faulty regulation from the anterior cingulate cortex and caudate nucleus.
Footnote

Received Nov. 27, 2009; revisions received Dec. 1, 2010 and April 10, 2011; accepted May 11, 2011.

Supplementary Material

File (appi.ajp.2011.09111692.ds001.pdf)

References

1.
Albin RL, Mink JW: Recent advances in Tourette syndrome research. Trends Neurosci 2006; 29:175–182
2.
Groenewegen HJ, van den Heuvel OA, Cath DC, Voorn P, Veltman DJ: Does an imbalance between the dorsal and ventral striatopallidal systems play a role in Tourette's syndrome? a neuronal circuit approach. Brain Dev 2003; 25:S3–S14
3.
Mink JW: Neurobiology of basal ganglia circuits in Tourette syndrome: faulty inhibition of unwanted motor patterns? Adv Neurol 2001; 85:113–122
4.
Mink JW: Basal ganglia dysfunction in Tourette's syndrome: a new hypothesis. Pediatr Neurol 2001; 25:190–198
5.
Mink JW: Neurobiology of basal ganglia and Tourette syndrome: basal ganglia circuits and thalamocortical outputs. Adv Neurol 2006; 99:89–98
6.
Peterson BS: Neuroimaging studies of Tourette syndrome: a decade of progress. Adv Neurol 2001; 85:179–196
7.
Peterson BS, Thomas P, Kane MJ, Scahill L, Zhang H, Bronen R, King RA, Leckman JF, Staib L: Basal ganglia volumes in patients with Gilles de la Tourette syndrome. Arch Gen Psychiatry 2003; 60:415–424
8.
Ziemann U, Paulus W, Rothenberger A: Decreased motor inhibition in Tourette's disorder: evidence from transcranial magnetic stimulation. Am J Psychiatry 1997; 154:1277–1284
9.
Baym CL, Corbett BA, Wright SB, Bunge SA: Neural correlates of tic severity and cognitive control in children with Tourette syndrome. Brain 2008; 131:165–179
10.
Bohlhalter S, Goldfine A, Matteson S, Garraux G, Hanakawa T, Kansaku K, Wurzman R, Hallett M: Neural correlates of tic generation in Tourette syndrome: an event-related functional MRI study. Brain 2006; 129:2029–2037
11.
Hampson M, Tokoglu F, King RA, Constable RT, Leckman JF: Brain areas coactivating with motor cortex during chronic motor tics and intentional movements. Biol Psychiatry 2009; 65:594–599
12.
Poldrack RA: Region of interest analysis for fMRI. Soc Cogn Affect Neurosci 2007; 2:67–70
13.
Marsh R, Gorman D, Royal J, Peterson BS: Tourette syndrome and obsessive-compulsive disorder: disturbances in the maturation of frontostriatal systems, in Neuroimaging in Developmental Clinical Neuroscience. Edited by, Ernst M, Rumsey J. Cambridge, United Kingdom, Cambridge University, 2008, pp 200–217
14.
Jung TP, Makeig S, McKeown MJ, Bell AJ, Lee TW, Sejnowski TJ: Imaging brain dynamics using independent component analysis. Proc IEEE Inst Electr Electron Eng 2001; 89:1107–1122
15.
McKeown MJ, Makeig S, Brown GG, Jung TP, Kindermann SS, Bell AJ, Sejnowski TJ: Analysis of fMRI data by blind separation into independent spatial components. Hum Brain Mapp 1998; 6:160–188
16.
van de Ven VG, Formisano E, Prvulovic D, Roeder CH, Linden DE: Functional connectivity as revealed by spatial independent component analysis of fMRI measurements during rest. Hum Brain Mapp 2004; 22:165–178
17.
Wang Z, Peterson BS: Partner-matching for the automated identification of reproducible ICA components from fMRI datasets: algorithm and validation. Hum Brain Mapp 2008; 29:875–893
18.
Fox MD, Snyder AZ, Zacks JM, Raichle ME: Coherent spontaneous activity accounts for trial-to-trial variability in human evoked brain responses. Nat Neurosci 2006; 9:23–25
19.
Chen Y, Rangarajan G, Feng J, Ding M: Analyzing multiple nonlinear time series with extended Granger causality. Physics Lett A 2004; 324:26–35
20.
Granger CWJ: Investigating causal relations by econometric models and cross-spectral methods. Econometrica 1969; 37:424–438
21.
Carlson NR: Control of movement, in Physiology of Behavior, 6th ed. Needham Heights, Mass, Allyn & Bacon, 1998, pp 224–251
22.
Eccles JC: The control of movement by the brain, in The Understanding of the Brain. New York, McGraw-Hill, 1977, pp 106–145
23.
Middleton FA, Strick PL: Basal ganglia and cerebellar loops: motor and cognitive circuits. Brain Res Brain Res Rev 2000; 31:236–250
24.
Passingham RE, Ramnani N, Rowe JB: The motor system, in Human Brain Function. Edited by, Frackowiak RSJ. San Diego, Academic Press, 2004, pp 5–32
25.
Pauls DL, Hurst CR: Schedule for Tourette and Other Behavioral Syndromes. New Haven, Conn, Yale University Child Study Center, 1996
26.
Leckman JF, Riddle MA, Hardin MT, Ort SI, Swartz KL, Stevenson J, Cohen DJ: The Yale Global Tic Severity Scale: initial testing of a clinician-rated scale of tic severity. J Am Acad Child Adolesc Psychiatry 1989; 28:566–573
27.
Goodman WK, Price LH, Rasmussen SA, Mazure C, Fleischmann RL, Hill CL, Heninger GR: The Yale-Brown Obsessive Compulsive scale, I: development, use, and reliability. Arch Gen Psychiatry 1989; 46:1006–1011
28.
Barkley RA, DuPaul GJ, McMurray MB: Attention deficit disorder with and without hyperactivity: clinical response to three dose levels of methylphenidate. Pediatrics 1991; 87:519–531
29.
D'Ardenne K, McClure SM, Nystrom LE, Cohen JD: BOLD responses reflecting dopaminergic signals in the human ventral tegmental area. Science 2008; 319:1264–1267
30.
Devinsky O, Morrell MJ, Vogt BA: Contributions of anterior cingulate cortex to behaviour. Brain 1995; 118(pt 1):279–306
31.
Haber SN: The primate basal ganglia: parallel and integrative networks. J Chem Neuroanat 2003; 26:317–330
32.
de las Heras S, Mengual E, Giménez-Amaya JM: Double retrograde tracer study of the thalamostriatal projections to the cat caudate nucleus. Synapse 1999; 32:80–92
33.
Peterson BS, Skudlarski P, Anderson AW, Zhang H, Gatenby JC, Lacadie CM, Leckman JF, Gore JC: A functional magnetic resonance imaging study of tic suppression in Tourette syndrome. Arch Gen Psychiatry 1998; 55:326–333
34.
Church JA, Fair DA, Dosenbach NU, Cohen AL, Miezin FM, Petersen SE, Schlaggar BL: Control networks in paediatric Tourette syndrome show immature and anomalous patterns of functional connectivity. Brain 2009; 132:225–238
35.
Bliss J: Sensory experiences of Gilles de la Tourette syndrome. Arch Gen Psychiatry 1980; 37:1343–1347
36.
Cohen AJ, Leckman JF: Sensory phenomena associated with Gilles de la Tourette's syndrome. J Clin Psychiatry 1992; 53:319–323
37.
Belin D, Everitt BJ: Cocaine seeking habits depend upon dopamine-dependent serial connectivity linking the ventral with the dorsal striatum. Neuron 2008; 57:432–441
38.
Steeves TD, Fox SH: Neurobiological basis of serotonin-dopamine antagonists in the treatment of Gilles de la Tourette syndrome. Prog Brain Res 2008; 172:495–513

Information & Authors

Information

Published In

Go to American Journal of Psychiatry
American Journal of Psychiatry
Pages: 1326 - 1337
PubMed: 21955933

History

Received: 27 November 2009
Revision received: 1 December 2010
Revision received: 10 April 2011
Accepted: 11 May 2011
Published online: 1 December 2011
Published in print: December 2011

Authors

Details

Zhishun Wang, Ph.D.
From the Magnetic Resonance Imaging Unit and Division of Child and Adolescent Psychiatry; Columbia University and New York State Psychiatric Institute, New York.
Tiago V. Maia, Ph.D.
From the Magnetic Resonance Imaging Unit and Division of Child and Adolescent Psychiatry; Columbia University and New York State Psychiatric Institute, New York.
Rachel Marsh, Ph.D.
From the Magnetic Resonance Imaging Unit and Division of Child and Adolescent Psychiatry; Columbia University and New York State Psychiatric Institute, New York.
Tiziano Colibazzi, M.D.
From the Magnetic Resonance Imaging Unit and Division of Child and Adolescent Psychiatry; Columbia University and New York State Psychiatric Institute, New York.
Andrew Gerber, M.D., Ph.D.
From the Magnetic Resonance Imaging Unit and Division of Child and Adolescent Psychiatry; Columbia University and New York State Psychiatric Institute, New York.
Bradley S. Peterson, M.D.
From the Magnetic Resonance Imaging Unit and Division of Child and Adolescent Psychiatry; Columbia University and New York State Psychiatric Institute, New York.

Notes

Address correspondence to Dr. Wang ([email protected]).

Funding Information

The authors report no financial relationships with commercial interests.Supported in part by NIMH grant MH-K02-074677; NIMH grants 2T32 MH-16434, MH-36197, and MH-068318; grants from the National Alliance for Research in Schizophrenia and Affective Disorders and the Klingenstein Third Generation Foundation; and a Research Associate Award from the New York State Psychiatric Institute and the Research Foundation for Mental Hygiene.

Metrics & Citations

Metrics

Citations

Export Citations

If you have the appropriate software installed, you can download article citation data to the citation manager of your choice. Simply select your manager software from the list below and click Download.

For more information or tips please see 'Downloading to a citation manager' in the Help menu.

Format
Citation style
Style
Copy to clipboard

View Options

View options

PDF/EPUB

View PDF/EPUB

Get Access

Login options

Already a subscriber? Access your subscription through your login credentials or your institution for full access to this article.

Personal login Institutional Login Open Athens login
Purchase Options

Purchase this article to access the full text.

PPV Articles - American Journal of Psychiatry

PPV Articles - American Journal of Psychiatry

Not a subscriber?

Subscribe Now / Learn More

PsychiatryOnline subscription options offer access to the DSM-5-TR® library, books, journals, CME, and patient resources. This all-in-one virtual library provides psychiatrists and mental health professionals with key resources for diagnosis, treatment, research, and professional development.

Need more help? PsychiatryOnline Customer Service may be reached by emailing [email protected] or by calling 800-368-5777 (in the U.S.) or 703-907-7322 (outside the U.S.).

Media

Figures

Other

Tables

Share

Share

Share article link

Share