Distinct Subcortical Volume Alterations in Pediatric and Adult OCD: A Worldwide Meta- and Mega-Analysis
Abstract
Objective:
Method:
Results:
Conclusions:
Method
Samples
| Study Principal Investigator | Site | Field Strength (teslas) | Age (years) | Control Subjects (N) | OCD Patients (N) | Total (N) | |||||
|---|---|---|---|---|---|---|---|---|---|---|---|
| Control Subjects | OCD Patients | Male (%) | |||||||||
| Mean | SD | Mean | SD | Control Subjects | OCD | ||||||
| Adult samples | |||||||||||
| Benedetti | Milan | 3.0 | 34.0 | 12.3 | 35.0 | 10.4 | 73 | 71 | 62 | 66 | 128 |
| Beucke | Berlin | 1.5 | 31.9 | 9.5 | 32.4 | 9.7 | 49 | 50 | 104 | 92 | 196 |
| Cheng | Kunming I | 1.5 | 31.4 | 8.0 | 30.6 | 10.2 | 33 | 38 | 40 | 24 | 64 |
| Kunming II | 3.0 | 26.2 | 4.2 | 32.9 | 10.6 | 28 | 55 | 95 | 56 | 151 | |
| Denys | Amsterdam | 3.0 | 39.6 | 10.3 | 33.8 | 9.6 | 44 | 21 | 25 | 24 | 49 |
| van den Heuvel | Amsterdam I | 1.5 | 31.6 | 7.7 | 33.5 | 9.2 | 39 | 30 | 49 | 54 | 103 |
| Amsterdam II | 3.0 | 39.6 | 11.4 | 38.3 | 10.1 | 47 | 48 | 38 | 42 | 80 | |
| Hoexter | São Paulo I | 1.5 | 27.6 | 7.8 | 31.5 | 10.1 | 35 | 44 | 37 | 50 | 87 |
| Koch | Munich | 3.0 | 30.2 | 9.0 | 31.1 | 9.7 | 40 | 33 | 75 | 72 | 147 |
| Kwon | Seoul I | 1.5 | 24.0 | 3.6 | 24.8 | 5.4 | 56 | 76 | 104 | 45 | 149 |
| Seoul II | 1.5 | 24.9 | 5.3 | 28.8 | 6.8 | 64 | 56 | 45 | 34 | 79 | |
| Seoul III | 3.0 | 26.3 | 6.9 | 26.3 | 6.8 | 61 | 61 | 89 | 90 | 179 | |
| Mataix-Cols | Stockholm | 1.5 | 36.1 | 11.3 | 38.7 | 10.9 | 36 | 43 | 33 | 44 | 77 |
| Menchon | Barcelona | 1.5 | 33.1 | 10.2 | 34.8 | 9.2 | 45 | 50 | 66 | 117 | 183 |
| Nakamae | Kyoto I | 1.5 | 30.3 | 7.8 | 31.7 | 9.3 | 52 | 49 | 48 | 82 | 130 |
| Kyoto II | 3.0 | 30.0 | 7.4 | 33.3 | 9.7 | 48 | 35 | 42 | 34 | 76 | |
| Nakao | Fukuoka | 3.0 | 39.3 | 13.0 | 36.6 | 10.0 | 39 | 42 | 41 | 81 | 122 |
| Reddy | Bangalore I | 1.5 | 27.2 | 6.4 | 27.5 | 6.3 | 74 | 59 | 46 | 44 | 90 |
| Bangalore II | 3.0 | 26.3 | 5.0 | 29.6 | 8.0 | 62 | 52 | 156 | 208 | 364 | |
| Simpson | New York | 3.0 | 28.3 | 8.0 | 29.6 | 8.0 | 52 | 52 | 33 | 33 | 66 |
| Spalletta | Rome | 3.0 | 36.5 | 10.5 | 36.7 | 11.6 | 59 | 67 | 128 | 84 | 212 |
| Stein | Cape Town | 3.0 | 30.6 | 10.8 | 30.7 | 10.8 | 38 | 50 | 29 | 22 | 51 |
| Tolin | Connecticut | 3.0 | 48.0 | 11.9 | 32.1 | 12.0 | 22 | 67 | 32 | 27 | 59 |
| Walitza | Zurich I | 3.0 | 32.9 | 9.2 | 31.2 | 7.7 | 28 | 47 | 18 | 17 | 35 |
| Wang | Shanghai | 3.0 | 26.2 | 7.5 | 29.6 | 9.3 | 54 | 57 | 37 | 53 | 90 |
| Total, adult samples | 1,472 | 1,495 | 2,967 | ||||||||
| Pediatric samples | |||||||||||
| Arnold | Ontario | 3.0 | 12.3 | 2.2 | 12.9 | 2.4 | 54 | 58 | 13 | 40 | 53 |
| Fitzgerald | Michigan | 3.0 | 12.9 | 2.9 | 13.9 | 2.6 | 52 | 49 | 67 | 74 | 141 |
| Gruner | Connecticut | 3.0 | 14.2 | 2.2 | 14.3 | 2.1 | 52 | 57 | 23 | 23 | 46 |
| Hoexter | São Paulo II | 3.0 | 12.0 | 2.4 | 12.6 | 2.5 | 57 | 61 | 28 | 28 | 56 |
| Huyser | Amsterdam | 3.0 | 13.3 | 2.5 | 13.6 | 2.5 | 36 | 37 | 25 | 27 | 52 |
| Lazaro | Barcelona I | 1.5 | 14.6 | 2.3 | 14.6 | 2.0 | 47 | 58 | 32 | 31 | 63 |
| Barcelona II | 3.0 | 14.6 | 2.1 | 14.6 | 2.0 | 55 | 60 | 44 | 58 | 102 | |
| Reddy | Bangalore III | 3.0 | 13.1 | 2.1 | 14.6 | 2.0 | 50 | 56 | 14 | 18 | 32 |
| Soreni | Ontario | 3.0 | 11.2 | 3.1 | 13.4 | 2.5 | 52 | 40 | 21 | 20 | 41 |
| Walitza | Zurich II | 3.0 | 14.6 | 1.3 | 15.7 | 1.4 | 50 | 81 | 20 | 16 | 36 |
| Total, pediatric samples | 287 | 335 | 622 | ||||||||
| Total, adult and pediatric samples | 1,759 | 1,830 | 3,589 | ||||||||
| Study Principal Investigator | Site | Medicated (%) | YBOCSa Score | Age at Onset (years) | Lifetime Comorbid Disorders | |||
|---|---|---|---|---|---|---|---|---|
| Mean | SD | Mean | SD | Anxiety (%) | Depression (%) | |||
| Adult samples | ||||||||
| Benedetti | Milan | 64 | 30.9 | 5.6 | 16.0 | 6.1 | 1.5 | 10.6 |
| Beucke | Berlin | 40 | 20.1 | 7.1 | 17.2 | 7.8 | 12.0 | 18.5 |
| Cheng | Kunming I | 71 | 31.0 | 6.1 | 26.8 | 10.4 | 50.0 | 16.7 |
| Kunming II | 68 | 28.2 | 6.3 | 27.2 | 10.7 | 89.3 | 28.6 | |
| Denys | Amsterdam | 63 | 26.6 | 6.2 | 18.1 | 6.9 | 4.2 | 41.7 |
| van den Heuvel | Amsterdam I | 0 | 22.7 | 6.1 | 14.4 | 7.7 | 22.2 | 33.3 |
| Amsterdam II | 0 | 21.5 | 6.1 | 15.5 | 6.9 | 40.5 | 52.4 | |
| Hoexter | São Paulo I | 20 | 27.2 | 6.1 | 13.1 | 7.0 | 62.0 | 54.0 |
| Koch | Munich | 60 | 20.9 | 6.2 | 17.0 | 6.7 | — | — |
| Kwon | Seoul I | 24 | 20.2 | 6.0 | 17.4 | 5.2 | 0.0 | 0.0 |
| Seoul II | 0 | 23.9 | 6.5 | 18.9 | 6.6 | 0.0 | 2.9 | |
| Seoul III | 2 | 26.5 | 6.5 | 19.0 | 6.4 | 1.1 | 2.2 | |
| Mataix-Cols | Stockholm | 41 | 25.9 | 7.7 | 18.4 | 9.2 | 27.3 | 34.1 |
| Menchon | Barcelona | 97 | 25.5 | 5.8 | 21.4 | 8.5 | 20.5 | 18.8 |
| Nakamae | Kyoto I | 49 | 25.2 | 6.4 | 25.1 | 9.4 | 9.8 | 22.0 |
| Kyoto II | 0 | 22.4 | 6.9 | 25.2 | 9.1 | 8.8 | 20.6 | |
| Nakao | Fukuoka | 88 | 22.5 | 5.6 | 24.6 | 9.5 | — | 35.8 |
| Reddy | Bangalore I | 0 | 25.8 | 7.3 | 21.7 | 7.5 | 15.9 | 18.2 |
| Bangalore II | 40 | 25.8 | 6.3 | 22.0 | 7.6 | 7.7 | 15.4 | |
| Simpson | New York | 0 | 25.5 | 3.7 | 15.0 | 7.0 | 21.2 | 30.3 |
| Spalletta | Rome | 88 | 23.4 | 8.9 | 18.9 | 10.9 | 9.5 | 9.5 |
| Stein | Cape Town | 41 | 22.9 | 4.2 | 13.6 | 6.6 | 0.0 | 0.0 |
| Tolin | Connecticut | 78 | 22.7 | 4.8 | — | — | 44.4 | 40.7 |
| Walitza | Zurich I | 59 | 17.1 | 9.9 | 16.7 | 7.8 | 47.1 | 47.1 |
| Wang | Shanghai | 0 | 25.5 | 5.1 | 23.3 | 10.3 | 0.0 | 0.0 |
| Pediatric samples | ||||||||
| Arnold | Ontario | 53 | 20.9 | 7.8 | 8.7 | 2.6 | 25.0 | 17.5 |
| Fitzgerald | Michigan | 50 | 18.7 | 7.8 | 9.9 | 3.0 | 50.0 | 6.8 |
| Gruner | Connecticut | 52 | 26.9 | 4.5 | — | — | 43.5 | 39.1 |
| Hoexter | São Paulo II | 46 | 26.9 | 5.4 | 7.2 | 3.0 | 21.4 | 0.0 |
| Huyser | Amsterdam | 0 | 25.1 | 5.0 | 10.9 | 2.8 | 48.2 | 25.9 |
| Lazaro | Barcelona I | 55 | 22.2 | 6.0 | 12.4 | 2.2 | 16.1 | 3.2 |
| Barcelona II | 79 | 18.6 | 7.4 | 12.0 | 2.4 | 25.9 | 5.2 | |
| Reddy | Bangalore III | 83 | 22.6 | 7.3 | 13.1 | 2.1 | 22.2 | 5.6 |
| Soreni | Ontario | 0 | 22.8 | 4.3 | — | — | — | — |
| Walitza | Zurich II | 56 | 14.7 | 1.0 | 11.1 | 2.2 | 50.0 | 6.3 |
Image Acquisition and Processing
Meta-Analysis of Subcortical Brain Volumes
Moderator Analyses
Power Analysis
Mega-Analysis of Subcortical Brain Volumes
Results
Meta-Analysis
OCD patients versus healthy controls.
Adult comparison:

| Structure | Adjusted Cohen’s da | SE | 95% CI | % Difference | p | I2 | Control Subjects (N) | OCD Patients (N) |
|---|---|---|---|---|---|---|---|---|
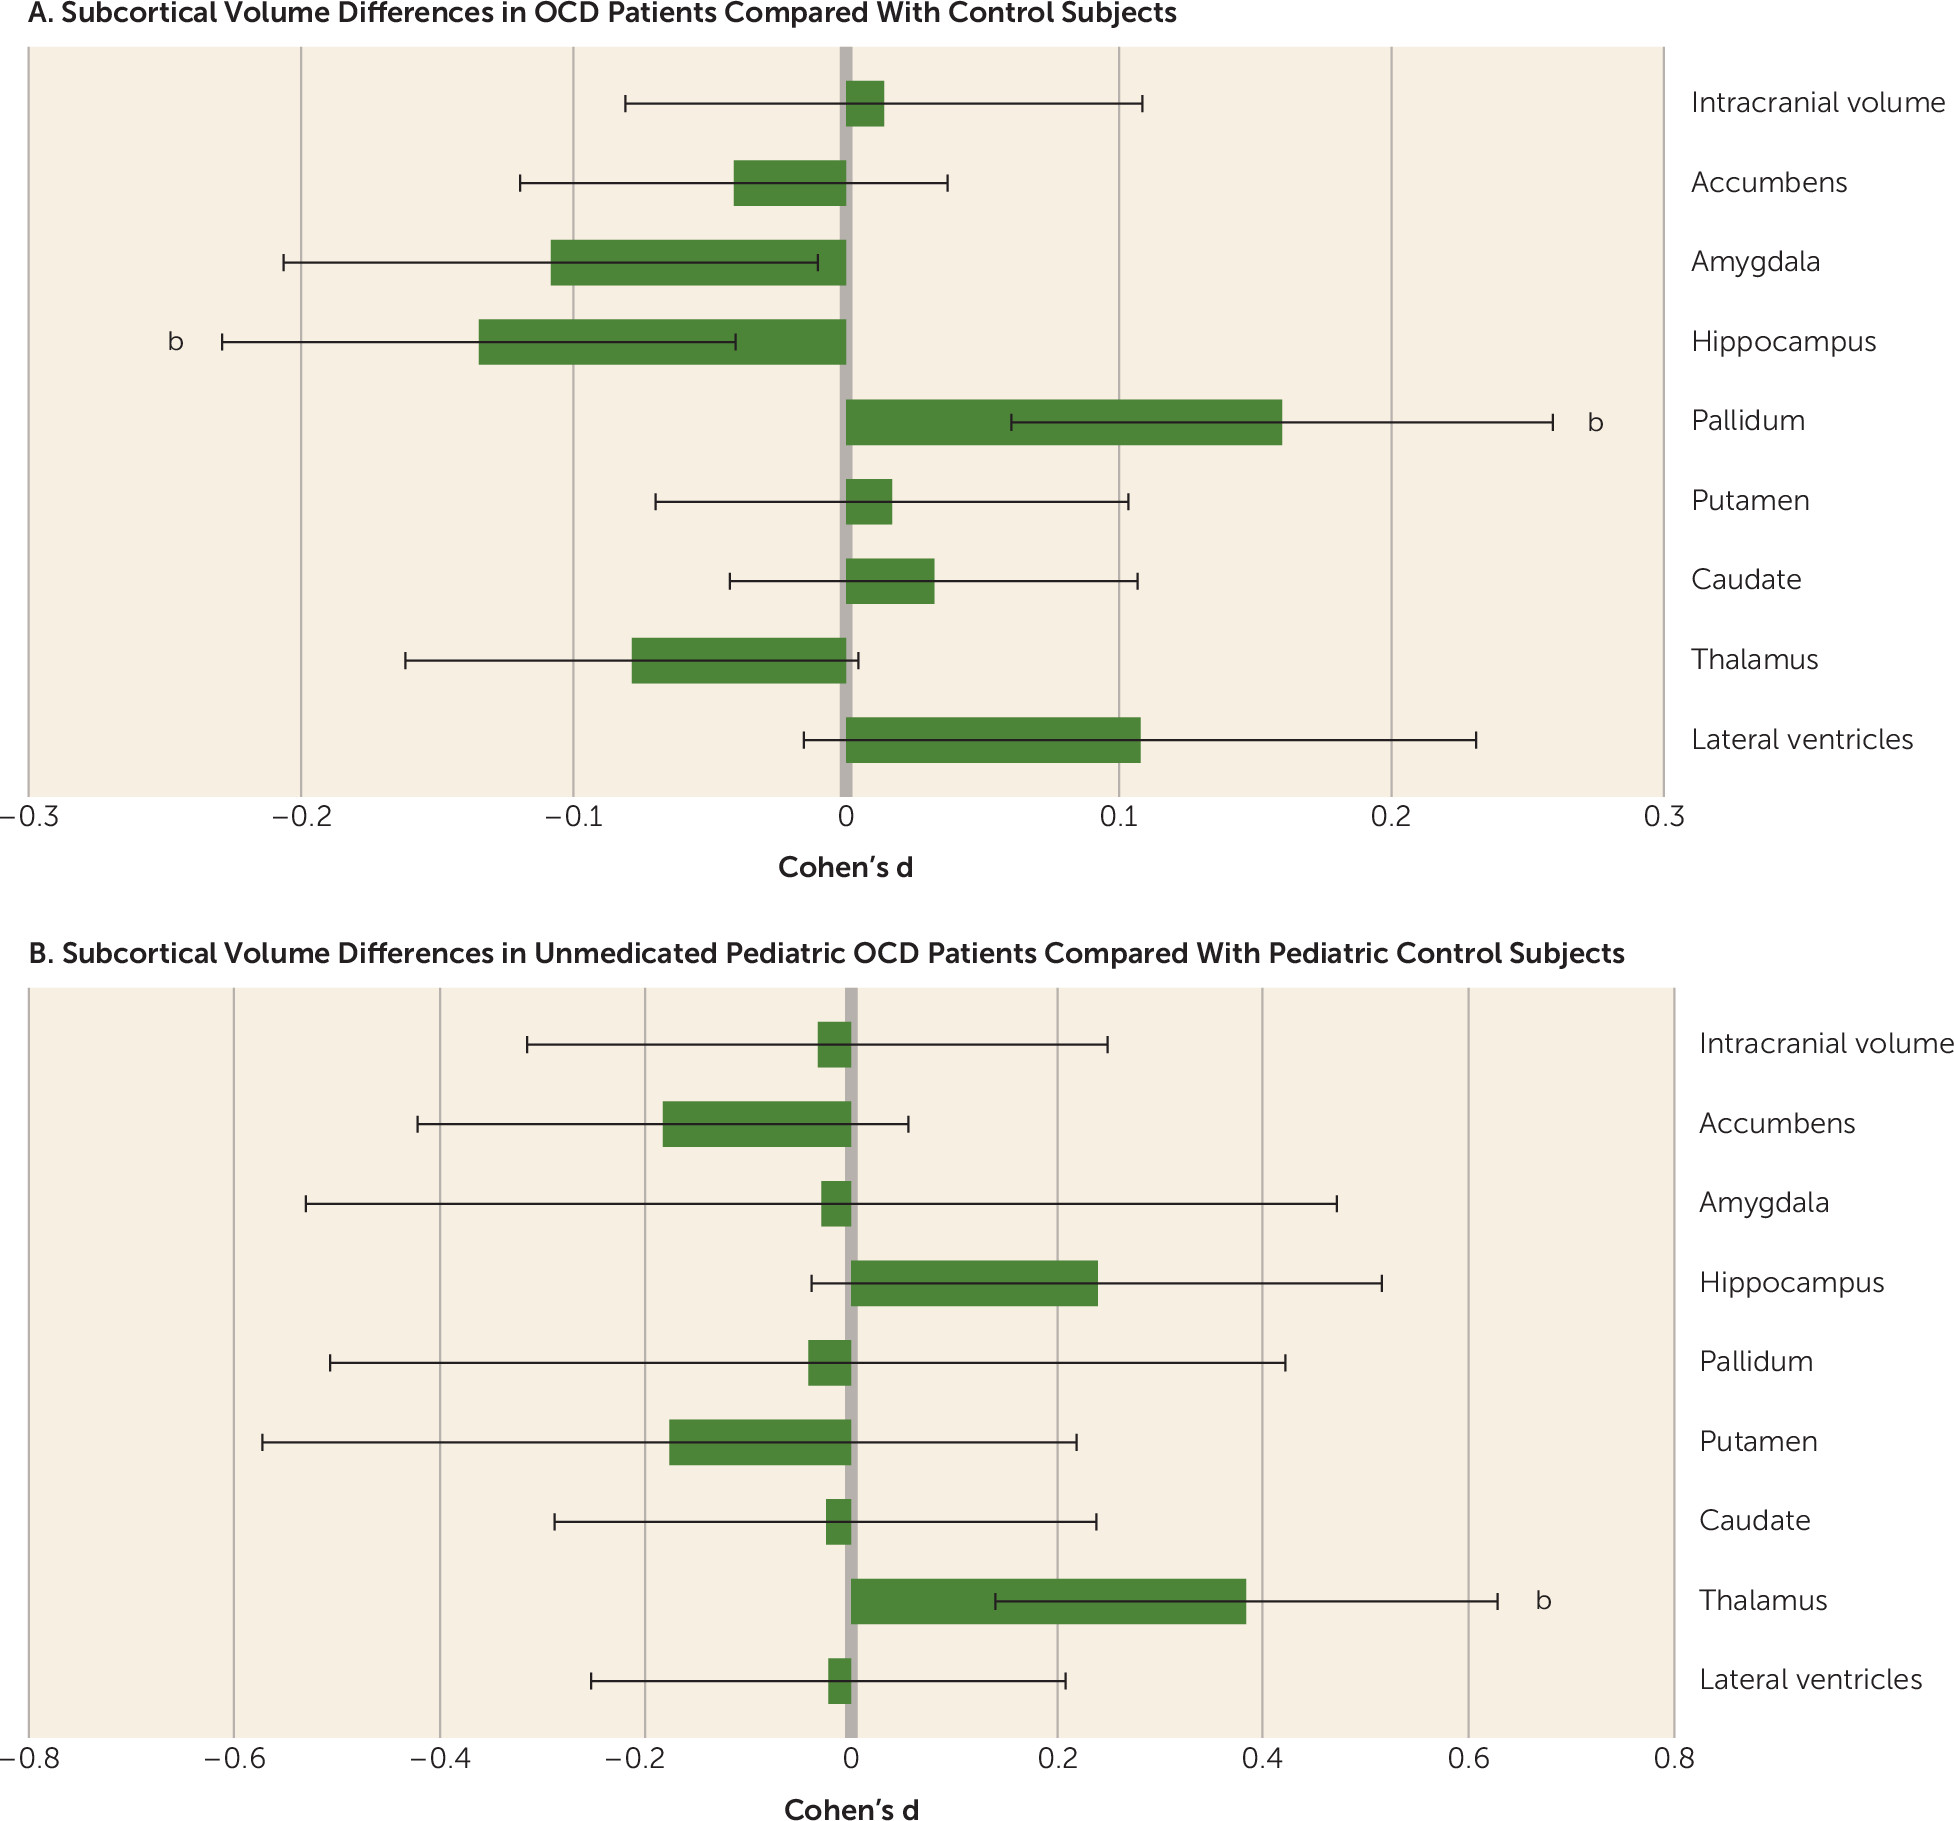
| Lateral ventricles | 0.108 | 0.063 | –0.016, 0.231 | 1.712 | 0.087 | 61.327 | 1,466 | 1,491 |
| Thalamus | –0.079 | 0.042 | –0.162, 0.005 | –1.851 | 0.064 | 12.542 | 1,387 | 1,375 |
| Caudate | 0.032 | 0.038 | –0.043, 0.107 | 0.844 | 0.399 | 0.003 | 1,424 | 1,441 |
| Putamen | 0.017 | 0.044 | –0.070, 0.103 | 0.380 | 0.704 | 16.141 | 1,335 | 1,365 |
| Pallidum | 0.160 | 0.051 | 0.061, 0.259 | 3.156 | 1.60×10⁻³ | 32.877 | 1,312 | 1,336 |
| Hippocampus | –0.135 | 0.048 | –0.229, –0.040 | –2.802 | 5.08×10⁻³ | 32.692 | 1,440 | 1,444 |
| Amygdala | –0.108 | 0.050 | –0.206, –0.010 | –2.163 | 0.031 | 37.194 | 1,418 | 1,452 |
| Accumbens | –0.041 | 0.040 | –0.120, 0.037 | –1.025 | 0.305 | 8.384 | 1,446 | 1,465 |
| Intracranial volume | 0.014b | 0.048 | –0.081, 0.109 | 0.286 | 0.775 | 35.547 | 1,470 | 1,493 |
Pediatric comparison:
Influence of medication on subcortical volume.
Adult comparisons:
Pediatric comparisons:
| Structure | Adjusted Cohen’s da | SE | 95% CI | % Difference | p | I2 | Control Subjects (N) | OCD Patients (N) |
|---|---|---|---|---|---|---|---|---|
| Lateral ventricles | –0.022 | 0.118 | –0.253, 0.209 | –0.189 | 0.850 | 0.000 | 216 | 115 |
| Thalamus | 0.384 | 0.125 | 0.139, 0.628 | 3.078 | 2.09×10⁻³ | 0.000 | 201 | 103 |
| Caudate | –0.024 | 0.134 | –0.288, 0.239 | –0.182 | 0.855 | 14.641 | 198 | 109 |
| Putamen | –0.177 | 0.202 | –0.572, 0.219 | –0.875 | 0.382 | 59.152 | 204 | 104 |
| Pallidum | –0.042 | 0.237 | –0.506, 0.423 | –0.176 | 0.860 | 66.561 | 174 | 87 |
| Hippocampus | 0.239 | 0.141 | –0.038, 0.516 | 1.688 | 0.091 | 22.715 | 210 | 107 |
| Amygdala | –0.029 | 0.256 | –0.530, 0.473 | –0.112 | 0.911 | 72.254 | 188 | 89 |
| Accumbens | –0.183 | 0.122 | –0.422, 0.056 | –1.500 | 0.134 | 0.004 | 203 | 111 |
| Intracranial volume | –0.033b | 0.144 | –0.314, 0.249 | –0.226 | 0.821 | 29.531 | 219 | 116 |
Influence of comorbid major depression on subcortical volume in adult OCD.
Adult comparisons:
Pediatric comparisons:
Influence of a comorbid anxiety disorder on subcortical volume.
Adult comparisons:
Pediatric comparisons:
Influence of symptom dimensions on subcortical volume.
Adult comparisons:
Pediatric comparisons:
Influence of age at onset and illness duration on subcortical volume.
Association of illness severity with subcortical volumes.
Moderator analyses.
Mega-Analysis
Adult OCD.
Pediatric OCD.
Discussion
Acknowledgments
Footnotes
Supplementary Material
- View/Download
- 873.10 KB
- Download
- 40.47 KB
References
Information & Authors
Information
Published In
History
Keywords
Authors
Details
Notes
Funding Information
Metrics & Citations
Metrics
Citations
Export Citations
If you have the appropriate software installed, you can download article citation data to the citation manager of your choice. Simply select your manager software from the list below and click Download.
For more information or tips please see 'Downloading to a citation manager' in the Help menu.
View Options
View options
PDF/EPUB
View PDF/EPUBLogin options
Already a subscriber? Access your subscription through your login credentials or your institution for full access to this article.
Personal login Institutional Login Open Athens loginPurchase Options
Purchase this article to access the full text.
PPV Articles - American Journal of Psychiatry
Not a subscriber?
PsychiatryOnline subscription options offer access to the DSM-5-TR® library, books, journals, CME, and patient resources. This all-in-one virtual library provides psychiatrists and mental health professionals with key resources for diagnosis, treatment, research, and professional development.
Need more help? PsychiatryOnline Customer Service may be reached by emailing [email protected] or by calling 800-368-5777 (in the U.S.) or 703-907-7322 (outside the U.S.).

