Full access
Articles
Published Online: 24 March 2017

Functional Connectivity of the Subcallosal Cingulate Cortex And Differential Outcomes to Treatment With Cognitive-Behavioral Therapy or Antidepressant Medication for Major Depressive Disorder

This article has been corrected.
VIEW CORRECTION

Abstract

Objective:

The purpose of this article was to inform the first-line treatment choice between cognitive-behavioral therapy (CBT) or an antidepressant medication for treatment-naive adults with major depressive disorder by defining a neuroimaging biomarker that differentially identifies the outcomes of remission and treatment failure to these interventions.

Method:

Functional MRI resting-state functional connectivity analyses using a bilateral subcallosal cingulate cortex (SCC) seed was applied to 122 patients from the Prediction of Remission to Individual and Combined Treatments (PReDICT) study who completed 12 weeks of randomized treatment with CBT or antidepressant medication. Of the 122 participants, 58 achieved remission (Hamilton Depression Rating Scale [HAM-D] score ≤7 at weeks 10 and 12), and 24 had treatment failure (<30% decrease from baseline in HAM-D score). A 2×2 analysis of variance using voxel-wise subsampling permutation tests compared the interaction of treatment and outcome. Receiver operating characteristic curves constructed using brain connectivity measures were used to determine possible classification rates for differential treatment outcomes.

Results:

The resting-state functional connectivity of the following three regions with the SCC was differentially associated with outcomes of remission and treatment failure to CBT and antidepressant medication and survived application of the subsample permutation tests: the left anterior ventrolateral prefrontal cortex/insula, the dorsal midbrain, and the left ventromedial prefrontal cortex. Using the summed SCC functional connectivity scores for these three regions, overall classification rates of 72%−78% for remission and 75%−89% for treatment failure was demonstrated. Positive summed functional connectivity was associated with remission with CBT and treatment failure with medication, whereas negative summed functional connectivity scores were associated with remission to medication and treatment failure with CBT.

Conclusions:

Imaging-based depression subtypes defined using resting-state functional connectivity differentially identified an individual’s probability of remission or treatment failure with first-line treatment options for major depression. This biomarker should be explored in future research through prospective testing and as a component of multivariate treatment prediction models.
The syndrome of major depressive disorder, a highly heterogeneous clinical condition, has largely defied meaningful subtyping (1). First-line treatments for major depression include an evidence-based psychotherapy, such as cognitive-behavioral therapy (CBT), or antidepressant medication (2). Both treatments have roughly equivalent efficacy, on average, for outpatients with major depression, though the remission rates of 30%−40% with either treatment alone are low (2). Combination treatment with psychotherapy and antidepressant medication improves remission rates, but barriers such as cost, time, and patient preference preclude this option for many patients (3). Importantly, some patients who do not respond to one treatment intervention exhibit an excellent response when switched to the alternative (4, 5). This observation strongly suggests that biological or psychological variability may be identified and, thereby, improve the precision of treatment selection for individual depressed patients (6).
Despite extensive efforts, work to identify clinical predictors of outcomes to treatments in nonpsychotic major depression has been disappointing. Depressive symptom severity has received the most attention among the clinical predictors, but the largest patient-level meta-analyses found no difference in outcome among patients treated with CBT or antidepressant medication based on severity (7) or depressive clinical subtype (8). The consistent failure of clinical features meaningfully to inform treatment selection serves as an impetus to identify biomarkers predictive of treatment outcomes (9, 10). Unfortunately, genetic testing, neuroimaging, and psychophysiological approaches, although promising, have not yet proven sufficiently accurate or replicable to warrant clinical application to individual patients (11).
Neuroimaging using positron emission tomography (PET) or functional MRI (fMRI) has been used extensively to characterize brain states of depressed patients. Among patients with major depression compared with healthy control subjects, relative hyperactivity of limbic brain regions, including the amygdala, insula, and subcallosal cingulate cortex (SCC), is consistently reported; hypoactivity in the dorsolateral prefrontal cortex is another replicated finding (12). However, average differences between groups may mask important heterogeneity between individuals (13), with some patients not showing these changes, or even demonstrating opposite patterns (e.g., increased metabolism in the dorsolateral prefrontal cortex) (14). This variability in brain states across patients likely has important implications for treatment responsiveness.
Recent reviews have found inconsistent results for potential neuroimaging predictors of treatment outcomes in major depression (15, 16). Many factors contribute to this inconsistency, including differences in imaging modality and analytic approaches, patient sample characteristics, treatment type and duration, and treatment outcome definitions (11). Most studies of neuroimaging moderators of outcome have employed a single type of treatment, with testing for baseline imaging differences between patients who did and did not respond to the intervention.
Several studies have reported that fMRI activity patterns can predict outcomes to CBT (1719). In contrast, studies using medication treatments have identified different patterns of neural activity and connectivity associated with acute treatment outcomes (2023). These findings suggest that brain states may differ between patients benefiting from one treatment modality compared with an alternative. Without an active comparison treatment group, however, these studies could not conclude whether the identified imaging biomarkers moderated outcomes specifically for the treatment studied, or simply predicted outcomes across all potential treatments (i.e., a nonspecific predictor). Consequently, extant biomarker studies employing single forms of treatment can inform response signatures, but they are unable to achieve the precision medicine goal of selecting the optimal type of treatment for a given individual.
Optimal application of precision medicine in depression should involve the prediction of both the desired outcome (remission) and the most undesired outcome (treatment failure). Remission is the goal of treatment because long-term wellness and overall functioning are greater among patients who fully remit from treatment compared with those who respond to a lesser degree or show no response (2). However, avoiding treatment failure is also a vitally important outcome (24). Because treatment efficacy can only be known after 6–12 weeks of treatment, application of an ineffective treatment prolongs patient suffering and role dysfunction, potentially increasing feelings of hopelessness and interpersonal strife, with persistence of suicidal ideation. These severe consequences from choosing the “wrong” treatment for a patient underscore the need for biomarkers predictive of both remission and treatment failure (25). Furthermore, because combination treatment with both psychotherapy and medication for major depression is often not required or not feasible, selection of the initial treatment is typically a forced choice between psychotherapy and medication (5). An optimal biomarker could identify whether failure to improve with one treatment modality could simultaneously predict improvement with the alternative modality.
Recently, resting-state metabolic activity assessed by [18F]-fluorodeoxyglucose (FDG) PET found six brain regions that were differentially associated with the outcomes of remission and treatment failure among major depression patients randomly assigned to treatment with CBT or escitalopram. Metabolic activity in the right anterior insula emerged as the best candidate for use as a treatment selection biomarker (26), with support provided by the finding that, among nonremitters to monotherapy, the same biomarker predicted eventual remission after addition of the alternative treatment (27). Due to the cost and radiation exposure involved in PET imaging, more readily available and less expensive fMRI methods have appeal as an alternative approach for assessing regional brain activity. Resting-state functional connectivity is an fMRI technique that measures the degree to which separate brain regions demonstrate temporal correlations in the low-frequency components of the blood-oxygen-level dependent signal. The resting-state functional connectivity signal has identified brain networks involved in several aspects of mental functioning in healthy subjects, and resting-state functional connectivity in these networks differed between healthy control subjects and major depression patients in several studies (28).
Of the many important frontal and limbic regions identified using fMRI studies of major depression, activity in the SCC has consistently emerged as a core component of major depression pathophysiology (29). The SCC is an extensively connected component of the limbic system that modulates emotional behavior and is particularly involved in feelings of sadness (30, 31). Greater functional connectivity between the SCC and the default mode network is present in patients with treatment-resistant depression (32). Elevated pretreatment SCC metabolism has been associated with poorer outcomes to treatment with antidepressant medication (3335), CBT (17, 35), and the combination of antidepressant medication and CBT (36). Finally, deep brain stimulation to the SCC and its cortical and subcortical connections may be efficacious in patients with highly treatment-resistant depression (37, 38).
The aim of the present study was to identify resting-state functional connectivity differential predictors of outcomes among adults with treatment-naive major depression randomly assigned to receive 12 weeks of treatment with either CBT or an antidepressant medication. Based on prior work (26, 27, 36), we hypothesized that pretreatment levels of SCC resting-state functional connectivity to other cortical and limbic regions would differentially predict the clinical outcomes of the CBT and antidepressant medication treatments. To minimize any dilution of the biomarker signal by patients with ambiguous outcomes, we made the a priori decision to analyze the imaging data using the clearly defined outcomes of remission and treatment failure (defined as <30% improvement from baseline), in the same manner as our previous work using PET imaging in depressed patients (26).

Method

Studies

The design of the Emory Predictors of Remission in Depression to Individual and Combined Treatments (PReDICT) study has been published previously (39), and the clinical results of the trial are presented elsewhere (10). The overarching goal of PReDICT was to identify clinical and biological moderators of outcomes to CBT and antidepressant medication. The study was conducted through the Mood and Anxiety Disorders Program at Emory University, including a purely Spanish-language location at Grady Hospital. The Emory Institutional Review Board and the Grady Hospital Research Oversight Committee approved the study. All patients provided written, informed consent prior to beginning study procedures.

Patients

Adults aged 18–65 years were eligible to participate if they met DSM-IV criteria for a primary current diagnosis of nonpsychotic major depression as assessed by the Structured Clinical Interview for DSM-IV (40) and a psychiatrist’s evaluation, and if they scored ≥18 on the 17-item Hamilton Depression Rating Scale (HAM-D) (41). Additionally, patients were required to be treatment naive, defined as having never previously received a minimally adequate course of treatment with an antidepressant medication or evidence-based psychotherapy for a mood disorder. Exclusion criteria included a lifetime history of bipolar disorder, primary psychotic disorder, or dementia, or meeting DSM-IV criteria for any of the following in the past 12 months: obsessive compulsive disorder, eating disorder, substance dependence (except for nicotine and caffeine), or dissociative disorder. Meeting DSM-IV criteria for substance abuse within the past 3 months or a positive urine test for drugs of abuse at the screening visit were also exclusionary. Pregnant or breast-feeding women and patients with a medical condition that could interfere with the study or the interpretation of the study results were excluded.

Randomization and Treatment

Patients scoring ≥15 on the HAM-D at the baseline visit were randomly assigned 1:1:1 to 12 weeks of treatment with one of three treatments: 1) a selective serotonin reuptake inhibitor (SSRI), escitalopram, 10–20 mg/day; 2) a serotonin norepinephrine reuptake inhibitor (SNRI), duloxetine, 30–60 mg/day; or 3) CBT, 16 individual 50-minute sessions. The medications were dispensed in a double-blind manner in compounded purple capsules and were dosed flexibly based on patient tolerability and response. CBT was delivered in accordance with Beck and colleagues’ manual (42). Symptom severity using the HAM-D, Hamilton Anxiety Rating Scale (43), and Beck Depression Inventory (44) was assessed weekly by blinded raters for the first 6 weeks after randomization and then every other week until week 12. In addition, the Childhood Trauma Questionnaire (45) was completed prior to randomization. Patients were not permitted to use benzodiazepines, antipsychotics, anxiolytics, chronic opiates, or any other psychoactive medication, with the exception of hypnotics up to three times per week, though not on the night before MRI scans or ratings assessments. The PReDICT study also included a second treatment phase for nonremitters. Patients who did not remit after 12 weeks with single modality treatment were offered combination treatment for 12 additional weeks, in which CBT was added to medication nonremitters and escitalopram was added to CBT nonremitters (39).

Clinical Outcomes

Remission was defined as a HAM-D score ≤7 at both weeks 10 and 12. Treatment failure was defined as <30% reduction from the baseline HAM-D score at week 12 (26). Response without remission was defined as nonremitters with a week-12 HAM-D score ≥50% reduction from baseline, and partial response was defined as a week-12 HAM-D score with 30%−49% reduction from baseline.

MRI Data Acquisition and Preprocessing

After screening and during the week prior to randomization, resting-state fMRI scanning was performed with patients’ eyes open for 7.4 minutes in a 3-T Siemens TIM Trio (Siemens Medical Systems, Erlangen, Germany). The anatomical data were acquired using Siemens’ magnetization-prepared rapid acquisition gradient-echo sequence (repetition time/inversion time/echo time=2,600 ms/900 ms/3.02 ms; flip angle=8°, voxel resolution=1×1×1 mm; number of slices=176; matrix=224×256). Resting-state fMRI data were acquired using a Z-SAGA sequence (46) to recover areas affected by susceptibility artifact, with the following parameters: 150 measurements; 30 axial slices; voxel resolution=3.4×3.4×4 mm; matrix=64×64, repetition time/echo time=2,950 ms/30 ms. Echo planar images were corrected for motion and slice-time acquisition and smoothed using an isotropic Gaussian kernel of 8 mm full width at half maximum. Scans with head motion >2 mm in any direction were removed from the analysis. Mean head motion of included subjects, assessed by framewise displacement (47), did not significantly differ between the treatment outcome groups. Scans were corrected for motion with rigid body registration to the first volume using the AFNI [Analysis of Functional NeuroImages] 3dvolreg (48). Motion parameters, eroded white matter, and cerebral spinal fluid nuisance regressors were removed, and the data were simultaneously band pass filtered at 0.01 Hz–0.1 Hz. In scans meeting these criteria the imaging anatomical and functional data sets were coregistered (with visual confirmation) and normalized to standard Montreal Neurological Institute (MNI) 1-mm voxel space.

Functional Connectivity Analysis

Image analysis was conducted using AFNI (48). A region of interest seed-based approach was used to assess the resting-state functional connectivity of the SCC. The SCC volume was defined using the Harvard-Oxford Atlas (49), and the SCC was thresholded at 50% probability centered on MNI coordinates ±6, 24, –11, consistent with seeds used in our other studies of SCC (38, 50). The seeds comprised two 5-mm radius spheres, with a final volume of 485 µL each. Utilizing 3dNetCorr (51), the mean time course of the bilateral seed was correlated voxel-wise with the rest of the brain. The voxel-wise correlation coefficients were then z-scored by calculating the inverse hyperbolic tangent yielding the seed-based resting-state functional connectivity maps for analysis.

Group Analysis

Because a specific response effect was targeted (i.e., one that would allow choice between treatments), intermediate responders (i.e., those with a change in HAM-D score ≥30% but not achieving remission) were not included in the voxel-level analysis. More specifically, the extremes of the response distribution were used to screen for a particular pattern of interaction (remission to one treatment but treatment failure with the other) at the voxel level (26). Using all completers within each treatment group, the results were then verified by comparing the correlation between the percent change in HAM-D score from baseline to week 12 and the functional connectivity of the three regions identified from the voxel-level analysis. The rationale for combining the medication arms was supported by the results of an ex-vivo assay, which found that both medications blocked between 60% and 70% of the serotonin transporters in the PReDICT patients (52); this indicated that the medications shared a primary mechanism of action. In addition, the separate contrasts between escitalopram compared with CBT and duloxetine compared with CBT identified the same regions as the combined medication compared with CBT contrast (see the Results section). Contrasts were performed using a whole-brain voxel-wise 2×2 analysis of variance (ANOVA) (3dMVM) (53) with treatment (medication or CBT) and 12-week outcomes (remission or treatment failure). This approach generated four comparisons of interest for determining the predictive value of each SCC functional connectivity brain region: remission compared with treatment failure within each treatment (medication or CBT) and the medication compared with CBT treatments within each outcome group (remission or treatment failure). In order to calculate the effect sizes of the group differences (54), post hoc evaluations of each region functionally connected to the SCC identified from the ANOVA were conducted; this allowed evaluation of the potential value of each region as a biomarker of treatment outcomes. To avoid excluding small regions with potentially relevant functional connectivity to the SCC, all identified clusters exceeding a minimum threshold of 300 voxels were evaluated.
To evaluate the robustness of the ANOVA results and reduce the impact of outliers, whole-brain voxel-wise subsampling permutation tests were run with 70% random subsamples. To keep the relative number of patients in each group the same, group assignments of each subsample were proportional to the full cohort groups. The voxel-wise ANOVA was repeated 1,000 times with the 70% subsamples. The resulting F-maps for each ANOVA utilized an alpha threshold of p<0.005, and a beta of 0.80 was selected to retain voxels with at least 80% power. As discussed in the Results section, this analysis identified three brain regions with significant resting-state functional connectivity with the SCC. Subsequently, regions were extracted for each subject and used for post hoc evaluation of the possible predictive validity of the imaging markers. Because the three regions were highly correlated, we also tested the internal predictive value of the summed connectivity score biomarker, calculated by adding the individual SCC resting-state functional connectivity z-scores for each of the three identified regions identified from the ANOVA results shown in Figure 1.
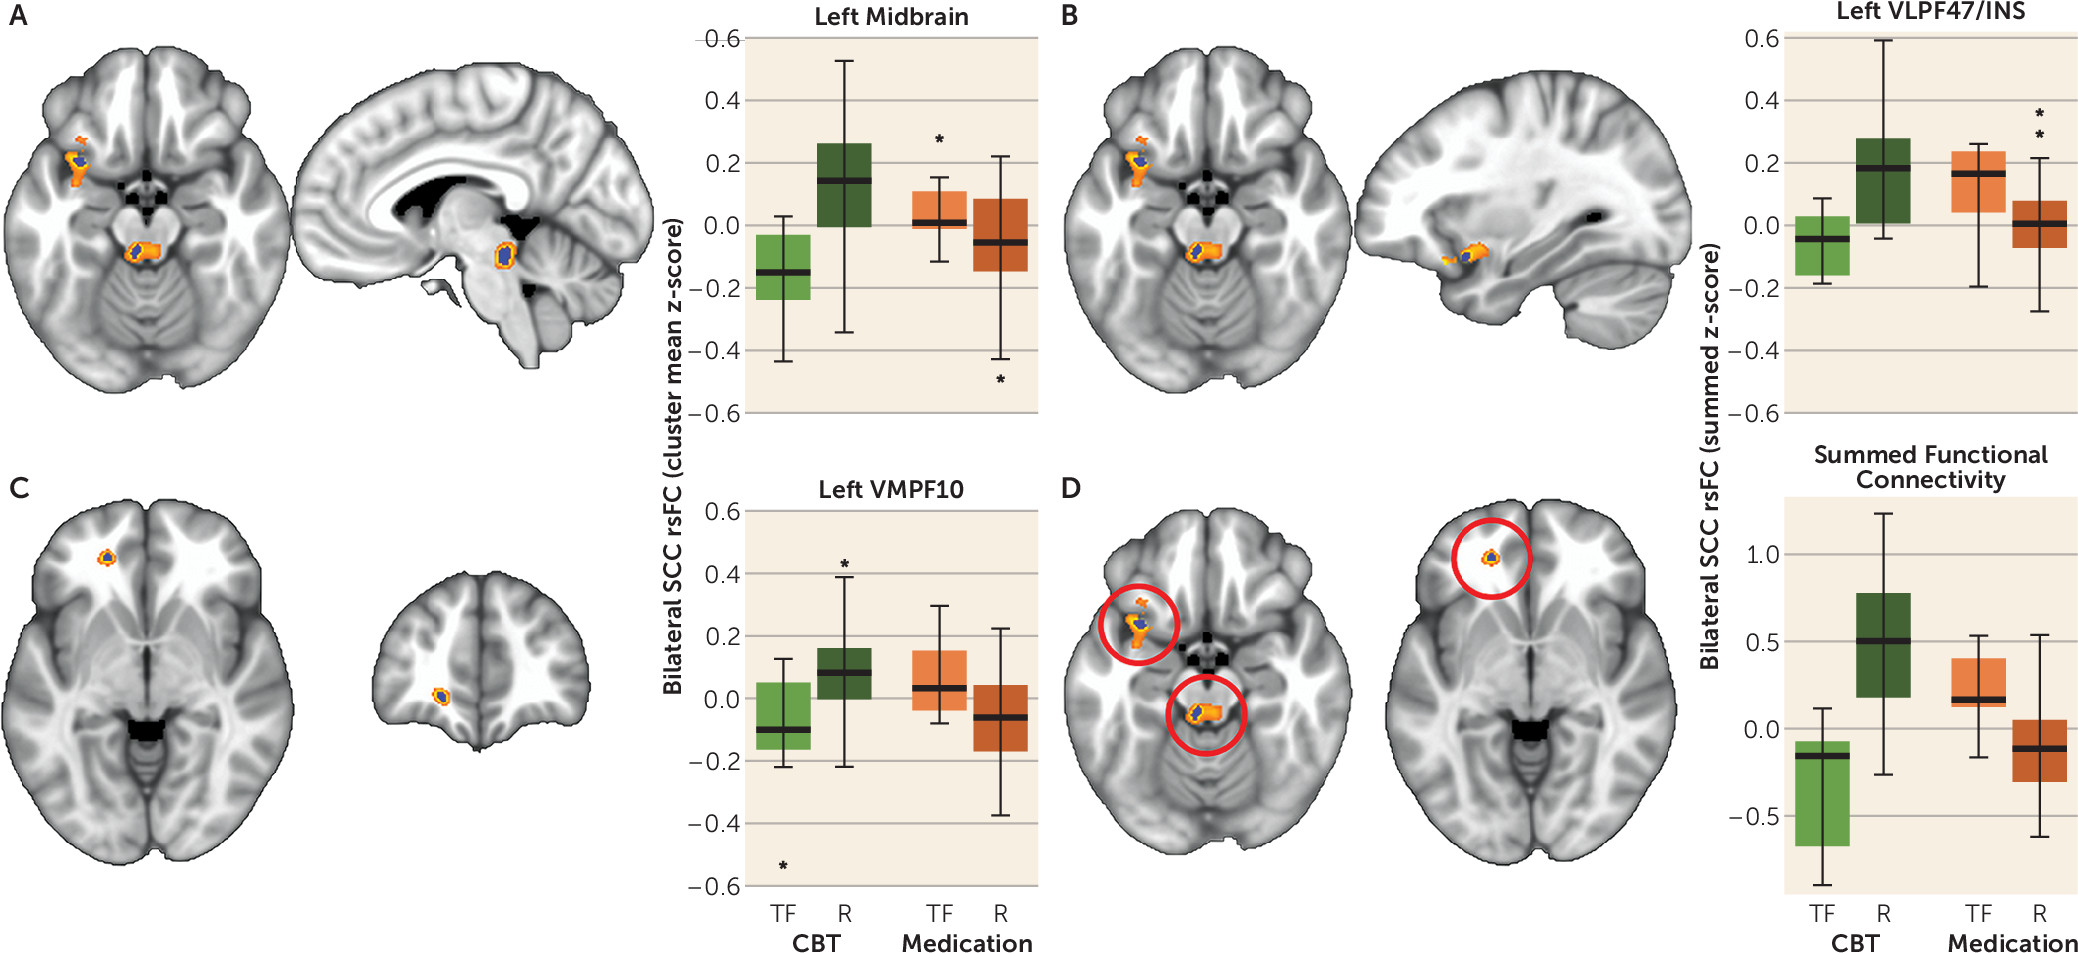
FIGURE 1. Differential Functional Connectivity of Subcallosal Cingulate Cortex Between Remitters and Treatment Failures With Antidepressant Medication or Cognitive-Behavioral Therapy (CBT)a
a The figure shows A–C) the representative brain region and box plot of the z-score of the resting-state functional connectivity (rsFC) with the subcallosal cingulate cortex (SCC) between remitters (R) and treatment failures (TF) with each treatment type. The voxels identified by the subsample permutation testing (blue) are shown superimposed over voxels identified by the original analysis of variance (orange; see the Methods section in the article text). Box plots reflect contrasts using the permuted data. In all regions, the functional connectivity with the SCC seed is positive in CBT remitters and anticorrelated in CBT-treatment failures, whereas the inverse is true for antidepressant medication remitters and treatment failures. The images are as follows: A) dorsal midbrain; B) ventrolateral prefrontal cortex Brodmann area (BA) 47/insula (VLPF47/INS); C) ventromedial prefrontal cortex BA 10 (VMPF10); and D) box plots of the z-scores of the sum of the functional connectivity of the SCC with the three regions. The treatment-by-response interaction was significant at p=5e–10.

Subject-Level Predictive Ability (Post Hoc)

The precision medicine goal of the subject-level fMRI evaluation was to examine the possible predictive value of each region, as well as the summed functional connectivity z-score. For each of these measures, we used receiver operating characteristic curves to examine the sensitivity and specificity of using various levels of connectivity to dichotomize the entire sample of patients into outcome groups. In each case, we examined the classification rates for both remission (compared with nonremission), as well as treatment failure (compared with response of any kind) in order to demonstrate the use of the imaging measures to identify the key clinical targets. To determine the level of connectivity that resulted in the highest combination of sensitivity and specificity, we chose the maximum Youden index (55). Notably, these evaluations of predictive ability are post hoc and thus reflect an examination of the classification capabilities of the identified regions in this sample; they are not independent validations.

Results

Demographic and Clinical Measures

Of the 234 per-protocol completers, 122 had MRIs of adequate quality for analysis. The majority of patients in both treatment groups were women (CBT: N=20/37, 54.1%; medication: N=45/85, 52.9%) and experiencing their first major depressive episode (CBT: N=21/37, 56.8%; medication: N=47/85, 55.3%). Additional clinical and demographic characteristics of the sample are presented in Table 1. Of the 122 patients, 82 had clear clinical outcomes: 58 achieved remission (CBT: N=17; medication: N=41), and 24 experienced treatment failure (CBT: N=10; medication: N=14). Forty patients had intermediate outcomes (CBT: N=10; medication: N=30). The mean percent change in HAM-D scores at week 12 did not significantly differ between treatments (CBT: 50.9% [SD=39.6%]; medication: 60.7% [SD=28.0%]; p=0.178).
TABLE 1. Baseline Clinical and Demographic Characteristics (N=122)
 Medication-Treated Group (N=85)Cognitive-Behavioral Therapy Group (N=37)
CharacteristicMeanSDMeanSDp
Age (years)38.711.038.510.60.912
Length of current episode (weeks)129.0239.379.984.60.100
Measure     
 Hamilton Depression Rating Scale baseline19.03.117.92.40.028
 Beck Depression Inventory total baseline22.66.320.26.60.078
 Hamilton Anxiety Rating Scale total baseline15.44.614.53.90.272
 Childhood Trauma Questionnaire total46.015.743.212.60.291

Treatment-by-Outcome Analysis of Variance (ANOVA)

The effect sizes (Cohen’s d) of the mean of all voxels in each region identified in the primary ANOVA are summarized in Table 2; they are ordered by cluster size and the overall marginal effect size. Differential outcomes to antidepressant medication or CBT were associated with SCC resting-state functional connectivity with six regions: 1) the left dorsal midbrain (appearing to include areas of the periaqueductal gray and dorsal raphe); 2) the left frontal operculum (incorporating Brodmann area [BA] 47 of the ventrolateral prefrontal cortex [VLPF47] and parts of the anterior insula [INS]); 3) the right posterior cingulate (BA 7); 4) the cerebellar vermis; 5) the right superior frontal pole (BA 10); and 6) the left ventromedial prefrontal cortex (BA 10) (VMPF10).
TABLE 2. Cluster Maxima Differentiating Remitters and Treatment Failures by Treatment Typea
     Remitters: Treatment Failures With CBTRemitters: Treatment Failures With MedicationCBT: Medication in Treatment FailuresCBT: Medication in Remitters
RegionBrodmann AreaMontreal Neurological Institute Coordinates, Peak (x, y, z)HemisphereCluster Size (1-mm Voxels)Effect SizepEffect SizepEffect SizepEffect SizepAverage Marginal Effect Size
Original analysis of variance             
Dorsal midbrain–5, –32, –17Left1,3831.45<0.0010.570.3711.290.0511.13<0.0011.11
Ventrolateral prefrontal cortex Brodmann area 47/insula47–31, 12, –17Left1,0411.58<0.0010.750.1431.160.061.45<0.0011.24
Posterior cingulate718, –47, 37Right6031.79<0.0010.350.6491.120.0160.820.0441.02
Cerebellar vermis1, –53, –34771.340.0090.360.6341.200.0440.540.2280.86
Superior frontal pole1012, 65, 20Right3571.030.0840.960.0101.410.0030.480.3660.86
Ventromedial prefrontal cortex, Brodmann area 1010–19, 44, –5Left3421.060.0051.090.0241.090.0331.140.0011.10
Permuted regions             
Dorsal midbrain–5, –32, –17Left1231.54<0.0010.700.1921.710.0151.11<0.0011.26
Ventrolateral prefrontal cortex Brodmann area 47/insula47–31, 12, –17Left771.49<0.0010.750.1191.130.0641.30<0.0011.17
Ventromedial prefrontal cortex, Brodmann area 1010–18, 44, –5Left421.150.0031.060.0211.140.0221.160.0011.13
Sum of permuted regions    1.89<0.0011.360.0031.95<0.0011.77<0.0011.74
a
Nonpermuted regions were thresholded at a p value <0.005; CBT=cognitive-behavioral therapy.
After application of the subsampling permutation testing, only three of the six regions retained significance: the left midbrain, the left VLPF47/INS, and the left VMPF10 (Table 2). The three regions (BA 7, cerebellar vermis, superior frontal pole) that failed to survive the permutation testing likely represent effects that were due to a small number of subjects and thus are less generalizable. The three regions identified by the permutation testing superimposed over the regions identified from the original primary ANOVA are shown in Figure 1A–C. The peak voxels for each of the three identified regions are exactly the same in the primary and permutated analyses (Table 2). As shown in the boxplots of the permuted data for each region (Figure 1A–C), greater positive functional connectivity with the SCC was associated with remission to CBT and treatment failure with medication, with absent or negative connectivity associated with the opposite pattern of outcomes for the two treatments. The box plots for the permuted summed functional connectivity of the three regions and the four outcomes are shown in Figure 1D.

Individual Medications Compared With CBT

To evaluate whether either drug individually was driving the results, and to test possible effects of sample size imbalance on the results reported in Table 2 and Figure 1, additional separate 2×2 ANOVAs were conducted using escitalopram compared with CBT and duloxetine compared with CBT for the remission and treatment failure outcomes. Figure S1 in the data supplement accompanying the online version of this article demonstrates that the individual drug contrasts map very closely onto the same regions identified in the original ANOVA of the two drugs combined, indicating that the resting-state functional connectivity patterns differentiating CBT and medication outcomes are consistent for both the SSRI and the SNRI.

Subject-Level Prediction of Outcome

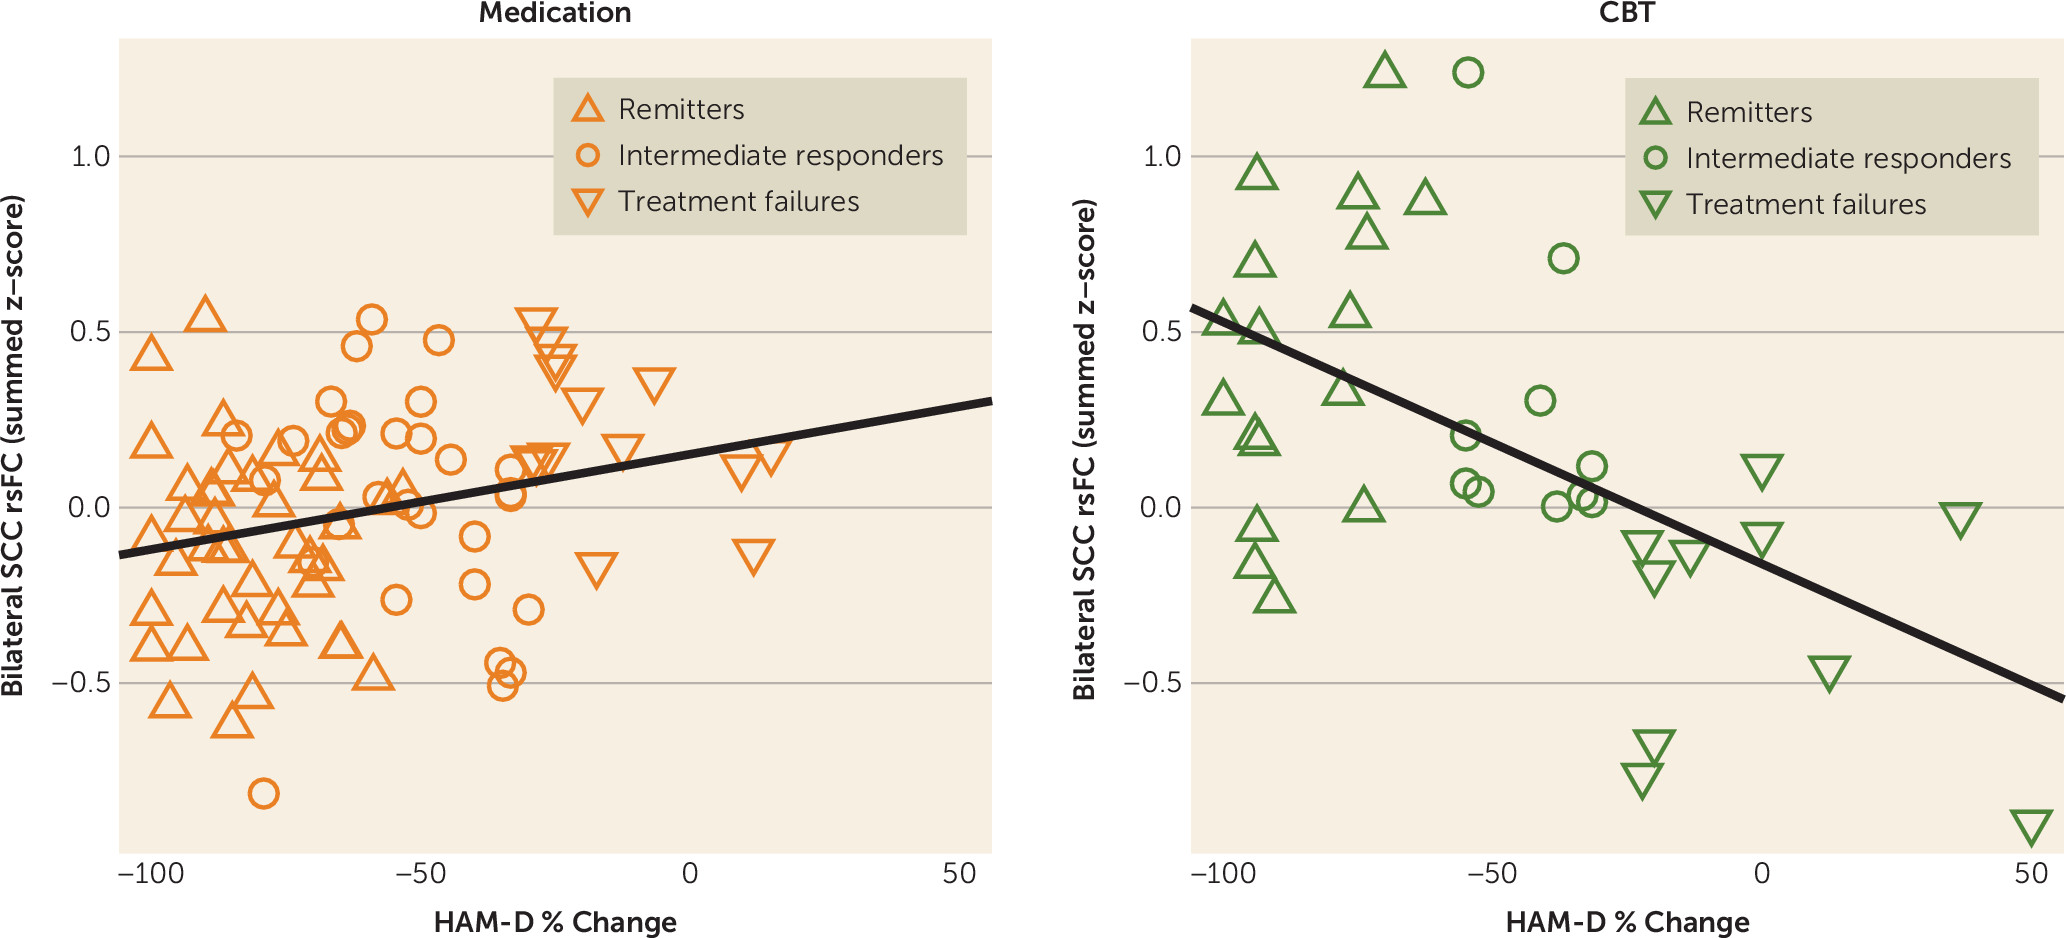
The relationship between summed functional connectivity scores and the individual percent HAM-D change for all subjects (N=122) by treatment are shown in Figure 2. The Pearson’s correlations were significant for both treatments, although the strength of the correlation was stronger among CBT-treated patients (r=−0.539, p<0.001) than among medication-treated patients (r=0.258, p<0.017).
FIGURE 2. Correlation Between Percent Change in Depression Severity and the Summed Functional Connectivity of the Subcallosal Cingulate Cortex Across All Patients by Treatment Typea
a The plots show the correlation between summed resting-state functional connectivity (rsFC) and subjects’ percent change in the 17-item Hamilton Depression Rating Scale (HAM-D) score across all 122 patients with analyzable functional MRIs. The left panel with orange symbols shows the data for the medication-treated patients; the right panel with green symbols shows that for the CBT-treated patients. The correlations between the summed functional connectivity scores and the percent HAM-D change were significant for both treatments, though the strength of the correlation was stronger among CBT-treated patients (r=−0.539, p<0.001) than among medication-treated patients (r=0.258, p<0.017). Summed functional connectivity reflects the added scores of the resting-state functional connectivity of the cingulate cortex with each of the three regions identified in Figure 1. “Intermediate response” subjects had ≥30% improvement in the HAM-D score but did not meet criteria for remission.
Receiver operating characteristic curves were constructed to characterize the overall predictive value of the brain connectivity measures among all subjects (N=122). As expected, all three individual region measures had significant predictive value for remission above chance, but the area under the curve was highest for the summed score when compared with the individual regions. Thus, only the summed score was pursued further.
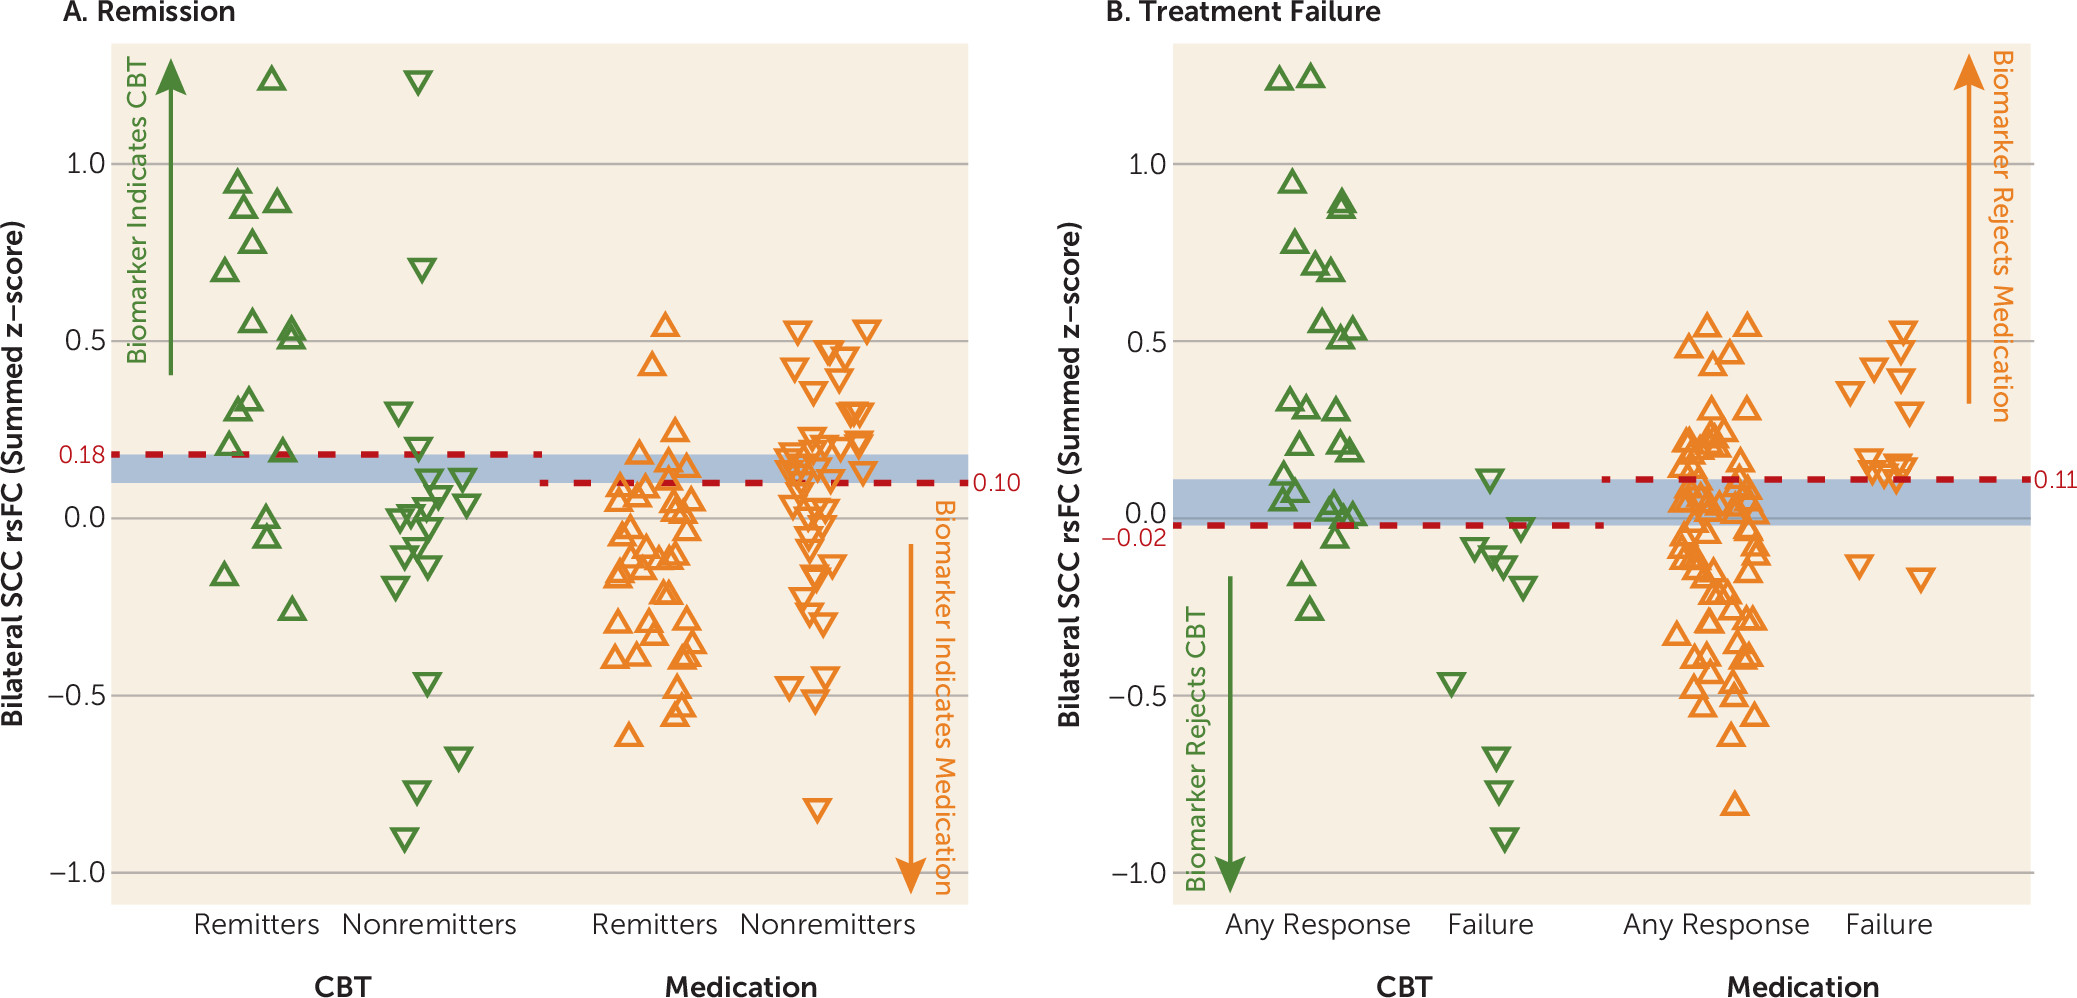
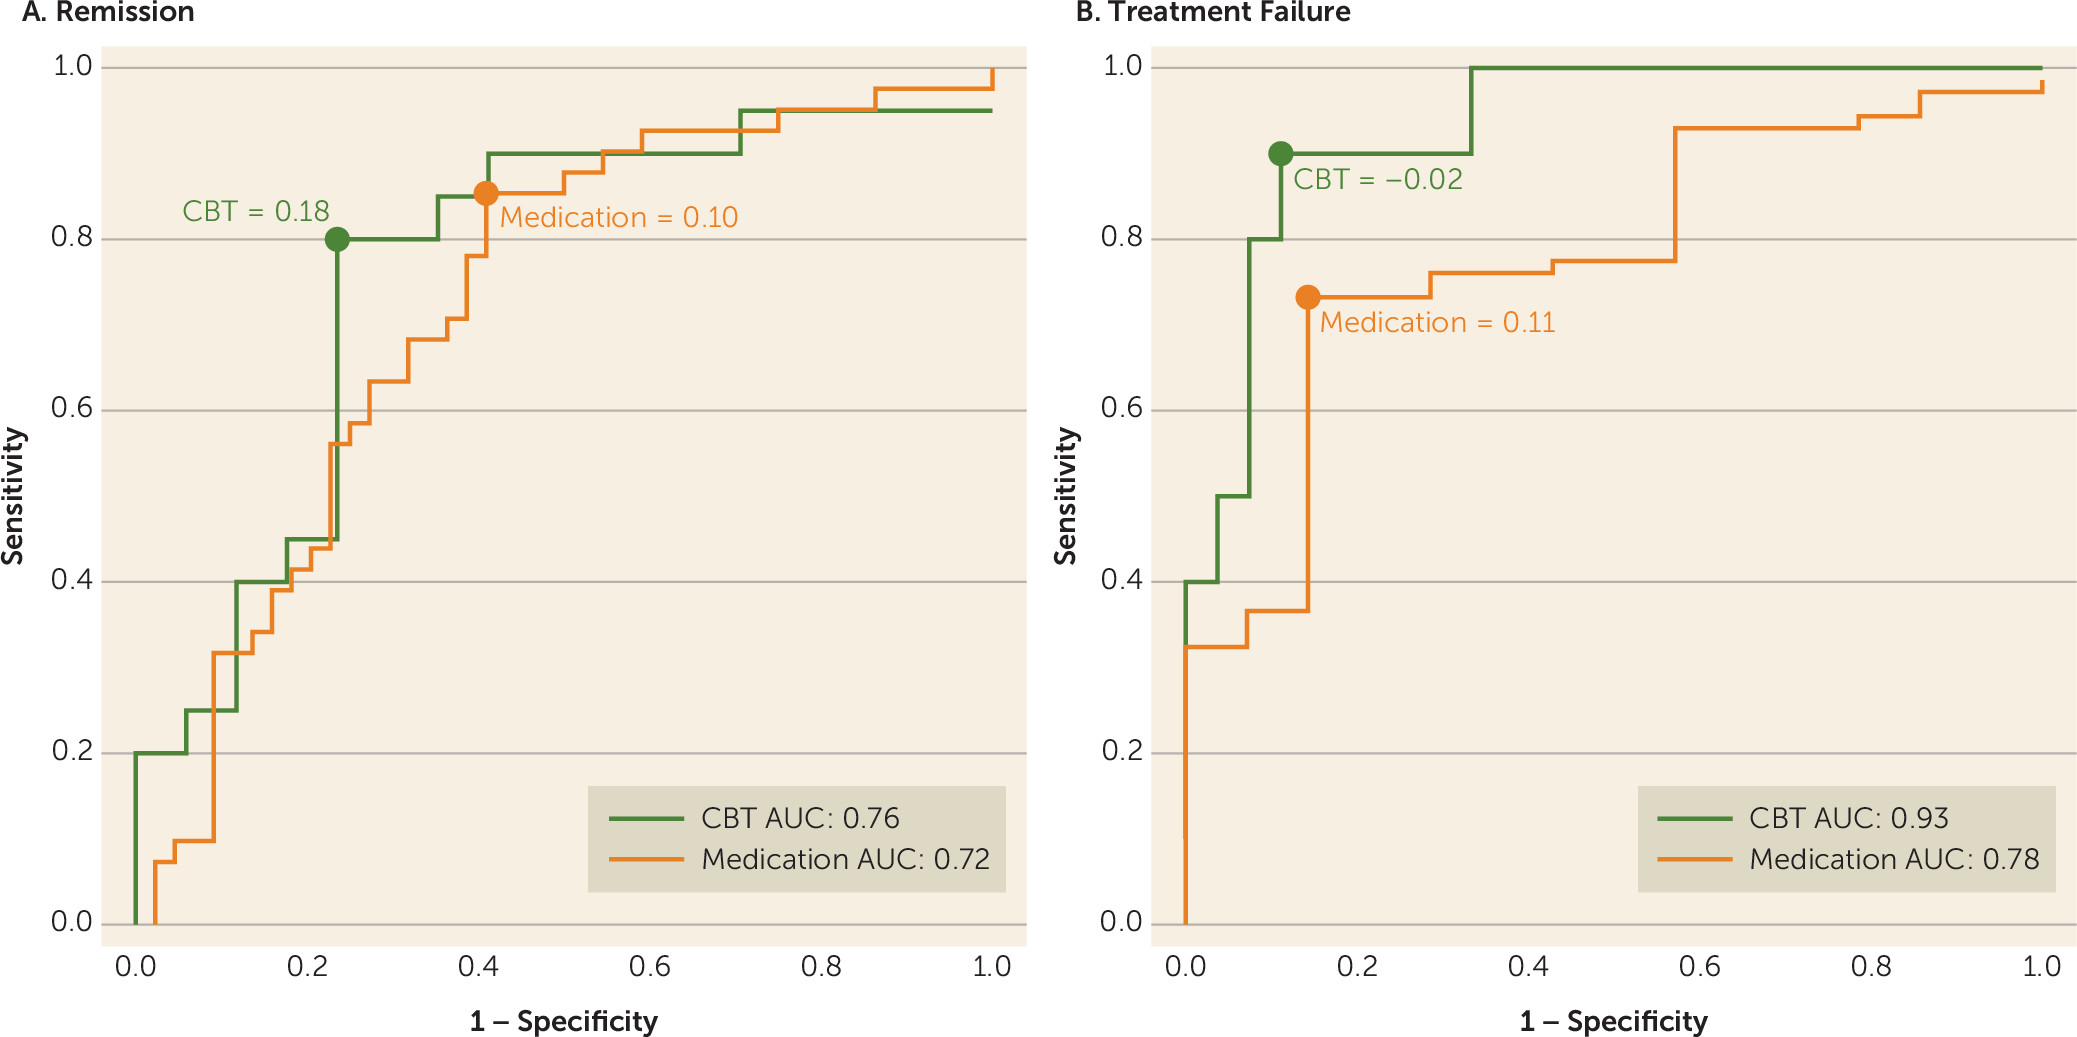
Evaluation of the predictive ability of the summed connectivity score was performed within the two treatment groups. For CBT, the maximum index for remission occurred at a summed connectivity score of approximately 0.18 or higher and resulted in a classification rate of 78% (Figure 3A). In contrast, the maximum index for treatment failure with CBT was approximately –0.02 or less, which resulted in a higher classification rate of 89% (Figure 3B). For medication, the maximum index for remission occurred at a summed score of 0.10 or lower (classification rate of 72%) (Figure 3A), and for treatment failure at a summed score of 0.11 or higher (classification rate of 75%) (Figure 3B). The distribution of the individual subject summed connectivity scores, along with the maximum indexes for remission and treatment failure for each treatment, are shown in Figure 4A and Figure 4B. Taken together, these results indicate that 1) differential response to CBT is the stronger signal, and 2) positive connectivity in these regions is associated with a recommendation for CBT, while negative connectivity in these regions would suggest medication as the better choice. Given there is some overlap in these cutoffs, it appears that the region where there is very little connectivity in either direction may not provide adequate evidence for a choice.
FIGURE 3. Receiver Operating Characteristic Curves for Classification of Remission and Treatment Failure Outcomes With Cognitive-Behavioral Therapy (CBT) and Medication Treatmenta
a The graphs show the receiver operating characteristic curves for A) remission and B) treatment failure, showing optimal summed functional connectivity values for classifying these respective outcomes for each treatment (medication-treated=orange; CBT-treated=green).
FIGURE 4. Individual Participants’ Summed Functional Connectivity Scores Grouped by Treatment Outcomea
a The strip charts show individual subjects’ summed resting-state functional connectivity (rsFC) scores. Green triangles represent cognitive-behavioral therapy (CBT)-treated patients; orange triangles represent medication-treated patients. A) Upward-pointing triangles represent remission; downward-pointing triangles represent nonremission. For maximizing remission outcomes, z-scores >0.18 indicate that CBT should be selected; z-scores <0.10 indicate that medication should be chosen. B) Upward-pointing triangles represent any level of response (partial response, response, or remission); downward-pointing triangles represent treatment failure. To minimize treatment failure, z-scores <−0.02 indicate that CBT should be avoided; z-scores >0.11 indicate that medication should be avoided.
Among the 122 patients with adequate baseline fMRI data, there were five treatment failure patients with CBT and seven treatment failure patients with medication from phase 1 who completed the phase 2 combination treatment. Although the numbers are too low for statistical analysis, Figure S2 in the online data supplement shows the outcomes of patients who completed the 12-week combination treatment. The figure demonstrates that 50% of the treatment failure patients remitted (defined as a HAM-D score ≤7 at both weeks 22 and 24) when the alternative treatment was added; those patients whose summed functional connectivity measure was most strongly categorized as a likely remitter to CBT or to medication were particularly likely to benefit from the second treatment.

Clinical Correlates of Imaging Subgroups

In order to evaluate whether the imaging subtypes were simply reflecting a demographic or clinical characteristic, we conducted exploratory analyses assessing whether any of the characteristics listed in Table 1 were associated with the summed functional connectivity measure. No significant associations were found, indicating that there were no demographic or clinical surrogates of the imaging biomarker.

Non-Specific Imaging Predictors of Response

To identify regions predictive of outcomes regardless of treatment modality, we conducted whole-brain t tests of SCC resting-state functional connectivity contrasting all responders and nonresponders regardless of treatment type, as well as all remitters compared with all treatment failures. Responders showed significantly greater SCC functional connectivity with the right postcentral gyrus and significantly lower functional connectivity with the right superior frontal gyrus. Remitters demonstrated significantly lower SCC functional connectivity with both the right precentral gyrus and right posterior putamen (see Table S1 in the online data supplement).

Discussion

In this study of previously untreated adults with major depression, outcomes after 12 weeks of treatment with randomly assigned medication or CBT were associated with the degree of resting-state functional connectivity between brain regions involved in mood regulation—specifically, the SCC and 1) the left frontal operculum (incorporating the BA47 in the ventrolateral prefrontal cortex [VLPFC] and anterior insula); 2) the left ventromedial prefrontal cortex (BA 10); and 3) the dorsal midbrain. By examining the summed z-score of the functional connectivity of the SCC with these three regions, it was demonstrated that the summed value, when applied to all individual subjects, provides reasonable measures of internal validity (72%−78% for remission; 75%−89% for treatment failure), exceeding the value of any clinical measure. Overall, negative connectivity scores were associated with remission to medication and treatment failure with CBT, whereas positive connectivity scores were associated with remission to CBT and treatment failure with medication. These robust findings indicate that neuroimaging may have an important role in the application of precision medicine for depression by identifying neural signatures of brain states that are differentially responsive to treatments with differing mechanisms of action.
Potential clinical applications of the summed functional connectivity z-score biomarker may depend on the clinical status of the patient and the treatment options available. For patients with profound functional impairment or high suicidality, avoidance of treatment failure may be the treatment priority, whereas for other patients the primary goal may be remission. When remission is the goal, a summed connectivity score >0.18 indicates that CBT should be used, whereas a score <0.10 suggests that medication is indicated. Patients with scores between 0.10 and 0.18 fall into a gray zone, where the biomarker does not suggest a specific treatment (Figure 3A, Figure 4A). Alternatively, in situations where avoiding treatment failure is the goal, a summed connectivity score of –0.02 or lower indicates that CBT should not be the initial treatment. Scores >0.11 suggest that medication is not the better choice. Scores between zero and 0.11 do not clearly indicate that one treatment would be superior to the alternative (Figure 3B, Figure 4B); treatment selection for these patients may be informed by other markers of likely treatment outcomes. Although these findings are encouraging, attempts at replication of the classification value of these indicators in existing data sets or thorough prospective testing should be undertaken before this imaging-based treatment selection approach is incorporated into routine clinical care.
The current findings are broadly consistent with prior neuroimaging prediction studies in major depression (15). We have previously proposed that psychotherapy-responsive depression may represent a brain state with sufficiently adequate connectivity in mood-regulating systems such that engagement of these systems via psychotherapy can reduce negative emotional states (25). Several studies support the conclusion that, on average, patients with major depression have reduced prefrontal control over emotion-generating limbic structures (29). Greater SCC reactivity (not functional connectivity) to presentations of negative, self-relevant words is associated with poorer outcomes to treatment with CBT (17). Others have found better response to CBT among major depressive disorder patients who were closest to healthy controls in terms of reactivity to emotional stimuli in the ventromedial prefrontal cortex (56), VLPFC, dorsolateral prefrontal cortex, and dorsal anterior cingulate cortex (57).
The VLPFC activity in healthy controls has been linked repeatedly to emotion regulation (58, 59) and sustained attention (60). The VLPFC is involved in stimulus selection, and reduced VLPFC activation in response to stimuli is associated with inability to disengage from negative stimuli (61). Impaired emotion regulation is linked to activity in the VLPFC among patients with major depression (62), and rumination is associated with VLPFC activity (63, 64) and volume (65). Greater resting-state functional connectivity between the SCC and VLPF47 may reflect the availability of this system to be recruited for mood regulation and therefore the ability to respond to CBT.
The operculo-insular cortex (VLPF47/INS region) is important for interoceptive and emotional processing (66, 67). In our previous report using PET, resting-state metabolic activity in the right anterior insula (with the cluster extending into the frontal operculum) differentially predicted remission and treatment failure with CBT and escitalopram (27, 28). Although the prior PET study differed from the current study in its methodology and the amount of prior treatment of the evaluated patients, and although the findings differed by side (right versus left), taken together the studies suggest that abnormal metabolic activity in regions associated with interoception and mood regulation may be an important predictor of outcomes to differing forms of treatment. From a clinical perspective, cases of major depression more associated with signals from the body (“gut feelings”) may be more resistant to pure psychotherapy approaches, whereas major depression that does not involve strong interoceptive experiences may be particularly responsive to CBT (68).
Functional connectivity of frontal brain regions with the midbrain has not emerged in prior fMRI analyses of major depression or its treatment, though an FDG-PET study found that lower pretreatment resting-state metabolism in the midbrain did predict remission to standard antidepressant medications (69). The coordinates of the midbrain signal in the present analyses indicated potential involvement of the periaqueductal gray, which is involved in coordinated autonomic and behavioral responses to emotional stimuli. Neuroanatomical analyses of periaqueductal gray connection studies in macaques demonstrated that the subcallosal (BA25) and pregenual (BA 32) frontal regions provided the strongest direct input to the dorsolateral column of the periaqueductal gray identified here (70). Furthermore, serotonin transporter concentrations may be elevated in the periaqueductal gray of major depression patients compared with healthy control subjects (71). In healthy controls, periaqueductal gray activity can be modulated by placebo-induced expectation of pain relief, and functional connectivity between SCC and periaqueductal gray is increased during a cold pressor task (72). This ability to regulate the periaqueductal gray may be diminished in the subset of patients with lower periaqueductal gray-SCC functional connectivity.
Sufficient connectivity between the SCC and the midbrain may also reflect the importance of the structural connections between the ventromedial prefrontal cortex and the dorsal raphe (73). The ventromedial prefrontal cortex (incorporating the SCC) is crucial for regulating an organism’s response to both controllable and uncontrollable stressors, mediated in part by its regulation of dorsal raphe activity in response to stress (73, 74). Furthermore, in a chronic social defeat model of depression in mice, deep brain stimulation to the ventromedial prefrontal cortex induces neuroplastic changes in the serotonergic neurons in the dorsal raphe (75). Weak or absent connectivity between the SCC and dorsal raphe may reflect a biological inability of a patient to achieve effortful control over stress responses and thus indicate the need for a direct effect on the serotonergic transporters and autoreceptors of the raphe by antidepressant medication (76).
Several prior studies have implicated dysregulation in the medial portion of BA 10 in patients with major depression (77, 78), and the polar components of VMPF10 may be smaller in patients with major depression compared with healthy controls (79). The ventromedial portion of BA 10 in the prefrontal cortex is an important component of the default mode network (80) and is extensively connected to the SCC (via the fronto-medial extent of the uncinate fasciculus) (38), as well as the periaqueductal gray and hypothalamus (81, 82). Moreover, VMPF10 and VLPF47 are bidirectionally connected by lateral branches of the uncinate fasciculus, disruptions of which are associated with impairments in use of memory to guide decision making and socio-emotional difficulties (83). Intriguingly, metabolic activity in the anterior insula and periaqueductal gray of rhesus monkeys correlates positively with anxious temperament behaviors in animals exposed to threat (84). Taken together, the three regions identified in the current analyses are consistent with an interactive network of regions involved in processing and regulating emotional states. Beyond the findings related to the association with treatment outcomes, these results provide further information regarding the pathophysiology of major depression. It would be informative to examine how the functional connectivity patterns associated with treatment outcomes in the present analysis compare with the functional connectivity of the SCC in age- and gender-matched healthy control subjects and in patients with remitted major depression.
An important strength of the PReDICT study is that all patients were treatment-naive. Prior studies have shown that antidepressant medication treatment alters reactivity of the SCC, VLPFC, and insula (85), as well as the functional connectivity between cortical and limbic regions in major depression patients (86). These findings indicate the potential for confounding in neuroimaging studies using patients on antidepressant medications at baseline. The PReDICT study’s treatment-naive sample indicates that treatment-related subtypes are not driven by prior treatment exposures.
Studying treatment-naive patients without substantial comorbidity controlled for variables that could have impaired detection of between-group differences. The treatment-naive sample potentially limits generalizability, but our prior work demonstrated that pretreatment anterior insula metabolism was associated with differential treatment outcomes to medication and CBT in a previously treated, predominantly recurrent, sample of depressed patients (26). Similar to other searches for predictors, another limitation of the present study is that scans were conducted at a single time point and thus reflect only a cross-sectional (“state”) view into depression pathophysiology. Finally, a placebo-control treatment arm could have helped interpretation of the treatment-specific effects of the imaging findings.
The present results, in conjunction with our prior CBT compared with antidepressant medication study using FDG-PET (26, 27), argue strongly that brain state subtypes of heterogeneous major depressive disorder patients may reflect their biological capacity to benefit differentially from treatments with differing mechanisms of action. Brain-based measures of major depression are proving superior to clinical measures and patient preferences in signifying differential outcomes to depression treatments (7, 8, 10). Such measures may provide a basis for possible future algorithms for triaging subjects to the appropriate treatment, likely as a component within a multivariate approach to prediction. Further development of treatment selection biomarkers using replication and prospective testing can be expected to contribute meaningfully to the clinical goals of precision medicine approaches for patients with major depressive disorder.
Footnotes

Supported by the following NIH grants: P50 MH077083; RO1 MH080880; UL1 RR025008; M01 RR0039; and K23 MH086690. Elly Lilly and Forest Laboratories donated the study medications, escitalopram and duloxetine, respectively, but were otherwise uninvolved in the study design, data collection, data analysis, or interpretation of findings.
Clinicaltrials.gov listing: NCT00360399

Supplementary Material

File (appi.ajp.2016.16050518.ds001.pdf)

References

1.
Hasler G, Drevets WC, Manji HK, et al: Discovering endophenotypes for major depression. Neuropsychopharmacology 2004; 29:1765–1781
2.
American Psychiatric Association: Practice Guideline for the Treatment of Patients With Major Depressive Disorder, 3rd ed. Washington, DC, American Psychiatric Association, 2010
3.
Craighead WE, Dunlop BW: Combination psychotherapy and antidepressant medication treatment for depression: for whom, when, and how. Annu Rev Psychol 2014; 65:267–300
4.
Schatzberg AF, Rush AJ, Arnow BA, et al: Chronic depression: medication (nefazodone) or psychotherapy (CBASP) is effective when the other is not. Arch Gen Psychiatry 2005; 62:513–520
5.
Dunlop BW: Evidence-based applications of combination psychotherapy and pharmacotherapy for depression. Focus 2016; 14:156–173
6.
Collins FS, Varmus H: A new initiative on precision medicine. N Engl J Med 2015; 372:793–795
7.
Weitz E, Hollon SD, Twisk J, et al: Does baseline depression severity moderate outcomes between CBT and pharmacotherapy? An individual participant data meta-analysis. JAMA Psychiatry 2015; 72:1102–1109
8.
Cuijpers P, Weitz E, Lamers F, et al: Melancholic and atypical depression as predictor and moderator of outcome in cognitive behavior therapy and pharmacotherapy for adult depression. Depress Anxiety (Epub ahead of print, Dec 6, 2016)
9.
Paulus MP: Pragmatism instead of mechanism. JAMA Psychiatry 2015; 72:631–632
10.
Dunlop BW, Kelley ME, Aponte-Rivera V, et al: Effects of patient preferences on outcomes in the Predictors of Remission in Depression to Individual and Combined Treatments (PReDICT) study. Am J Psychiatry 2017; 174:546–556
11.
Dunlop BW: Prediction of treatment outcomes in major depressive disorder. Expert Rev Clin Pharmacol 2015; 8:669–672
12.
Ressler KJ, Mayberg HS: Targeting abnormal neural circuits in mood and anxiety disorders: from the laboratory to the clinic. Nat Neurosci 2007; 10:1116–1124
13.
Williams LM: Precision psychiatry: a neural circuit taxonomy for depression and anxiety. Lancet Psychiatry 2016; 3:472–480
14.
Goldapple K, Segal Z, Garson C, et al: Modulation of cortical-limbic pathways in major depression: treatment-specific effects of cognitive behavior therapy. Arch Gen Psychiatry 2004; 61:34–41
15.
Fu CH, Steiner H, Costafreda SG: Predictive neural biomarkers of clinical response in depression: a meta-analysis of functional and structural neuroimaging studies of pharmacological and psychological therapies. Neurobiol Dis 2013; 52:75–83
16.
Chi KF, Korgaonkar M, Grieve SM: Imaging predictors of remission to anti-depressant medications in major depressive disorder. J Affect Disord 2015; 186:134–144
17.
Siegle GJ, Thompson WK, Collier A, et al: Toward clinically useful neuroimaging in depression treatment: prognostic utility of subgenual cingulate activity for determining depression outcome in cognitive therapy across studies, scanners, and patient characteristics. Arch Gen Psychiatry 2012; 69:913–924
18.
Ritchey M, Dolcos F, Eddington KM, et al: Neural correlates of emotional processing in depression: changes with cognitive behavioral therapy and predictors of treatment response. J Psychiatr Res 2011; 45:577–587
19.
Fu CH, Williams SC, Cleare AJ, et al: Neural responses to sad facial expressions in major depression following cognitive behavioral therapy. Biol Psychiatry 2008; 64:505–512
20.
Dichter GS, Gibbs D, Smoski MJ: A systematic review of relations between resting-state functional-MRI and treatment response in major depressive disorder. J Affect Disord 2015; 172:8–17
21.
Milak MS, Parsey RV, Lee L, et al: Pretreatment regional brain glucose uptake in the midbrain on PET may predict remission from a major depressive episode after three months of treatment. Psychiatry Res 2009; 173:63–70
22.
Williams LM, Korgaonkar MS, Song YC, et al: Amygdala reactivity to emotional faces in the prediction of general and medication-specific responses to antidepressant treatment in the randomized iSPOT-D trial. Neuropsychopharmacology 2015; 40:2398–2408
23.
Samson AC, Meisenzahl E, Scheuerecker J, et al: Brain activation predicts treatment improvement in patients with major depressive disorder. J Psychiatr Res 2011; 45:1214–1222
24.
Rush AJ: Narrowing the gaps between what we know and what we do in psychiatry. J Clin Psychiatry 2015; 76:1366–1372
25.
Dunlop BW, Mayberg HS: Neuroimaging-based biomarkers for treatment selection in major depressive disorder. Dialogues Clin Neurosci 2014; 16:479–490
26.
McGrath CL, Kelley ME, Holtzheimer PE, et al: Toward a neuroimaging treatment selection biomarker for major depressive disorder. JAMA Psychiatry 2013; 70:821–829
27.
Dunlop BW, Kelley ME, McGrath CL, et al: Preliminary findings supporting insula metabolic activity as a predictor of outcome to psychotherapy and medication treatments for depression. J Neuropsychiatry Clin Neurosci 2015; 27:237–239
28.
Wang L, Hermens DF, Hickie IB, et al: A systematic review of resting-state functional-MRI studies in major depression. J Affect Disord 2012; 142:6–12
29.
Salerian AJ, Altar CA: The prefrontal cortex influence over subcortical and limbic regions governs antidepressant response by N=H/(M+R). Psychiatry Res 2012; 204:1–12
30.
Mayberg HS, Liotti M, Brannan SK, et al: Reciprocal limbic-cortical function and negative mood: converging PET findings in depression and normal sadness. Am J Psychiatry 1999; 156:675–682
31.
Smith R, Fadok RA, Purcell M, et al: Localizing sadness activation within the subgenual cingulate in individuals: a novel functional MRI paradigm for detecting individual differences in the neural circuitry underlying depression. Brain Imaging Behav 2011; 5:229–239
32.
Greicius MD, Flores BH, Menon V, et al: Resting-state functional connectivity in major depression: abnormally increased contributions from subgenual cingulate cortex and thalamus. Biol Psychiatry 2007; 62:429–437
33.
Little JT, Ketter TA, Kimbrell TA, et al: Venlafaxine or bupropion responders but not nonresponders show baseline prefrontal and paralimbic hypometabolism compared with controls. Psychopharmacol Bull 1996; 32:629–635
34.
Brody AL, Saxena S, Silverman DH, et al: Brain metabolic changes in major depressive disorder from pre- to post-treatment with paroxetine. Psychiatry Res 1999; 91:127–139
35.
Konarski JZ, Kennedy SH, Segal ZV, et al: Predictors of nonresponse to cognitive behavioural therapy or venlafaxine using glucose metabolism in major depressive disorder. J Psychiatry Neurosci 2009; 34:175–180
36.
McGrath CL, Kelley ME, Dunlop BW, et al: Pretreatment brain states identify likely nonresponse to standard treatments for depression. Biol Psychiatry 2014; 76:527–535
37.
Mayberg HS, Lozano AM, Voon V, et al: Deep brain stimulation for treatment-resistant depression. Neuron 2005; 45:651–660
38.
Riva-Posse P, Choi KS, Holtzheimer PE, et al: Defining critical white matter pathways mediating successful subcallosal cingulate deep brain stimulation for treatment-resistant depression. Biol Psychiatry 2014; 76:963–969
39.
Dunlop BW, Binder EB, Cubells JF, et al: Predictors of Remission in Depression to Individual and Combined Treatments (PReDICT): study protocol for a randomized controlled trial. Trials 2012; 13:106
40.
First MB, Spitzer RL, Gibbon M, et al: Structured Clinical Interview for DSM-IV Axis I Disorders-Patient Edition (SCID-I/P, Version 2.0). New York, Biometrics Research Department, New York State Psychiatric Institute, 1995
41.
Hamilton M: A rating scale for depression. J Neurol Neurosurg Psychiatry 1960; 23:56–62
42.
Beck AT, Rush AJ, Shaw BF, et al: Cognitive Therapy of Depression. New York, Guilford, 1979
43.
Hamilton M: The assessment of anxiety states by rating. Br J Med Psychol 1959; 32:50–55
44.
Beck AT, Ward CH, Mendelson M, et al: An inventory for measuring depression. Arch Gen Psychiatry 1961; 4:561–571
45.
Bernstein DP, Fink L: Childhood trauma questionnaire manual. San Antonio, Tex, Psychological Corporation; 1998
46.
Heberlein KA, Hu X: Simultaneous acquisition of gradient-echo and asymmetric spin-echo for single-shot z-shim: Z-SAGA. Magn Reson Med 2004; 51:212–216
47.
Power JD, Barnes KA, Snyder AZ, et al: Spurious but systematic correlations in functional connectivity MRI networks arise from subject motion. Neuroimage 2012; 59:2142–2154
48.
Cox RW, Hyde JS: Software tools for analysis and visualization of fMRI data. NMR Biomed 1997; 10:171–178
49.
Desikan RS, Ségonne F, Fischl B, et al: An automated labeling system for subdividing the human cerebral cortex on MRI scans into gyral based regions of interest. Neuroimage 2006; 31:968–980
50.
Gutman DA, Holtzheimer PE, Behrens TE, et al: A tractography analysis of two deep brain stimulation white matter targets for depression. Biol Psychiatry 2009; 65:276–282
51.
Taylor PA, Saad ZS: FATCAT: (an efficient) Functional and Tractographic Connectivity Analysis Toolbox. Brain Connect 2013; 3:523–535
52.
Owens MJ, Dunlop BW, Plott S, et al: Poster presentation: Estimates of serotonin or norepinephrine transporter occupancy do not predict efficacy in a 12 week trial. Presented at the proceedings of the 54th Annual Meeting of the American College of Neuropsychopharmacology, Hollywood, Fla, 2015
53.
Chen G, Adleman NE, Saad ZS, et al: Applications of multivariate modeling to neuroimaging group analysis: a comprehensive alternative to univariate general linear model. Neuroimage 2014; 99:571–588
54.
Cohen J: Statistical Power Analysis for the Behavioral Sciences, 2nd ed. Hillsdale, NJ, Lawrence Erlbaum Associated, 1988
55.
Youden WJ: Index for rating diagnostic tests. Cancer 1950; 3:32–35
56.
Ritchey M, Dolcos F, Eddington KM, et al: Neural correlates of emotional processing in depression: changes with cognitive behavioral therapy and predictors of treatment response. J Psychiatr Res 2011; 45:577–587
57.
Fu CH, Williams SC, Cleare AJ, et al: Neural responses to sad facial expressions in major depression following cognitive behavioral therapy. Biol Psychiatry 2008; 64:505–512
58.
Wager TD, Davidson ML, Hughes BL, et al: Prefrontal-subcortical pathways mediating successful emotion regulation. Neuron 2008; 59:1037–1050
59.
Ochsner KN, Gross JJ: Cognitive emotion regulation: insights from social cognitive and affective neuroscience. Curr Dir Psychol Sci 2008; 17:153–158
60.
D’Esposito M, Postle BR, Rypma B: Prefrontal cortical contributions to working memory: evidence from event-related fMRI studies. Exp Brain Res 2000; 133:3–11
61.
Disner SG, Beevers CG, Haigh EA, et al: Neural mechanisms of the cognitive model of depression. Nat Rev Neurosci 2011; 12:467–477
62.
Rive MM, van Rooijen G, Veltman DJ, et al: Neural correlates of dysfunctional emotion regulation in major depressive disorder: a systematic review of neuroimaging studies. Neurosci Biobehav Rev 2013; 37:2529–2553
63.
Liotti M, Mayberg HS, McGinnis S, et al: Unmasking disease-specific cerebral blood flow abnormalities: mood challenge in patients with remitted unipolar depression. Am J Psychiatry 2002; 159:1830–1840
64.
Connolly CG, Wu J, Ho TC, et al: Resting-state functional connectivity of subgenual anterior cingulate cortex in depressed adolescents. Biol Psychiatry 2013; 74:898–907
65.
Qiao L, Wei DT, Li WF, et al: Rumination mediates the relationship between structural variations in ventrolateral prefrontal cortex and sensitivity to negative life events. Neuroscience 2013; 255:255–264
66.
Zaki J, Davis JI, Ochsner KN: Overlapping activity in anterior insula during interoception and emotional experience. Neuroimage 2012; 62:493–499
67.
zu Eulenburg P, Baumgärtner U, Treede RD, et al: Interoceptive and multimodal functions of the operculo-insular cortex: tactile, nociceptive and vestibular representations. Neuroimage 2013; 83:75–86
68.
Mayer EA: Gut feelings: the emerging biology of gut-brain communication. Nat Rev Neurosci 2011; 12:453–466
69.
Milak MS, Parsey RV, Lee L, et al: Pretreatment regional brain glucose uptake in the midbrain on PET may predict remission from a major depressive episode after three months of treatment. Psychiatry Res 2009; 173:63–70
70.
An X, Bandler R, Ongür D, et al: Prefrontal cortical projections to longitudinal columns in the midbrain periaqueductal gray in macaque monkeys. J Comp Neurol 1998; 401:455–479
71.
Cannon DM, Ichise M, Rollis D, et al: Elevated serotonin transporter binding in major depressive disorder assessed using positron emission tomography and [11C]DASB; comparison with bipolar disorder. Biol Psychiatry 2007; 62:870–877
72.
Bingel U, Lorenz J, Schoell E, et al: Mechanisms of placebo analgesia: rACC recruitment of a subcortical antinociceptive network. Pain 2006; 120:8–15
73.
Warden MR, Selimbeyoglu A, Mirzabekov JJ, et al: A prefrontal cortex-brainstem neuronal projection that controls response to behavioural challenge. Nature 2012; 492:428–432
74.
Amat J, Paul E, Zarza C, et al: Previous experience with behavioral control over stress blocks the behavioral and dorsal raphe nucleus activating effects of later uncontrollable stress: role of the ventral medial prefrontal cortex. J Neurosci 2006; 26:13264–13272
75.
Veerakumar A, Challis C, Gupta P, et al: Antidepressant-like effects of cortical deep brain stimulation coincide with pro-neuroplastic adaptations of serotonin systems. Biol Psychiatry 2014; 76:203–212
76.
Piñeyro G, Blier P: Autoregulation of serotonin neurons: role in antidepressant drug action. Pharmacol Rev 1999; 51:533–591
77.
Mayberg HS: Modulating dysfunctional limbic-cortical circuits in depression: towards development of brain-based algorithms for diagnosis and optimised treatment. Br Med Bull 2003; 65:193–207
78.
Drevets WC, Price JL, Furey ML: Brain structural and functional abnormalities in mood disorders: implications for neurocircuitry models of depression. Brain Struct Funct 2008; 213:93–118
79.
Bludau S, Bzdok D, Gruber O, et al: Medial prefrontal aberrations in major depressive disorder revealed by cytoarchitectonically informed voxel-based morphometry. Am J Psychiatry 2016; 173:291–298
80.
Fox MD, Snyder AZ, Vincent JL, et al: The human brain is intrinsically organized into dynamic, anticorrelated functional networks. Proc Natl Acad Sci USA 2005; 102:9673–9678
81.
Carmichael ST, Price JL: Connectional networks within the orbital and medial prefrontal cortex of macaque monkeys. J Comp Neurol 1996; 371:179–207
82.
Ongür D, Price JL: The organization of networks within the orbital and medial prefrontal cortex of rats, monkeys and humans. Cereb Cortex 2000; 10:206–219
83.
Von Der Heide RJ, Skipper LM, Klobusicky E, et al: Dissecting the uncinate fasciculus: disorders, controversies and a hypothesis. Brain 2013; 136:1692–1707
84.
Fox AS, Oler JA, Shackman AJ, et al: Intergenerational neural mediators of early-life anxious temperament. Proc Natl Acad Sci USA 2015; 112:9118–9122
85.
Delaveau P, Jabourian M, Lemogne C, et al: Brain effects of antidepressants in major depression: a meta-analysis of emotional processing studies. J Affect Disord 2011; 130:66–74
86.
Anand A, Li Y, Wang Y, et al: Reciprocal effects of antidepressant treatment on activity and connectivity of the mood regulating circuit: an FMRI study. J Neuropsychiatry Clin Neurosci 2007; 19:274–282

Information & Authors

Information

Published In

Go to American Journal of Psychiatry
American Journal of Psychiatry
Pages: 533 - 545
PubMed: 28335622

History

Received: 5 May 2016
Revision received: 11 October 2016
Revision received: 15 November 2016
Accepted: 21 November 2016
Published online: 24 March 2017
Published in print: June 01, 2017

Keywords

  1. Antidepressants
  2. Biological Markers
  3. Brain Imaging Techniques
  4. Cognitive Therapy

Authors

Details

Boadie W. Dunlop, M.D., M.S. [email protected]
From the Department of Psychiatry and Behavioral Sciences, Emory University School of Medicine, Atlanta; the Department of Psychology, Emory University, Atlanta; the Department of Biostatistics and Bioinformatics, Rollins School of Public Health, Emory University, Atlanta; the Department of Psychiatry, Harvard Medical School and McLean Hospital, Belmont, Mass.; and the Department of Psychiatry and Behavioral Sciences, University of Miami Miller School of Medicine, Miami.
Justin K. Rajendra, B.A.
From the Department of Psychiatry and Behavioral Sciences, Emory University School of Medicine, Atlanta; the Department of Psychology, Emory University, Atlanta; the Department of Biostatistics and Bioinformatics, Rollins School of Public Health, Emory University, Atlanta; the Department of Psychiatry, Harvard Medical School and McLean Hospital, Belmont, Mass.; and the Department of Psychiatry and Behavioral Sciences, University of Miami Miller School of Medicine, Miami.
W. Edward Craighead, Ph.D.
From the Department of Psychiatry and Behavioral Sciences, Emory University School of Medicine, Atlanta; the Department of Psychology, Emory University, Atlanta; the Department of Biostatistics and Bioinformatics, Rollins School of Public Health, Emory University, Atlanta; the Department of Psychiatry, Harvard Medical School and McLean Hospital, Belmont, Mass.; and the Department of Psychiatry and Behavioral Sciences, University of Miami Miller School of Medicine, Miami.
Mary E. Kelley, Ph.D.
From the Department of Psychiatry and Behavioral Sciences, Emory University School of Medicine, Atlanta; the Department of Psychology, Emory University, Atlanta; the Department of Biostatistics and Bioinformatics, Rollins School of Public Health, Emory University, Atlanta; the Department of Psychiatry, Harvard Medical School and McLean Hospital, Belmont, Mass.; and the Department of Psychiatry and Behavioral Sciences, University of Miami Miller School of Medicine, Miami.
Callie L. McGrath, Ph.D.
From the Department of Psychiatry and Behavioral Sciences, Emory University School of Medicine, Atlanta; the Department of Psychology, Emory University, Atlanta; the Department of Biostatistics and Bioinformatics, Rollins School of Public Health, Emory University, Atlanta; the Department of Psychiatry, Harvard Medical School and McLean Hospital, Belmont, Mass.; and the Department of Psychiatry and Behavioral Sciences, University of Miami Miller School of Medicine, Miami.
Ki Sueng Choi, Ph.D.
From the Department of Psychiatry and Behavioral Sciences, Emory University School of Medicine, Atlanta; the Department of Psychology, Emory University, Atlanta; the Department of Biostatistics and Bioinformatics, Rollins School of Public Health, Emory University, Atlanta; the Department of Psychiatry, Harvard Medical School and McLean Hospital, Belmont, Mass.; and the Department of Psychiatry and Behavioral Sciences, University of Miami Miller School of Medicine, Miami.
Becky Kinkead, Ph.D.
From the Department of Psychiatry and Behavioral Sciences, Emory University School of Medicine, Atlanta; the Department of Psychology, Emory University, Atlanta; the Department of Biostatistics and Bioinformatics, Rollins School of Public Health, Emory University, Atlanta; the Department of Psychiatry, Harvard Medical School and McLean Hospital, Belmont, Mass.; and the Department of Psychiatry and Behavioral Sciences, University of Miami Miller School of Medicine, Miami.
Charles B. Nemeroff, M.D., Ph.D.
From the Department of Psychiatry and Behavioral Sciences, Emory University School of Medicine, Atlanta; the Department of Psychology, Emory University, Atlanta; the Department of Biostatistics and Bioinformatics, Rollins School of Public Health, Emory University, Atlanta; the Department of Psychiatry, Harvard Medical School and McLean Hospital, Belmont, Mass.; and the Department of Psychiatry and Behavioral Sciences, University of Miami Miller School of Medicine, Miami.
Helen S. Mayberg, M.D.
From the Department of Psychiatry and Behavioral Sciences, Emory University School of Medicine, Atlanta; the Department of Psychology, Emory University, Atlanta; the Department of Biostatistics and Bioinformatics, Rollins School of Public Health, Emory University, Atlanta; the Department of Psychiatry, Harvard Medical School and McLean Hospital, Belmont, Mass.; and the Department of Psychiatry and Behavioral Sciences, University of Miami Miller School of Medicine, Miami.

Notes

Address correspondence to Dr. Dunlop ([email protected]).

Funding Information

National Institute of Mental Health10.13039/100000025: K23 MH086690, P50 MH077083, RO1 MH080880
National Center for Research Resources10.13039/100000097: M01 RR0039, UL1 RR025008
Dr. Dunlop has received research support from Assurex, Bristol-Myers Squibb, Forest, Janssen, GlaxoSmithKline, NIMH, Otsuka, Pfizer, and Takeda; and he has served as a consultant to Pfizer and Medavante. Dr. Craighead is a board member of Hugarheill EHF; he receives royalties from John Wiley and Sons; he is a consultant to the George West Mental Health Foundation; he is a member of the Scientific Advisory Board of ADAA; and he receives research support from the Mary and John Brock Foundation and the Fuqua Family Foundations. Dr. Nemeroff has received research support from NIH; he has served as a consultant to Allergan, Clintara/Bracket, Lilly, Lundbeck, Mitsubishi Tanaba Pharma Development America, Prismic Pharmaceuticals, SK Pharma, Sunovion, Taisho Pharmaceutical, Inc., Takeda, Total Pain Solutions, and Xhale; he has served on the scientific advisory boards of the American Foundation for Suicide Prevention, Anxiety Disorders Association of America, Brain and Behavior Research Foundation, Clintara/Bracket, Laureate Institute for Brain Research, RiverMend Health, LLC, Skyland Trail, and Xhale; he has served on the board of directors for ADAA, AFSP, and Gratitude America; he is a shareholder with Abbvie, Celgene, Seattle Genetics, Titan Pharmaceuticals, and Xhale; he has received income sources or equity of $10,000 or more from American Psychiatric Association Publishing, Clintara/Bracket, and Xhale; and he holds a patent on the method and devices for transdermal delivery of lithium (U.S. 6,375,990 B1) and the method of assessing antidepressant drug therapy via transport inhibition of monoamine neurotransmitters by ex vivo assay (U.S. 7,148,027B2). Dr. Mayberg has received consulting fees from Eli Lilly and St. Jude Medical Neuromodulation; and she has received intellectual property licensing fees from St. Jude Medical Neuromodulation. All other authors report no financial relationships with commercial interests.

Metrics & Citations

Metrics

Citations

Export Citations

If you have the appropriate software installed, you can download article citation data to the citation manager of your choice. Simply select your manager software from the list below and click Download.

For more information or tips please see 'Downloading to a citation manager' in the Help menu.

Format
Citation style
Style
Copy to clipboard

View Options

View options

PDF/EPUB

View PDF/EPUB

Login options

Already a subscriber? Access your subscription through your login credentials or your institution for full access to this article.

Personal login Institutional Login Open Athens login
Purchase Options

Purchase this article to access the full text.

PPV Articles - American Journal of Psychiatry

PPV Articles - American Journal of Psychiatry

Not a subscriber?

Subscribe Now / Learn More

PsychiatryOnline subscription options offer access to the DSM-5-TR® library, books, journals, CME, and patient resources. This all-in-one virtual library provides psychiatrists and mental health professionals with key resources for diagnosis, treatment, research, and professional development.

Need more help? PsychiatryOnline Customer Service may be reached by emailing [email protected] or by calling 800-368-5777 (in the U.S.) or 703-907-7322 (outside the U.S.).

Media

Figures

Other

Tables

Share

Share

Share article link

Share