Demographic and Clinical Characteristics
One participant in each group withdrew from the study because of physical discomfort during imaging, and data from one participant in the control group were excluded because of excessive head motion (the removal threshold was >3 mm displacement, and this participant averaged 12 mm), leaving a final sample of 18 experimental and 15 control participants.
At pretreatment visit 1 (
Table 1; see also Table S1 in the
data supplement), the groups did not differ significantly in mean age, time since last antidepressant medication, length of current depressive episode, or scores on the BDI-II, SHAPS, MADRS, HAM-D, or HAM-A. A Fisher’s exact test revealed no significant difference between groups in the proportion of females, number of major depressive episodes experienced, or number of previous antidepressant medications. Average depression scores were in the moderate severity range. Three-quarters of participants were chronically depressed, and more than half had previously received antidepressant pharmacotherapy.
Paired-sample t tests within each group were used to examine whether scores significantly changed from visit 1 to visit 4. In the experimental group, all ratings significantly decreased from visit 1 (MADRS: t=7.70, df=17, p<0.001, d=1.22; BDI-II: t=4.70, df=17, p<0.001, d=1.09; HAM-A: t=5.61, df=17, p<0.001, d=1.04; SHAPS: t=2.67, df=17, p=0.01, d=0.54). In the control group, HAM-A score decreased significantly from visit 1 (t=2.60, df=14, p=0.02, d=0.89), while the other ratings did not change significantly.
A linear mixed model using the Toeplitz covariance structure revealed a significant group-by-visit interaction (F values, >12.0; df=3, 53; p values, <0.001). As stated above, the groups did not differ significantly from each other in any score at visit 1; scores also did not differ between groups at visit 2. The experimental group had lower scores than the control group on the MADRS, BDI-II, and HAM-D at visit 3 (MADRS: t=1.61, df=32, p=0.01, d=0.90; BDI-II: t=2.06, df=32, p=0.04, d=0.71; HAM-D: t=2.61, df=32, p=0.01, d=0.66) and visit 4 (MADRS: t=3.40, df=32, p<0.001, d=1.17; BDI-II: t=2.17, df=32, p=0.03, d=0.74; HAM-D: t=2.64, df=32, p=0.01, d=0.92). SHAPS scores did not differ significantly between groups at visit 3 but were lower in the experimental group relative to the control group at visit 4 (t=3.40, df=32, p=0.002, d=0.54). HAM-A scores did not differ significantly between groups at any visit.
Twelve participants in the experimental group responded to neurofeedback (at least a 50% decrease in MADRS score), compared with two participants in the control group. Six participants in the experimental group and one in the control group met criteria for remission at study end (MADRS score <10), making a number needed to treat, assuming all dropouts were nonresponders, of 4 (95% CI=2, 50).
Neurofeedback Performance
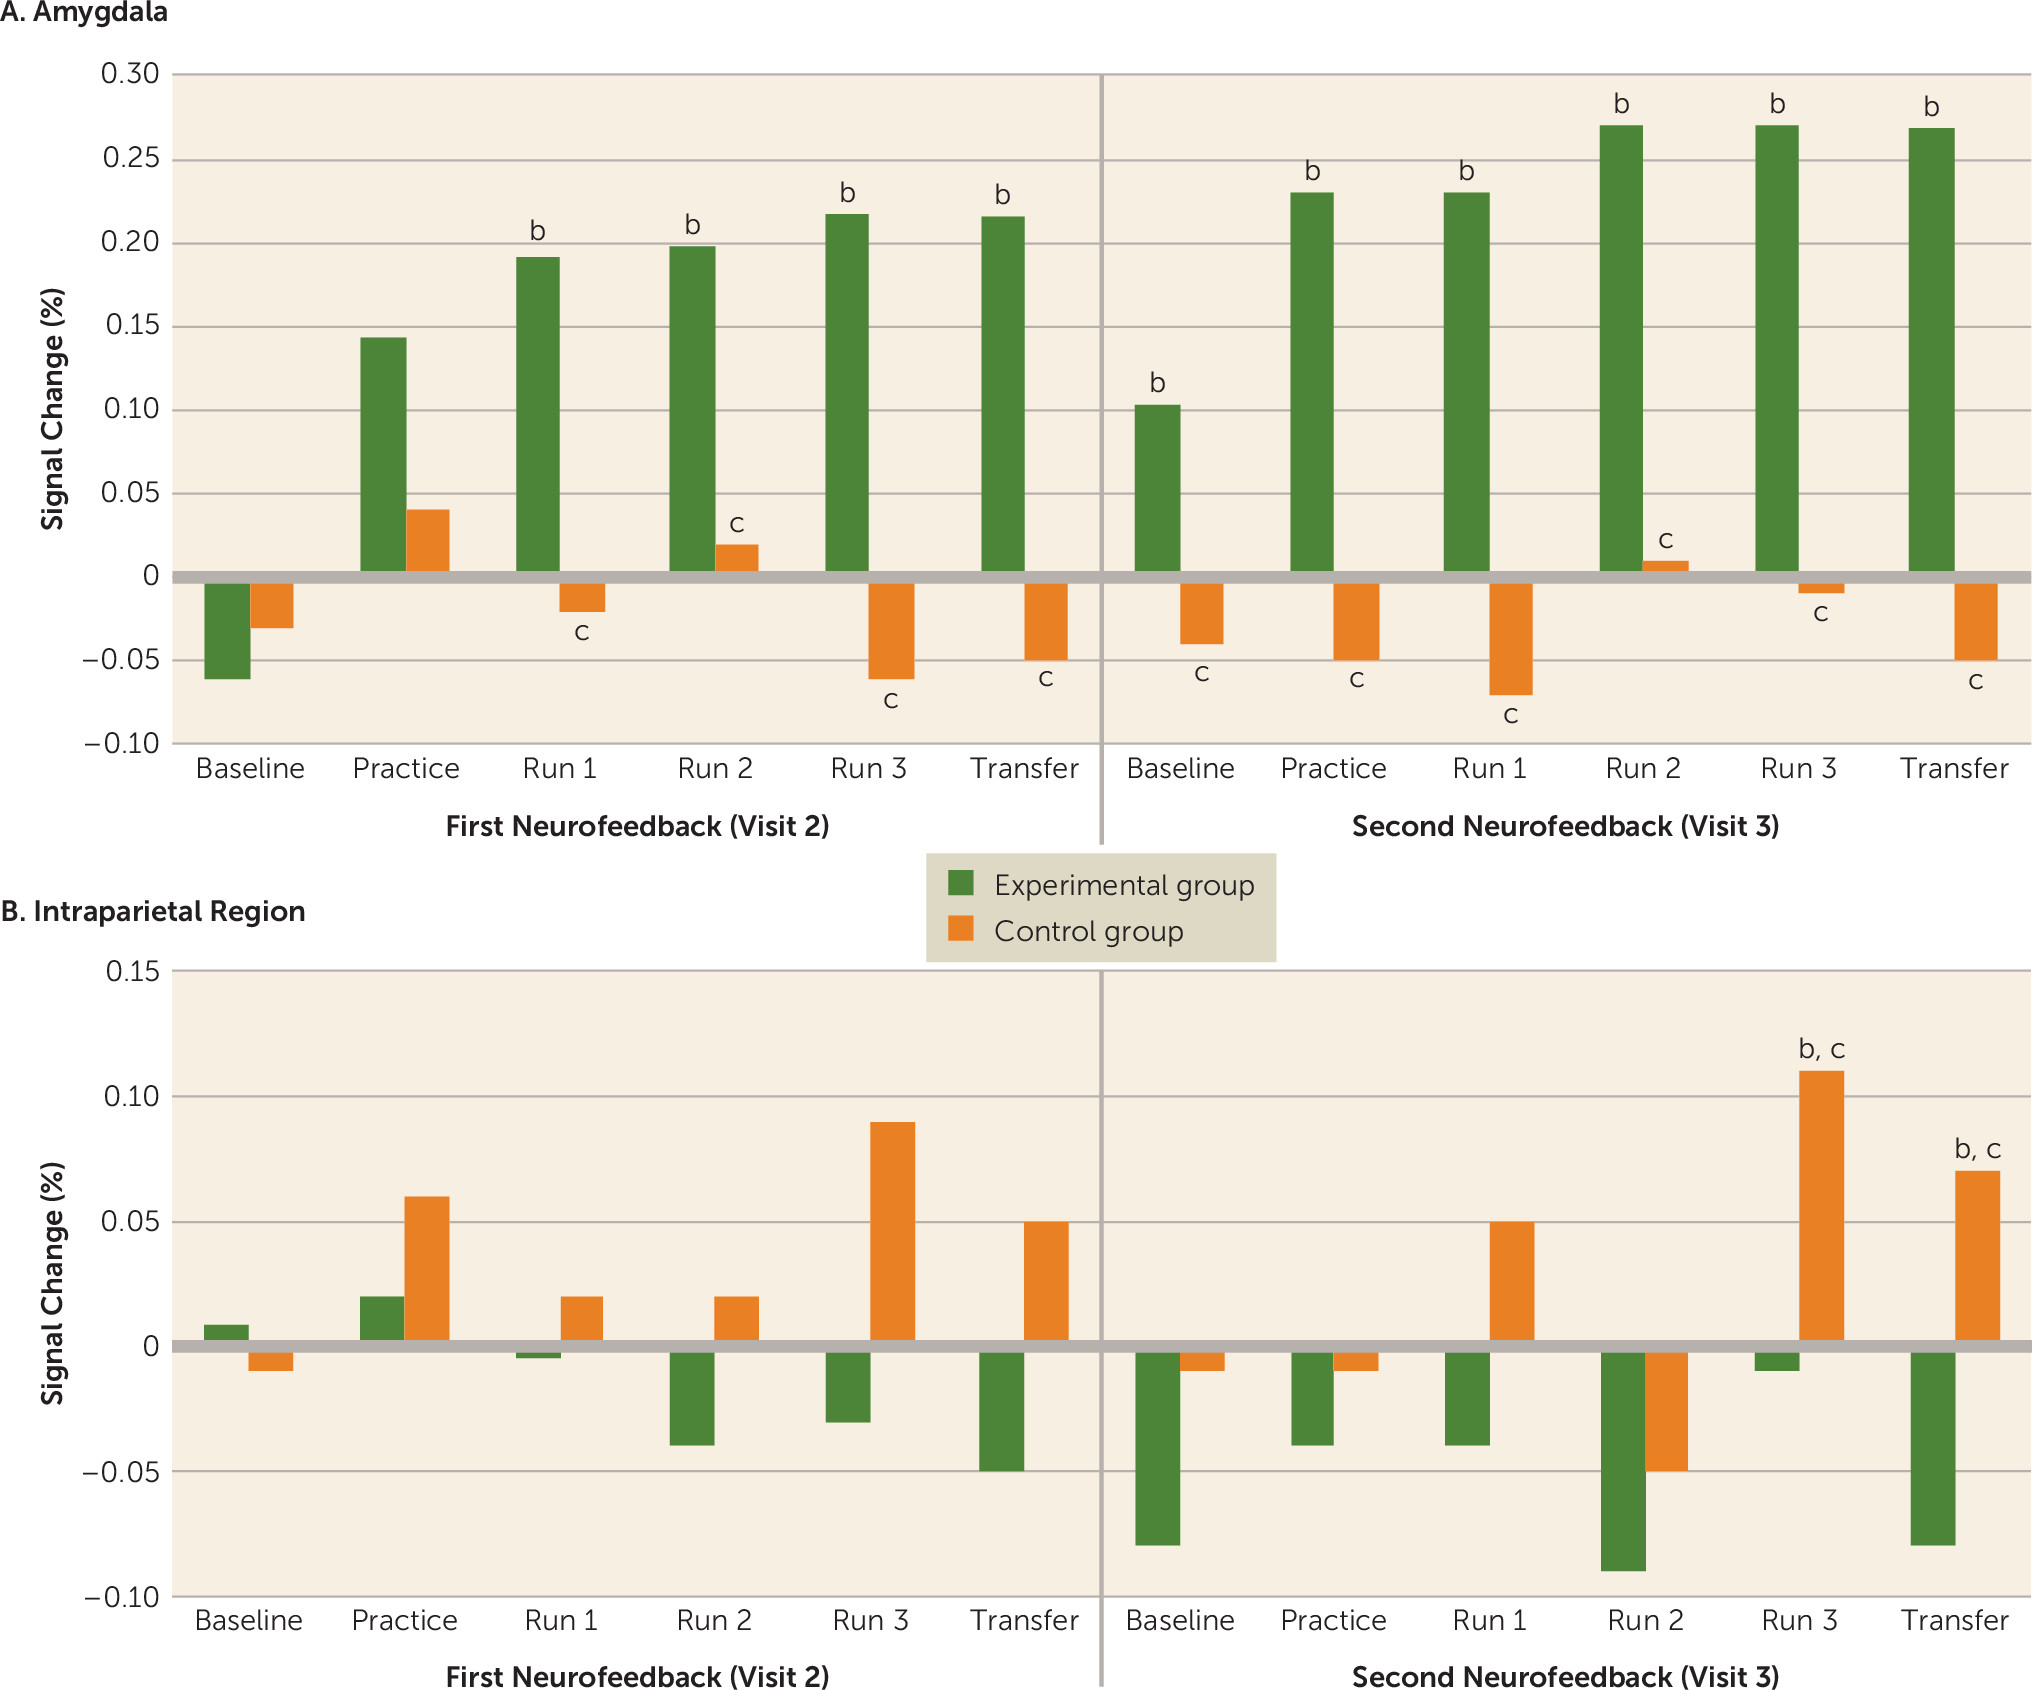
For the linear mixed model using the ARMA1 (autoregressive moving average) covariance structure, there were significant region of interest-by-group (F=4.97, df=1, 120, p=0.03) and region of interest-by-group-by-run-by-visit (F=2.37, df=5, 517, p=0.04) interactions. The region of interest-by-group interaction showed that the experimental group had significantly elevated amygdala activity compared with the control group (the mean percent signal change over all runs/days was 0.19 [SD=0.03] for the experimental group and −0.02 [SD=0.02] for the control group [t=7.63, df=403, p<0.001, d=1.44]). Within the intraparietal region, the average percent signal change was significantly higher in the control group than in the experimental group (mean over all runs/days, −0.06 [SD=0.04] for the experimental group and 0.03 [SD=0.02] for the control group [t=2.74, df=403, p=0.04, d=0.89]).
The region of interest-by-group-by-run-by-visit interaction (
Figure 1A) showed that the groups did not differ significantly in amygdala activity during the visit 2 baseline or practice but differed significantly from each other during all subsequent runs (t values, >2.52; df=31; p values, <0.02; d values, >0.87). The control group had significantly higher intraparietal activity than the experimental group during the third training and transfer runs at visit 3 (t values, >2.34; df=31; p values, <0.03; d values, >0.84) but did not differ significantly from the experimental group at any other run.
Paired-sample t tests were performed to examine whether activity increased significantly from pre-neurofeedback baseline in each group and run. In the control group, there was no run in which amygdala activity differed significantly from baseline. In the experimental group, amygdala activity during the visit 2 practice run was not significantly elevated above baseline, but all subsequent runs, including visit 3 baseline and both transfer runs, were (t values, >2.67; df=17; p values, <0.02; d values, >0.61). In the intraparietal region (
Figure 1B), the control group had significantly increased intraparietal activity from baseline during run 3 and the final transfer run at visit 3 (t values, >2.42; df=14; p values, <0.02; d values, >0.69). No other runs showed a significant change in the control group. In the experimental group, there was no run in which intraparietal activity differed from baseline. An independent-samples t test comparing neurofeedback success in the experimental group (for amygdala activity) and the control group (for intraparietal activity) was not significant, indicating that by study end the control group was as effective at regulating hemodynamic activity in the intraparietal region as the experimental group was at regulating activity in the amygdala.
Autobiographical Memory Performance
For the linear mixed model using the ARMA1 covariance structure, there was a significant group-by-visit-by-type interaction (F=29.2, df=3, 61, p<0.001) and a significant group-by-visit-by-type-by-valence interaction (F=5.58, df=3, 66, p=0.002) (
Table 2).
The group-by-visit-by-type interaction revealed that at visit 1, the groups did not differ significantly on the percent of memories recalled at any specificity. At visit 4, the experimental group recalled more specific and fewer categorical and extended memories than the control group (t values, >3.03; df=54; p values, <0.004; d values, >0.74). The percent of semantic memories recalled did not differ at visit 4. The group-by-type-by-valence-by-visit interaction revealed that these effects were driven by a change in the percent of positive memories recalled. The experimental group recalled more positive specific memories at visit 4 than the control group (t=2.87, df=31, p<0.001, d=0.99) but did not differ in the percent of specific negative memories recalled at visit 4. The experimental group recalled fewer positive categorical and extended memories than the control group at visit 4 (t values, >2.40; df=31; p values, <0.02; d values, >0.83). The percent of distinctly valenced semantic memories recalled did not differ between groups, and in no case did any score at visit 1 differ between groups.
Paired-sample t tests were performed within each group to examine whether scores significantly changed from baseline to follow-up. In the experimental group, the percent of positive specific and overall specific memories recalled increased significantly (t values, >4.59; df=17; p values, <0.001; d values, >1.10) and the percent of categorical positive, overall categorical, extended positive, extended negative, and overall extended memories recalled decreased significantly at visit 4 relative to visit 1 (t values, >2.32; df=17; p values, <0.03; d values, >0.60). In the control group, there was no significant change in memory recall.
Association Between Memory Recall, Neurofeedback Success, and MADRS Change
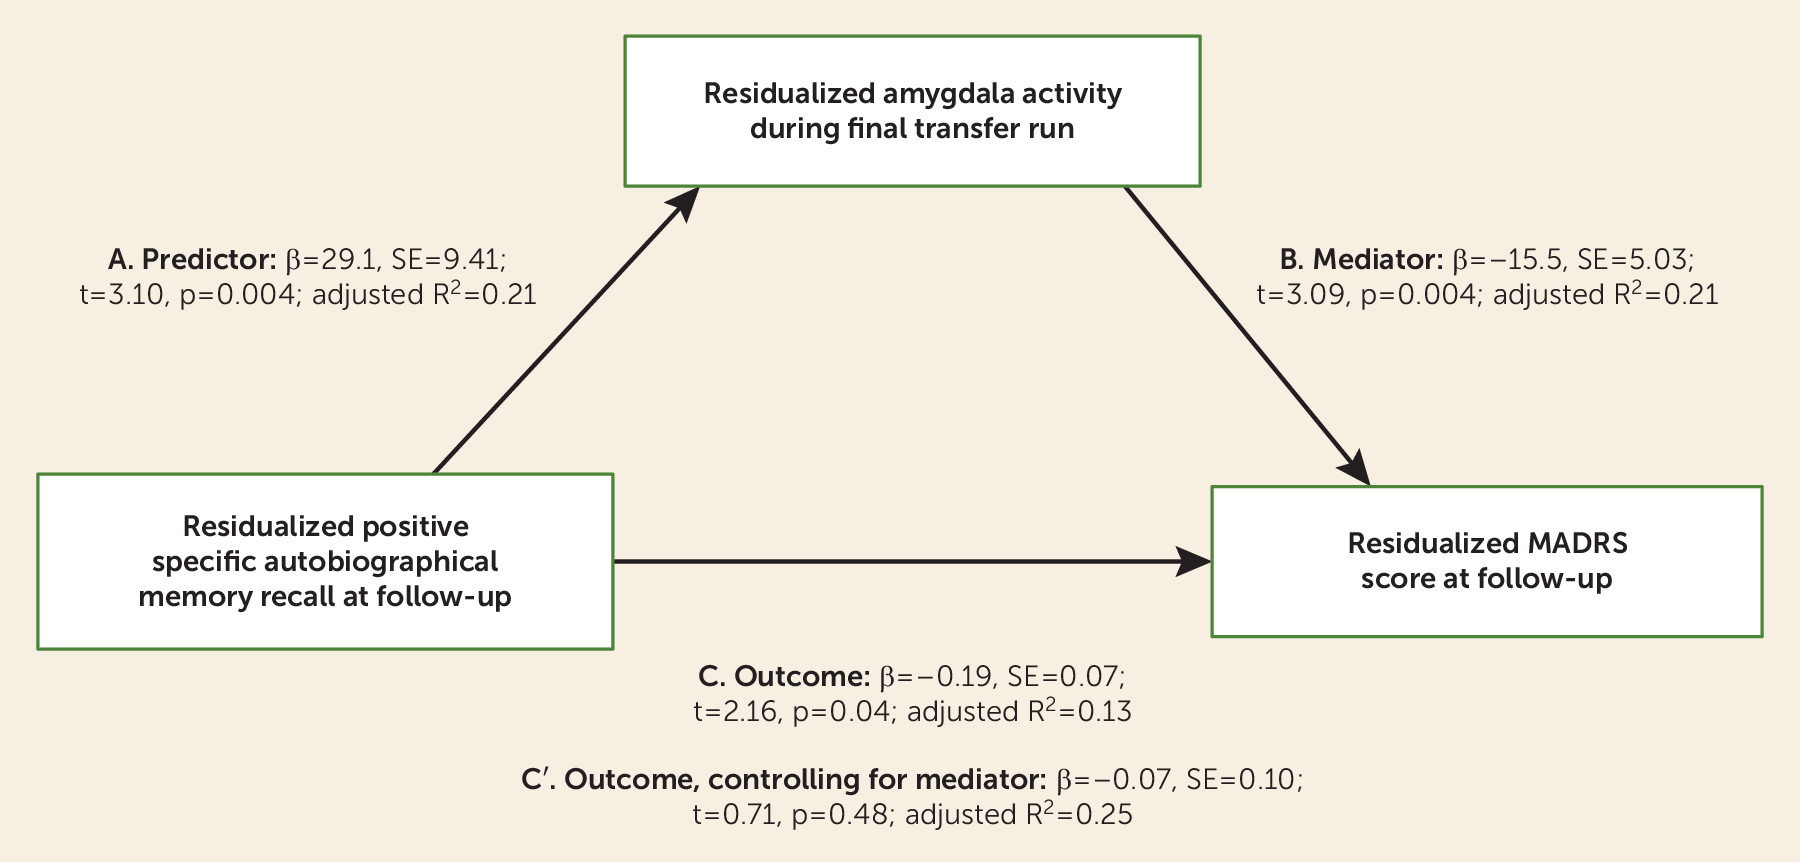
Using linear regression, we examined the association between residualized MADRS scores at follow-up and residualized amygdala activity during the final transfer run. Residual MADRS scores at the final visit were significantly correlated with residual amygdala activity during the final transfer run (β=−15.5, t=3.09, p=0.004; adjusted R2=0.21). While the association with intraparietal success was in the same direction, it was not significant (β=−2.46, t=0.81, p=0.43; adjusted R2=0.09), and it was significantly different from the model examining the association between residual amygdala activity and residual MADRS scores (z=2.66, p=0.004).
A regression analysis was performed for residual positive specific memory recall and residual MADRS scores at follow-up. The same pattern was seen as with amygdala neurofeedback success; residual positive specific memory recall was associated with decreased residual MADRS scores (β=−0.19, t=2.16, p=0.04; adjusted R2=0.13). Residual positive specific memory recall was also significantly associated with residual amygdala activity during the final transfer run (β=29.1, t=3.10, p=0.004; adjusted R2=0.21).
To determine whether residual amygdala activity was a mediator of the association between residual positive specific memory recall and residual MADRS change, we performed a Sobel test, which was significant (Z=2.18, p=0.03) (
Figure 2). When both residual amygdala activity and residual positive specific memory recall were included in the model, the effects of memory recall were no longer significant (β=−0.07, t=0.71, p=0.48), while amygdala activity was (β=13.5, t=2.33, p=0.027; final model adjusted R
2=0.25).


