Full access
Articles
Published Online: 18 August 2017

The Role of Intrinsic Brain Functional Connectivity in Vulnerability and Resilience to Bipolar Disorder

Abstract

Objective:

Bipolar disorder is a heritable disorder characterized by mood dysregulation associated with brain functional dysconnectivity. Previous research has focused on the detection of risk- and disease-associated dysconnectivity in individuals with bipolar disorder and their first-degree relatives. The present study seeks to identify adaptive brain connectivity features associated with resilience, defined here as avoidance of illness or delayed illness onset in unaffected siblings of patients with bipolar disorder.

Method:

Graph theoretical methods were used to examine global and regional brain network topology in head-motion-corrected resting-state functional MRI data acquired from 78 patients with bipolar disorder, 64 unaffected siblings, and 41 healthy volunteers.

Results:

Global network properties were preserved in patients and their siblings while both groups showed reductions in the cohesiveness of the sensorimotor network. In the patient group, these sensorimotor network abnormalities were coupled with reduced integration of core default mode network regions in the ventromedial cortex and hippocampus. Conversely, integration of the default mode network was increased in the sibling group compared with both the patient group and the healthy volunteer group.

Conclusions:

The authors found that trait-related vulnerability to bipolar disorder was associated with reduced resting-state cohesiveness of the sensorimotor network in patients with bipolar disorder. However, integration of the default mode network emerged as a key feature differentiating disease expression and resilience between the patients and their siblings. This is indicative of the presence of neural mechanisms that may promote resilience, or at least delay illness onset.
Bipolar disorder is characterized by mood dysregulation associated with alterations in brain connectivity. Resting-state functional MRI (fMRI) studies in bipolar disorder have shown that disease mechanisms influence intrinsic connectivity, including that of the default mode, sensorimotor, and central executive networks (13). Imbalance between the functional connectivity of the sensorimotor and default mode networks has been directly linked with the clinical expression of bipolar disorder, as illustrated in a recent study (2) that found the sensorimotor and default mode networks showing opposite variability patterns during depressive and manic episodes.
Bipolar disorder is highly heritable (4), but the pathway from genetic risk to clinical symptoms is not fully understood. Siblings of patients have about a 10-fold higher risk than the general population, with the mean weighted prevalence of bipolar disorder (all subtypes included) in siblings estimated at 11.9% (5). Disease expression and familial risk for bipolar disorder influence the functional connectivity of brain regions involved mainly in the default mode network, the mesolimbic network, and the central executive network (1, 3, 6). These neural systems–level alterations in individuals with a familial risk of bipolar disorder are thought to occupy an intermediate location on the path from genetic risk to disorder (3, 7). However, despite harboring risk-related features, a significant proportion of relatives remain psychiatrically well. In addition, there is emerging evidence that some measures of brain functional (810) and structural connectivity (9, 11) appear to index the avoidance or delayed onset of bipolar disorder in unaffected siblings, suggesting that these measures may involve mechanisms that actively counteract risk. Unaffected relatives may develop psychiatric morbidity at some future point, but as long as they remain well, they may manifest protective changes in brain connectivity. We consider such measures as indicators of “resilience” in relation to avoidance or delayed disease onset.
Here we describe a graph theoretical approach that seeks to disambiguate brain features of risk, disease expression, and resilience to bipolar disorder. Graph theory models the brain as a graph with regions and their connections represented as nodes and edges; its advantage over conventional approaches is that it offers tools to evaluate brain connectivity at the global and regional levels in accordance with the multiscale nature of human brain architecture (12). We obtained resting-state fMRI data from patients with bipolar disorder, their unaffected siblings, and demographically matched unrelated healthy individuals. This design enabled us to characterize trait-related changes in brain connectivity associated with vulnerability and disease expression in bipolar disorder. We focused on 1) global connectivity, assessed by measures of global efficiency and characteristic path length (two measures of network integration), clustering coefficient (a measure of network segregation), and small-worldness (a measure of the balance between segregation and integration); 2) mesoscale connectivity, assessed by network modularity over a range of spatial scales; and 3) regional connectivity, assessed by nodal degree (a measure of a region’s putative influence on the network) and participation coefficient (a measure of the extent to which a given node connects to nodes in modules other than its own).

Method

Sample

Patients with bipolar I disorder (N=78), their unaffected siblings (N=64), and unrelated healthy volunteers (N=41) were recruited from psychiatric facilities and community advertisements in Hartford, Conn. (Further details on recruitment and assessment are provided in the data supplement that accompanies the online edition of this article.) Patients were included if they met DSM-IV criteria for bipolar I disorder based on the Structured Clinical Interview for DSM-IV disorders; had no current substance abuse or dependence; had no history of major medical or neurological conditions; had an IQ >80; and had a sibling willing to participate in the study. Eligibility criteria for siblings and unrelated healthy volunteers were identical to those for patients, with the exception of a personal diagnosis of bipolar or psychosis spectrum disorders. In addition, unrelated healthy volunteers could not have a family history of mood or psychotic disorders. The three groups were matched on sex, age, IQ, and head motion during scanning. Table 1 summarizes the participants’ characteristics (for head motion, see Table S1 in the online data supplement). All participants provided informed consent as approved by the institutional review board at Hartford Hospital and Yale University.
TABLE 1. Demographic and Clinical Characteristics of Patients With Bipolar Disorder, Unaffected Siblings, and Healthy Volunteers in a Study of Brain Connectivity in Vulnerability and Resilience to Bipolar Disordera
MeasurePatients With Bipolar Disorder (N=78)Unaffected Siblings (N=64)Healthy Volunteers (N=41)
 N%N%N%
Demographic characteristics      
Female526737582868
 MeanSDMeanSDMeanSD
Age (years)341332133312
Age at illness onset (years)197    
Illness duration (years)1512    
Education (years)142152152
Full-scale IQ105171042010817
Clinical measures      
Brief Psychiatric Rating Scaleb32.78.725.7224.61.2
Hamilton Depression Rating Scaleb7.47.31.21.70.50.9
Young Mania Rating Scaleb5.76.80.61.10.20.6
 N%N%N%
Non-bipolar diagnoses      
Previous substance abuse111422410
Posttraumatic stress disorder002312
Anxiety disorder003500
Major depressive disorder001200
Medicationsc      
Antidepressant22286912
Antipsychotic24313500
Mood stabilizer (lithium)34440000
Multiple agents (≥3)12150000
None151957894098
a
No significant differences between groups except as otherwise noted.
b
Significant difference between groups (<0.001), patients > siblings = healthy volunteers.
c
Medication percentages do not add up to 100 because some participants were on multiple agents.
Given the pooled estimates of 11.9% (SD=4) for the prevalence of bipolar disorder in siblings of patients (5), three to 12 siblings might convert at some future point, within a 95% confidence interval. Moreover, most of the siblings in this sample have gone past the critical risk period because of their age, since the risk of bipolar disorder after age 30 is very low (13). In addition, siblings and patients have remained discordant for a mean period of 15 years, which further reduces the likelihood of disease transition in the healthy siblings (see the online data supplement for additional analyses assessing the resilience of the siblings).

Neuroimaging

All MRI scans were collected at the Olin Neuropsychiatry Research Center, Institute of Living, Hartford Hospital, using a research-dedicated Siemens Allegra 3-T scanner. Details of MRI acquisition and preprocessing, including motion correction and parcellation into regions of interest using a validated template (14, 15), are provided in the online data supplement. For each participant, the mean blood-oxygen-level-dependent time course of each region of interest was computed by averaging the time series of all voxels within that region. A matrix (620×620) was created for each participant by computing the Pearson correlation coefficients between time courses for each pair of regions of interest. Correlations were then Fisher r-to-z transformed.

Computation of global and regional connectivity measures.

These measures were estimated using MATLAB code in the Brain Connectivity Toolbox (www.brain-connectivity-toolbox.net). To compute each measure, a series of binarized matrices were produced using different thresholds, ranging from the top 1% to 50% of all connections, in increments of 1%, because network measures are less prone to nonbiological artifacts and noise in this density range (16). Negative correlations were set to zero, excluding an average of 42% of the connections (range, 20%–49%).
Global network measures included global efficiency and characteristic path length, two measures of network integration; clustering coefficient, a measure of network segregation; small-worldness, a measure of the balance between integration and segregation; and network robustness to targeted and random attack. Regional measures included nodal degree, equal to the number of links between a node and other nodes; and participation coefficient, a measure of intermodule connectivity. To correct for movement artifacts, the averaged head motion was regressed out from the graph-metric values. Detailed definitions of each measure are provided in the online data supplement.
Functional data analysis was used to assess group differences (17). This analysis is a statistical method that treats a metric curve as a function of the connection density. For each significant metric, we computed the average curve for each group separately (with threshold density on the x-axis and graph metrics on the y-axis). We then computed the area between the two curves (associated with the two groups) by summing the differences between the y values (graph-metric values) of the two groups at each value of x (corresponding to the connection densities). The difference between the two groups was tested for significance using nonparametric permutation testing, whereby the group identity of each individual was randomly reassigned without replacement. Average curves for the two pseudo groups were determined, and the area between the two curves was estimated. This process was repeated 5,000 times to create a set of 5,000 curve differences values. The p value of the true group difference was defined as the number of times the random curve values were greater than the true curve value, divided by the number of iterations.

Computation of mesoscale measures (brain modularity).

We used a validated Louvain-like locally greedy algorithm implemented in MATLAB (18) to partition the resting-state data of each participant into networks (i.e., groups of brain regions with dense functional interconnectivity) and extract the constituent modules. Details of the procedure and computations involved are provided in the online data supplement. For each individual, we extracted the number, size, and structure of the modules, and we computed the Z-score of the Rand coefficient, an index of topological similarity between each individual partition and the average normative partition (derived from the healthy volunteers) (19). Lastly, we calculated the within-module and between-module functional connectivity for each individual (20). Within-module connectivity is the mean strength of the functional connectivity within a module M, and between-module connectivity is the mean strength of functional connectivity between a module and all other modules. To correct for movement artifacts, the averaged head motion was regressed out and the residuals were entered into Kruskal-Wallis tests to assess group differences for each measure.
For the global and mesoscale level analyses, we first tested for an effect of group (patients, siblings, healthy volunteers), setting the threshold for statistical significance at the 5% level using false discovery rate correction (21). When indicated, we conducted post hoc pairwise analyses to test for differences in connectivity metrics between the three groups at p<0.05. For the regional level, the significant values were set at p<0.05 following permutation testing. When pairwise differences were significant, we provided estimates of effect size (Cohen’s d).
All connectivity analyses were conducted twice, with and without regressing the effect of age and sex; additional analyses were undertaken to examine the effect of medication and clinical features. These calculations are described in detail in the online data supplement, as they did not have an impact on the results.

Results

Global Connectivity

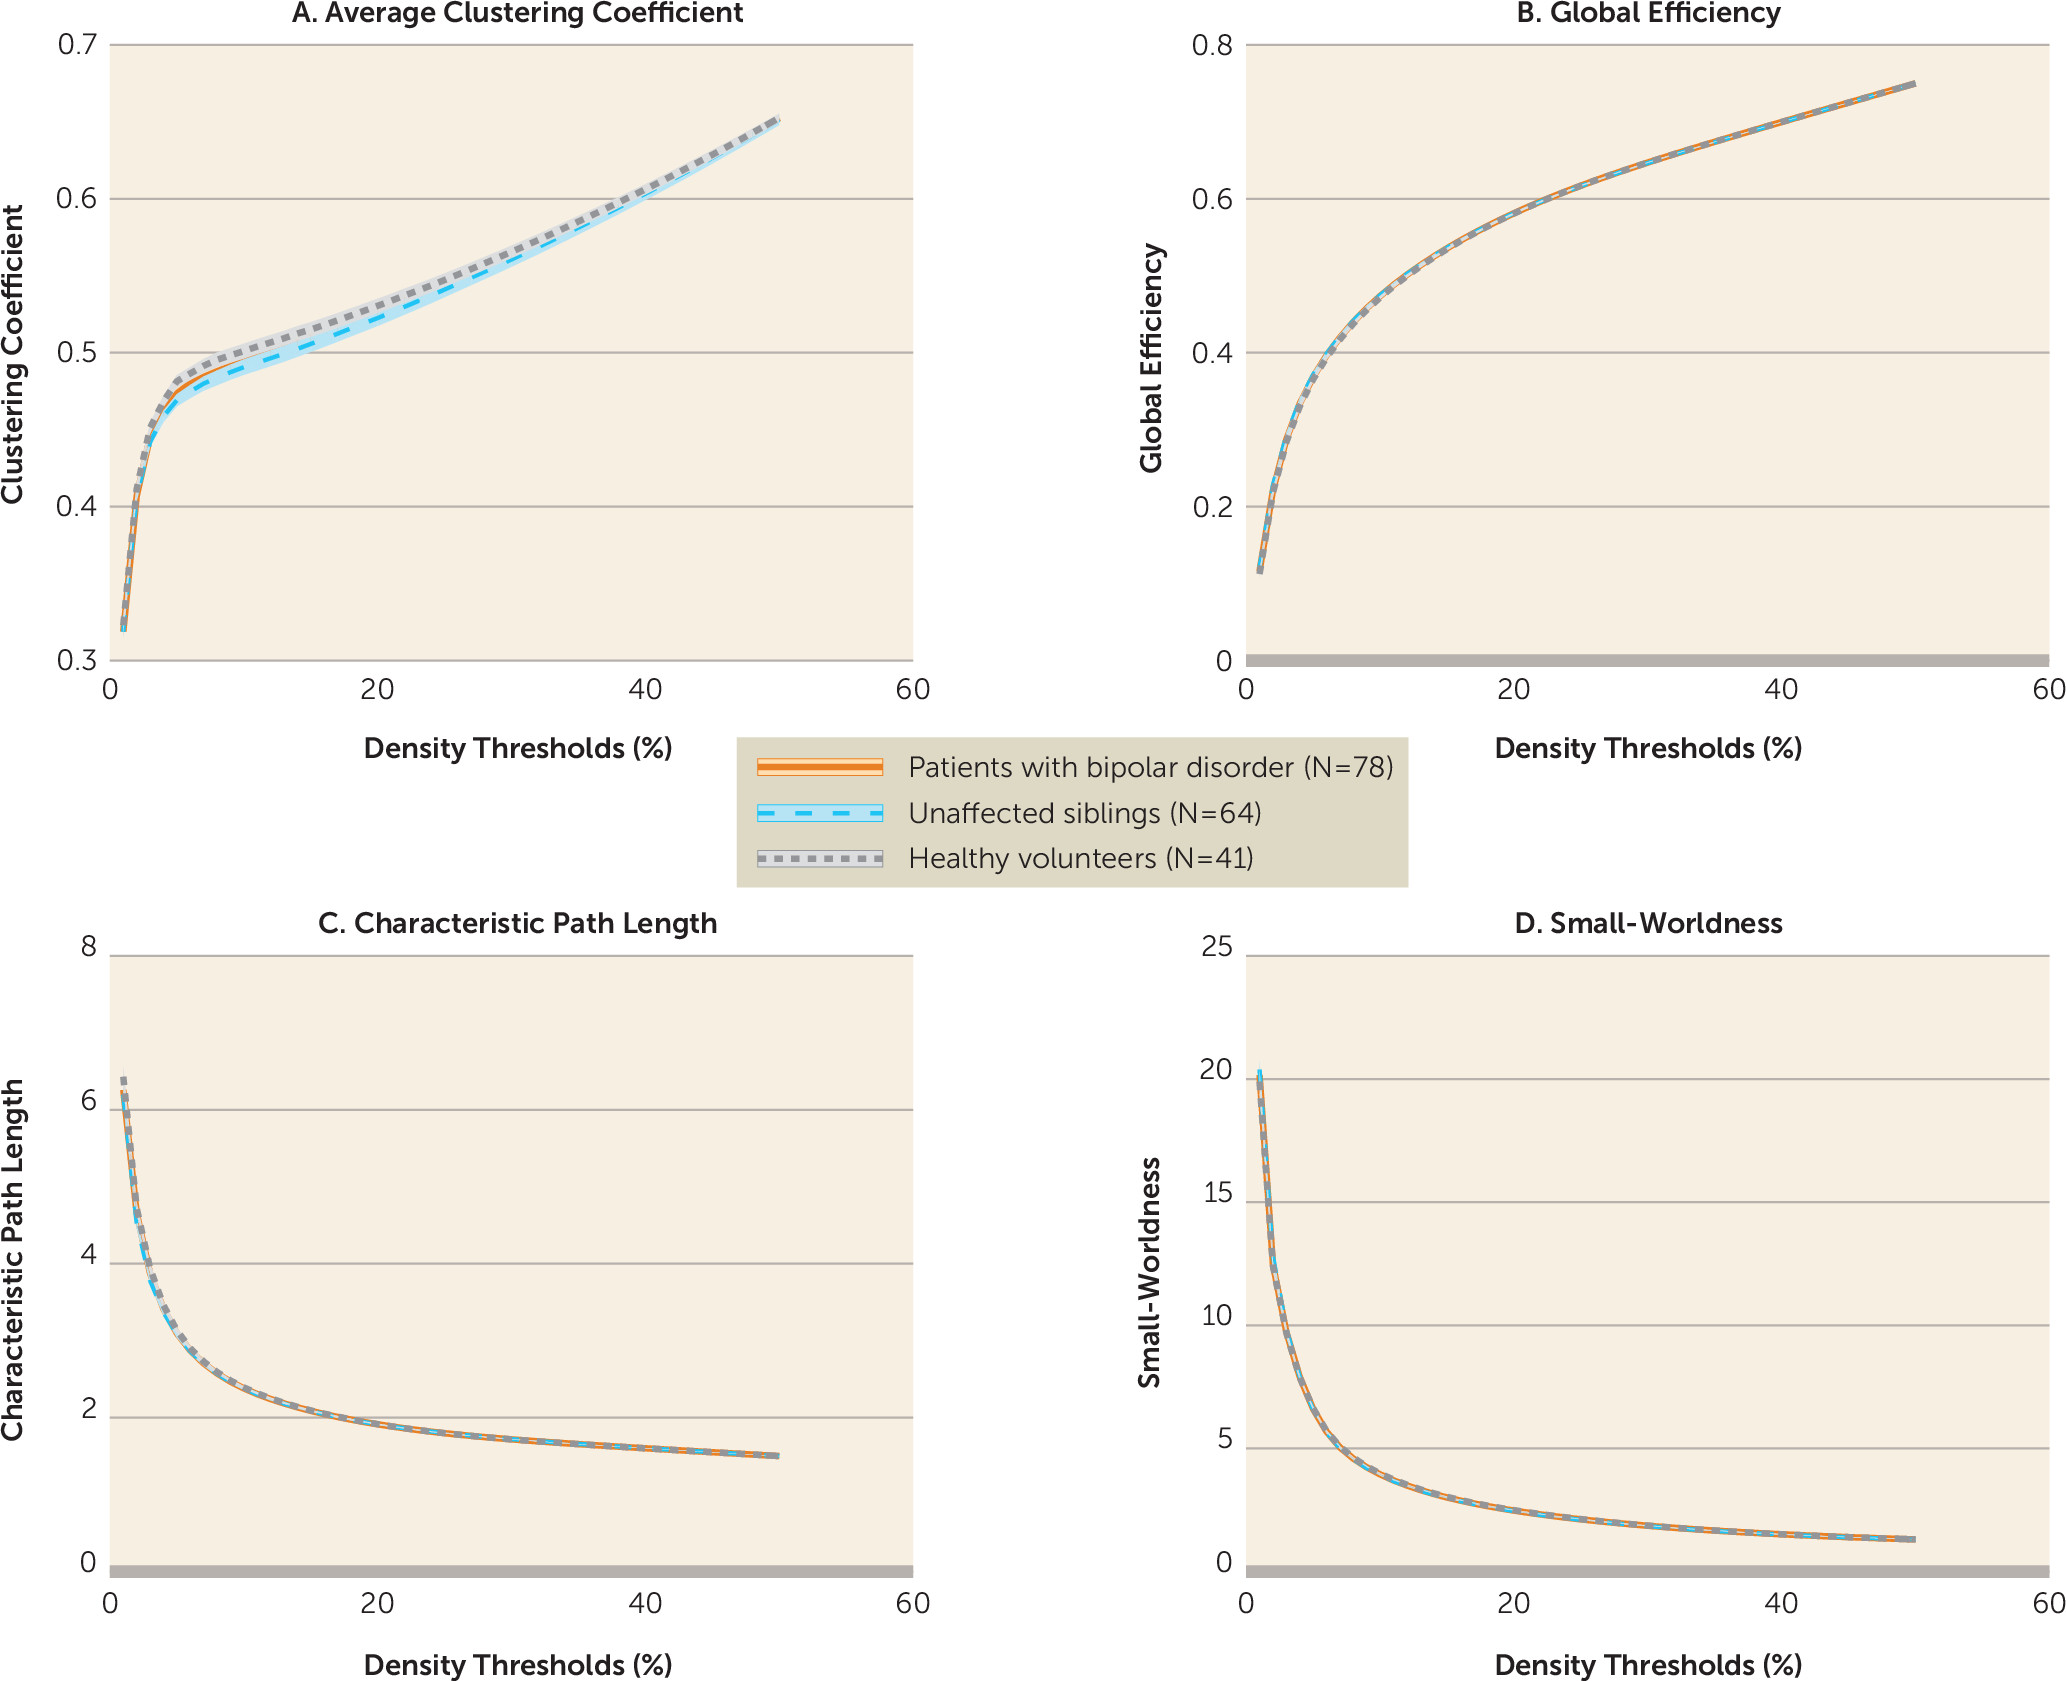
No significant group differences were observed in any of the global graph-theory metrics, even at an uncorrected p threshold of 0.05 (Figure 1), including network robustness to random and targeted attack (see Figure S2 in the data supplement).
FIGURE 1. Global Topological Measures of the Brain in Patients With Bipolar Disorder, Unaffected Siblings, and Healthy Volunteersa
a Confidence intervals on the curves represent one standard deviation. The graphs show average clustering coefficient, global efficiency, characteristic path length, and small-worldness as a function of connection density. There were no significant differences between groups after correction for false discovery rate.

Mesoscale Connectivity (Brain Modularity)

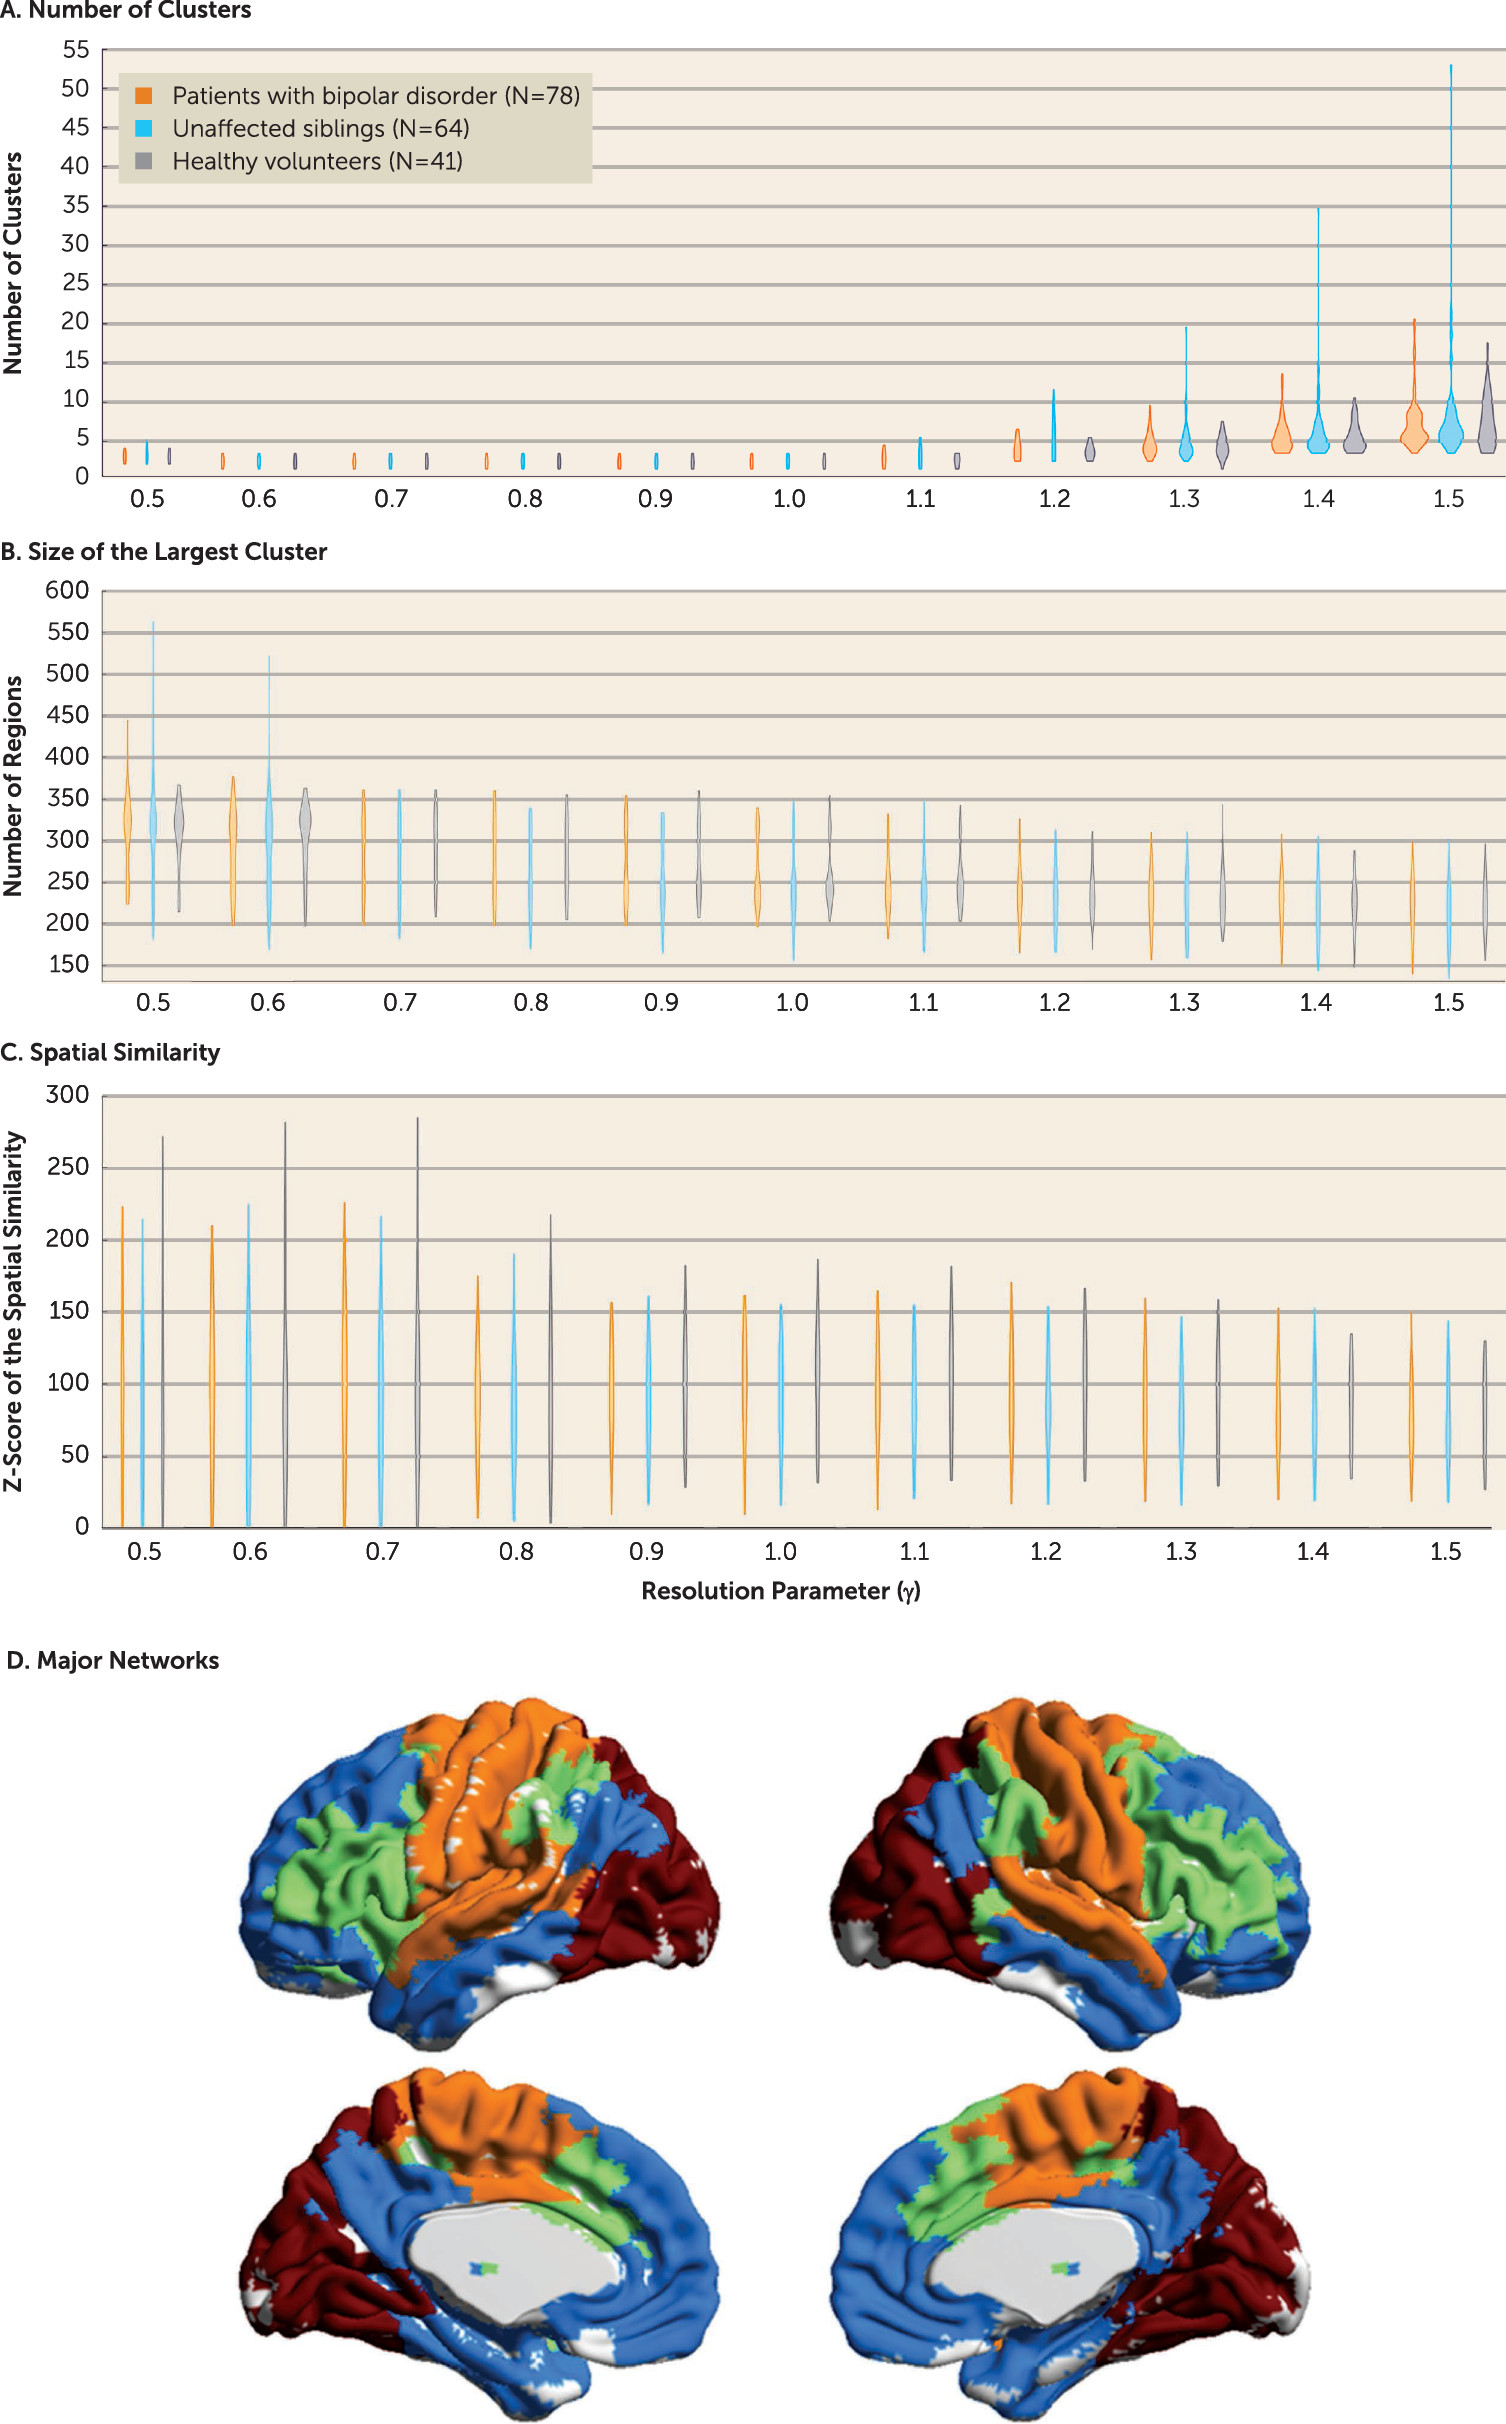
Consistent with previous research (20), we identified four major networks: the default mode network, the central executive network, the sensorimotor network, and the visual network (Figure 2D). There were no significant group differences in the number (Figure 2A), size (Figure 2B), or structure (based on the Z-rand similarity index) (Figure 2C) of the modules at any spatial scale tested (as titrated by the structural resolution parameter), even at an uncorrected p threshold of 0.05. In contrast, there was a significant group effect for within-module connectivity for the sensorimotor network (Kruskal-Wallis post hoc test: H=13.1, p=0.01). Within-module connectivity reduction was associated with familial risk for bipolar disorder, as it was reduced both in individuals with bipolar disorder (H=−31.9, p=0.005, Bonferroni corrected; Cohen’s d=0.58) and their siblings (H=−35.8, p=0.002, Bonferroni corrected; Cohen’s d=0.57) compared with healthy volunteers (see Figure S3 in the data supplement).
FIGURE 2. Brain Modularity in Patients With Bipolar Disorder, Unaffected Siblings, and Healthy Volunteersa
a Panels A–C are violin plots displaying the number of clusters, the size of the largest cluster, and the topological similarity (Z-score of Rand coefficient) as a function of the resolution parameter ɣ. Panel D illustrates the brain modularity at ɣ=1 for the healthy volunteer group (based on the averaged functional connectivity matrix within the group). The orange module covers the sensorimotor network, the green module covers the central executive network, the blue module covers the default mode network, and the brown module covers the visual network. No significant differences between groups were found after correction for false discovery rate.

Regional Connectivity

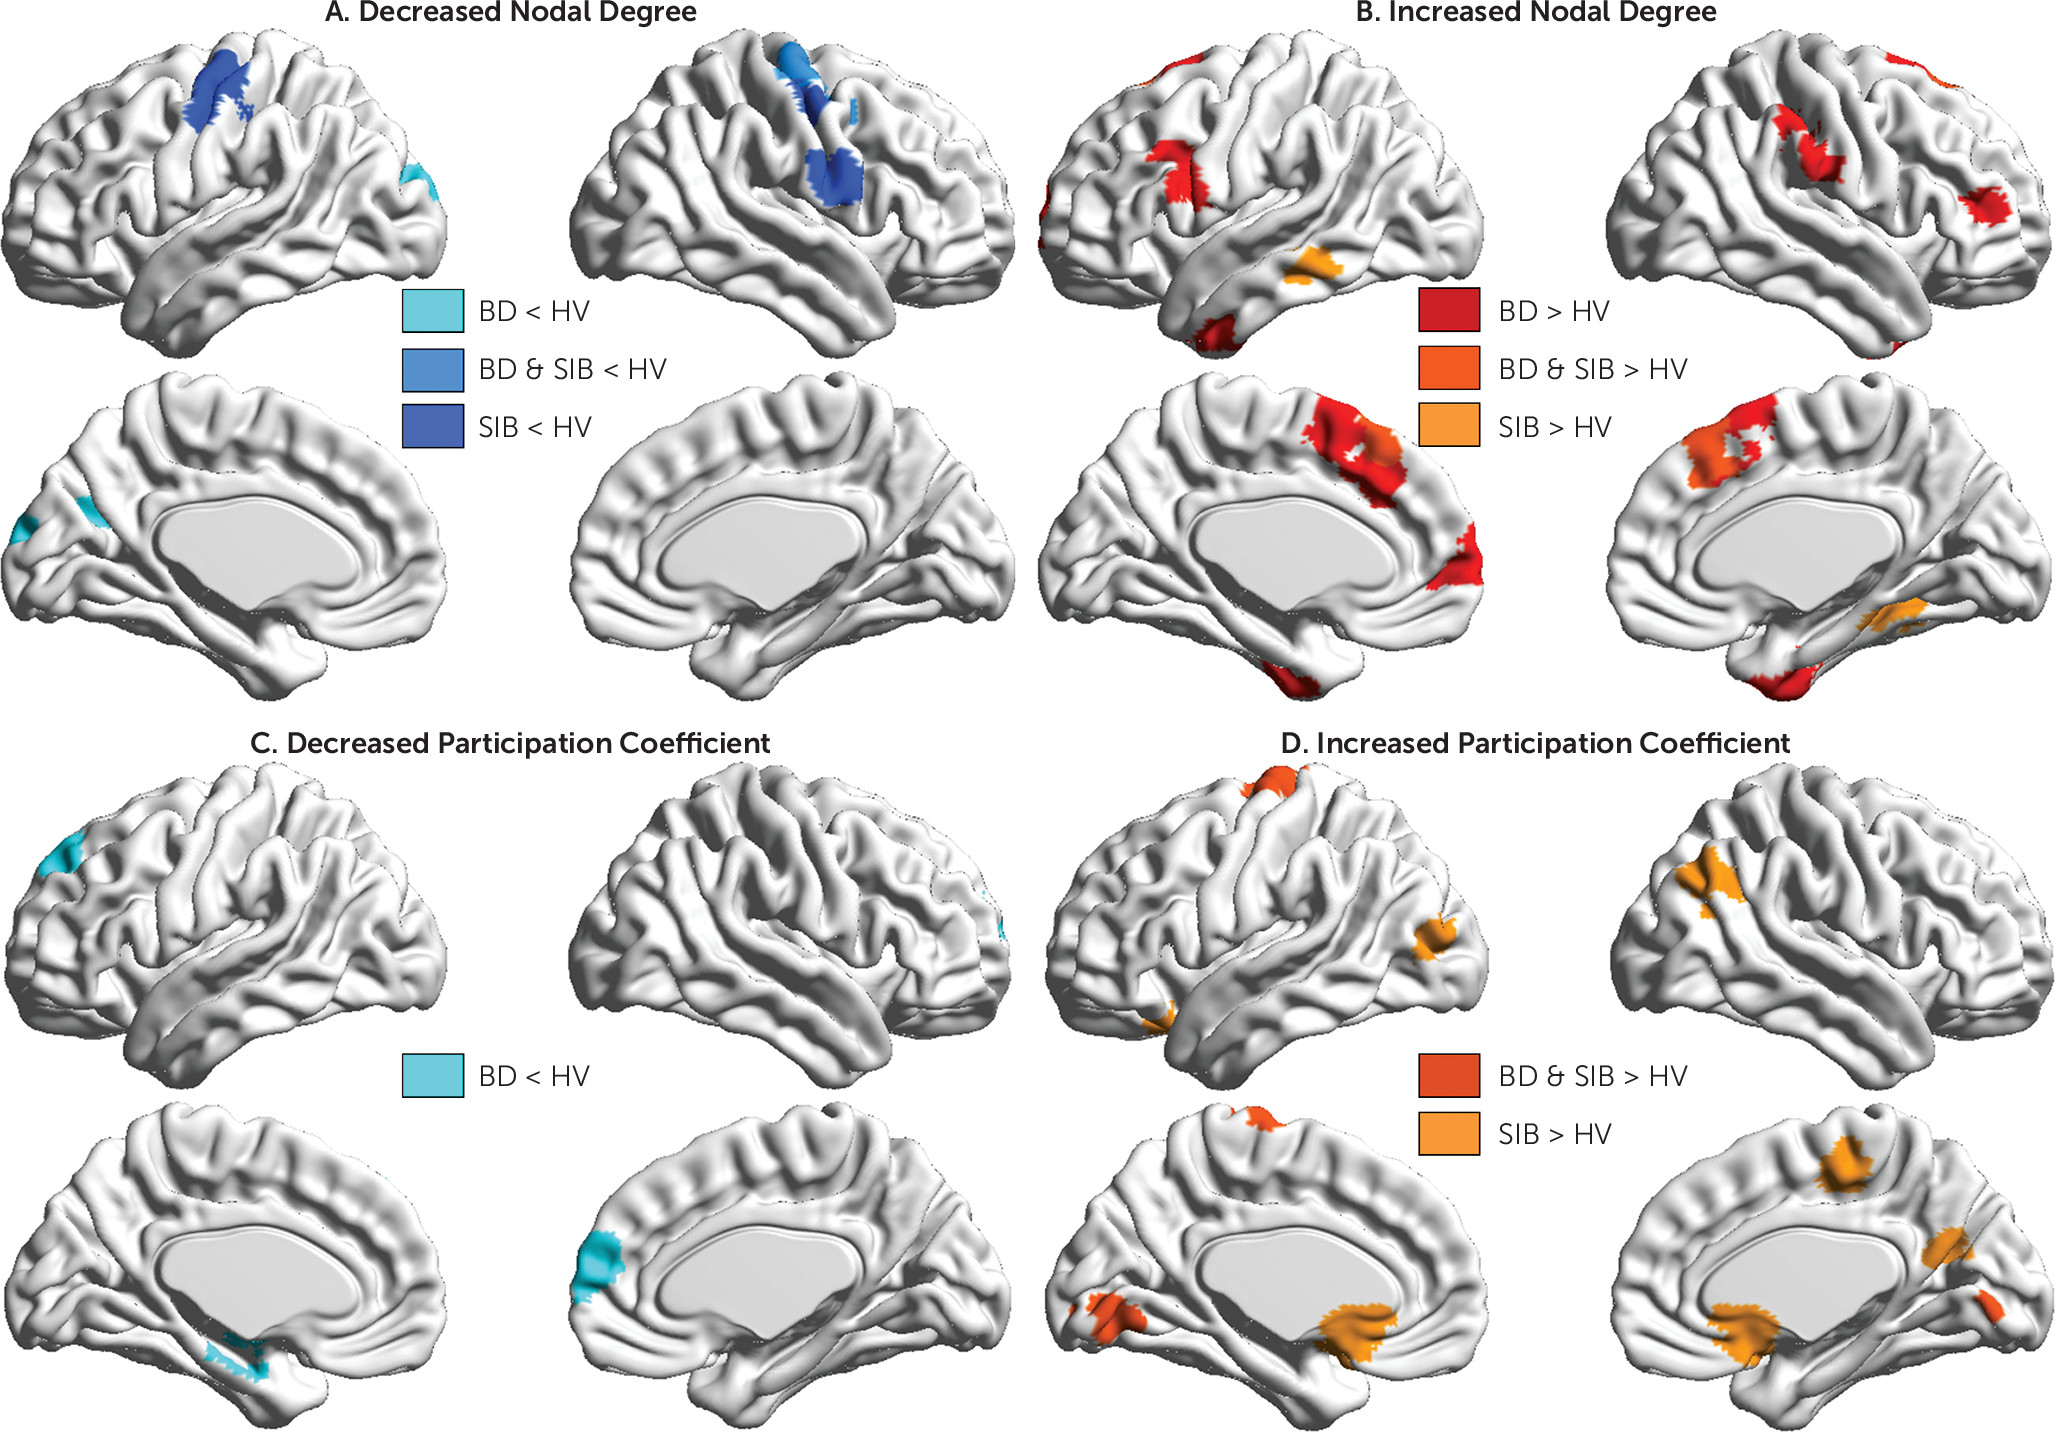
We found group differences in nodal degree and participation coefficient, primarily in regions that are part of the sensorimotor and default mode networks (Figure 3), as detailed in Tables S2 and S3 and Figure S4 in the data supplement. Specifically, disease expression was associated with connectivity changes that differentiated patients both from their siblings and healthy volunteers; patients showed 1) increased nodal degree in higher-order cortical regions (supplementary motor area, middle frontal gyrus, supramarginal gyrus) and the ventromedial prefrontal cortex (medial frontal gyrus) and 2) reduced participation coefficient of the ventromedial prefrontal cortex and the hippocampus. The connectivity changes that are common in patients and siblings were considered as evidence of shared familial risk that define a state of vulnerability to bipolar disorder but are not sufficient for disease expression. Both patients and their siblings showed 1) reduced nodal degree and increased participation coefficient in regions of the sensorimotor network (pre- and postcentral gyri, paracentral lobule) and 2) increased nodal degree in higher-order visual processing regions (inferior temporal cortex). Connectivity changes uniquely associated with resilience were observed within the default mode network regions (the ventral anterior cingulate cortex, the angular gyrus, and the precuneus), where siblings showed increased participation coefficient compared with both patients and healthy volunteers.
FIGURE 3. Altered Local Brain Topological Measures in Patients With Bipolar Disorder and Unaffected Siblings Relative to Healthy Volunteersa
a Panel A shows reduced nodal degree in patients with bipolar disorder (BD, N=78) and unaffected siblings (SIB, N=64) relative to healthy volunteers (HV, N=41). Panel B shows increased nodal degree in patients with bipolar disorder and unaffected siblings relative to healthy volunteers. Panel C shows reduced participation coefficient in patients with bipolar disorder relative to healthy volunteers. Panel D shows increased participation coefficient in patients with bipolar disorder and unaffected siblings relative to healthy volunteers. Significant difference between groups (p<0.05, following 5,000 permutations).
Because of the association between familial liability and change in functional connectivity in the sensorimotor network in patients and siblings, we tested whether this was also reflected in terms of motor control based on the Barratt Impulsiveness Scale (22) score. This scale is composed of 30 items clustered into three main factors: attentional, motor, and nonplanning. Each factor has two subdomains: attentional focus and cognitive instability; motor impulsiveness and motor perseverance; and self-control and cognitive complexity. We found that patients had significantly higher scores than both their siblings and the healthy volunteers across all factors. The only difference between siblings and healthy volunteers was that siblings had higher motor impulsiveness scores (see Figure S5 in the data supplement).
Additional analyses were conducted to test resilience in the siblings, correlation between the imaging metrics and psychopathology, effects of medications, and the reliability of the results. All are described in the data supplement.

Discussion

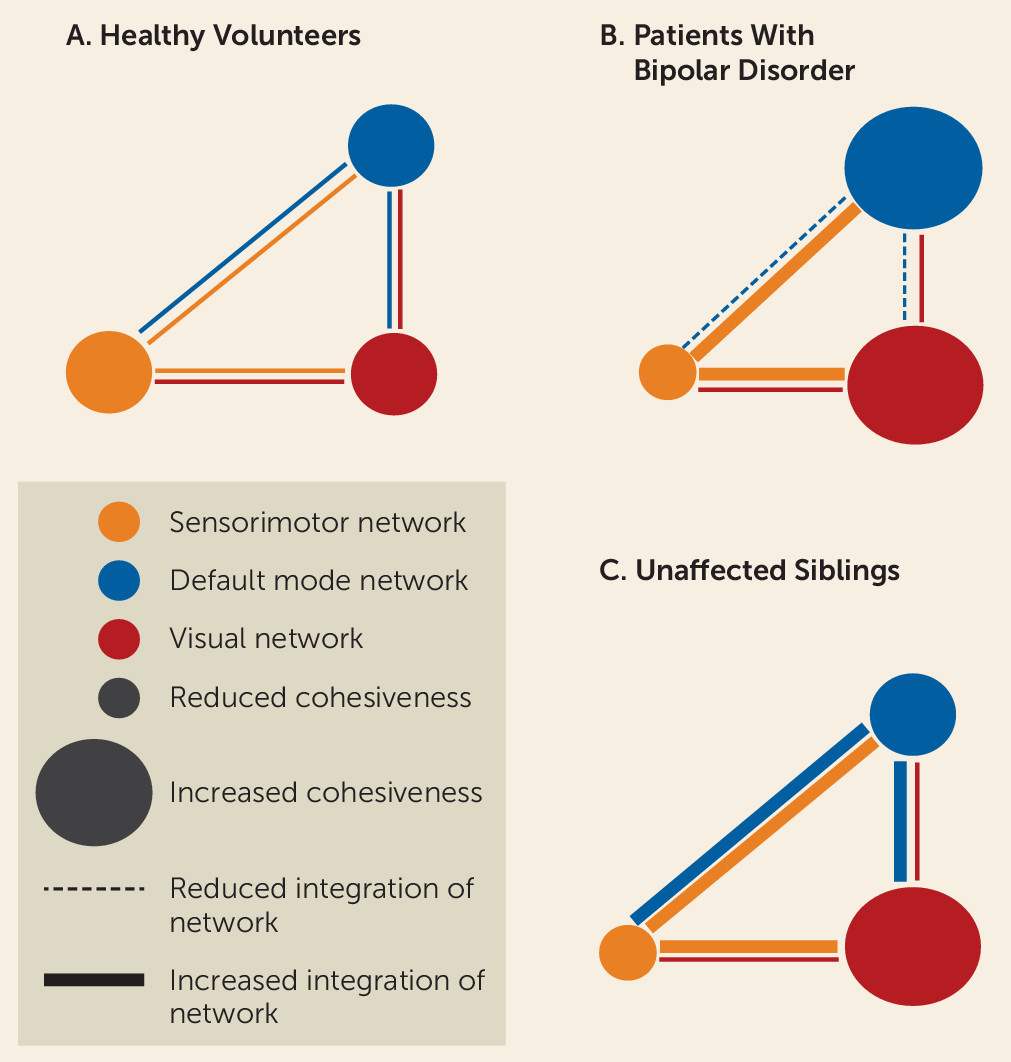
We characterized the topological organization and network modularity of the brain during the resting-state condition in patients with bipolar disorder, their unaffected siblings, and unrelated healthy volunteers. We found that disease expression, risk, and resilience to bipolar disorder were associated with mesoscale and regional changes primarily in the default mode and sensorimotor networks, while global network properties appeared to be conserved both in patients and their siblings (Figure 4).
FIGURE 4. Schematic Model of Network Organization in Patients With Bipolar Disorder, Unaffected Siblings, and Healthy Volunteersa
a The figure shows the three major networks, demonstrating differences in topology between groups. Changes in integration are based on results from the participation coefficient and between-module functional connectivity; changes in cohesiveness are based on results from the nodal degree and within-module functional connectivity.
We found that global network properties in bipolar disorder were preserved in a manner consistent with previous studies examining the structural connectome topology (23) and the global resting-state fMRI signal power and variance in patients with bipolar disorder (24). This contrasts with findings in schizophrenia, where increased global signal variance and network randomization have been reported in patients (24) and their unaffected relatives (25). Although schizophrenia and bipolar disorder have overlapping clinical phenotypes and genetic risk factors (4, 26), preserved global brain organization in bipolar disorder may represent a major difference between the two disorders. This observation aligns with replicated reports of preserved premorbid and academic performance in patients with bipolar disorder (27) and superior academic performance in their relatives (28), which is not the case for schizophrenia (27, 28).
Our results suggest that mechanisms related to vulnerability to bipolar disorder affect brain organization at the mesoscale and at the regional level and that they particularly disrupt the connectivity of sensorimotor regions. Typically the sensorimotor network shows high within-system connectivity and relatively low integration with the rest of the brain (20). This connectomic signature is characteristic of “cohesive provincial” networks that are dedicated to the specialized processing of sensory stimuli and motor responses. In the present study, patients and relatives showed decreased within-module connectivity (indicative of reduced network cohesiveness) coupled with increased interaction of sensorimotor regions with regions outside their module (indicative of greater integration). In other words, the sensorimotor network in bipolar disorder behaves as an incohesive connector network which likely disrupts the processing of sensorimotor information within the brain. It is surprising that research to date has largely overlooked the evidence for sensorimotor dysfunction in bipolar disorder given that abnormalities in motor and sensory processing are included in the diagnostic criteria for manic and depressive episodes. Complementing our findings, a large recent study (29) has reported reduced intracortical myelination in patients with bipolar disorder predominantly in the sensorimotor regions. Further studies have found abnormally reduced motor coordination, sensory integration, sensory gating, and selective attention in patients with bipolar disorder and their unaffected relatives (30, 31). In our data, increased motor impulsiveness was also associated with disease expression and risk for bipolar disorder, consistent with the connectivity changes in the sensorimotor network observed in patients and siblings.
The findings of this study underscore the role of regional default mode network connectivity in disease expression and resilience to bipolar disorder. Regional connectivity was evaluated using nodal degree and participation coefficient. Nodal degree is a measure of general connectedness, and participation coefficient is a measure of intermodular integration of individual brain regions. Typically, the default mode network regions show high within-network cohesiveness (high nodal degree) coupled with high between-network integration (high participation coefficient) (20, 32). These properties allow the default mode network to act as a “cohesive connector” and thus support a wide range of brain functions (20, 32). Consistent with previous reports of default mode network dysconnectivity in bipolar disorder (33, 34), we found that patients had abnormally reduced intermodular integration of two core regions of the default mode network—the ventromedial prefrontal cortex and hippocampus. In healthy individuals, hippocampal-midbrain connectivity supports reward-based learning and memory, and hippocampal-amygdala connectivity underpins contextually appropriate assignment of affective value and behavioral response selection (35). A similar role is conventionally attributed to the ventromedial prefrontal cortex in the regulation of the evaluative, expressive, and experiential aspects of emotion (36). Reduction in the integrative role of the hippocampus and ventromedial prefrontal cortex likely leads to impairment in stimulus appraisal and in contextually appropriate response selection. Moreover, the reduction of the integrative role of the default mode network, when considered together with the findings of the sensorimotor network dysconnectivity described above, supports the study by Martino et al. (2), who found that the balance between activity patterns of the default mode and sensorimotor networks was altered during acute episodes, favoring the default mode network in depression and the sensorimotor network in mania. Our observations suggest that a dysfunction of the default mode and sensorimotor networks is also present during interepisode intervals. The characterization of the cellular correlates of reduced default mode network integration is beyond the resolution of fMRI. Nevertheless, the present results are congruent with impaired neuronal plasticity and may be causally linked to the reduction in GABAergic and glutamatergic receptors reported in postmortem studies of bipolar patients (37, 38).
In contrast to patients, siblings had high participation coefficients in multiple regions of the default mode network that were even higher than those of the healthy volunteers. We infer that enhanced integration of the default mode network may represent an adaptive response to the dysconnectivity of the sensorimotor network observed in siblings and may thus be conducive to resilience (or at least delayed illness onset). This interpretation is speculative pending confirmation by longitudinal studies. Although one might consider increased integration of the default mode network as a prodromal marker for bipolar disorder, this is unlikely given the low risk for conversion in siblings, as discussed earlier, and in greater depth in the data supplement.
We took great care in minimizing potential head motion artifacts based on strict inclusion criteria, in addition to regressing out the average head motion from all of our metrics. The construction of brain graphs from fMRI data requires multiple methodological choices. We confirmed the robustness of our key results using alternative approaches, as detailed in the data supplement (including in Figure S6). Longitudinal studies of high-risk individuals are needed to confirm the association between default mode network connectivity and resilience and to test whether the clinical symptoms of bipolar disorder arise as a result of failure to either develop or maintain enhanced default mode network integration.
In summary, we found that the pathophysiology of bipolar disorder is characterized by abnormalities in regional—and not global—network properties, mainly affecting the default mode and sensorimotor networks. Enhanced default mode network integration was observed in unaffected siblings, which may have mitigated the effects of risk-related dysconnectivity in the sensorimotor network. The latter observation has the potential to open up avenues toward uncovering protective neural mechanisms and thus inform novel interventions to prevent or modify the course of bipolar disorder. Studies in neurological patients (e.g., 39) and healthy individuals (e.g., 40) suggest that both the default mode and sensorimotor networks may be amenable to plasticity-enhancing interventions. Future empirical studies may help define the types of plasticity-dependent interventions that might prove useful in bipolar disorder based on the spontaneous adaptive changes seen in resilient relatives.
Footnotes

Drs. Glahn and Frangou are joint senior authors.
Dr. Frangou received support from NIH grant R01 MH104284-01A1. Dr. Glahn received support from NIH grant R01 MH080912. Dr. Bassett acknowledges support from the John D. and Catherine T. MacArthur Foundation, the Alfred P. Sloan Foundation, the Army Research Laboratory and the Army Research Office through contracts W911NF-10-2-0022 and W911NF-14-1-0679, NIMH grant 2R01-DC-009209-11, National Institute of Child Health and Human Development grant 1R01HD086888-01, the Office of Naval Research, and grants BCS-1441502, BCS-1430087, and PHY-1554488 from the National Science Foundation.

Supplementary Material

File (appi.ajp.2017.17010095.ds001.pdf)

References

1.
Mamah D, Barch DM, Repovš G: Resting state functional connectivity of five neural networks in bipolar disorder and schizophrenia. J Affect Disord 2013; 150:601–609
2.
Martino M, Magioncalda P, Huang Z, et al: Contrasting variability patterns in the default mode and sensorimotor networks balance in bipolar depression and mania. Proc Natl Acad Sci USA 2016; 113:4824–4829
3.
Meda SA, Ruaño G, Windemuth A, et al: Multivariate analysis reveals genetic associations of the resting default mode network in psychotic bipolar disorder and schizophrenia. Proc Natl Acad Sci USA 2014; 111:E2066–E2075
4.
Lichtenstein P, Yip BH, Björk C, et al: Common genetic determinants of schizophrenia and bipolar disorder in Swedish families: a population-based study. Lancet 2009; 373:234–239
5.
Goodwin FK, Jamison KR: Manic-Depressive Illness: Bipolar Disorders and Recurrent Depression, 2nd ed. New York, Oxford University Press, 2007
6.
Baker JT, Holmes AJ, Masters GA, et al: Disruption of cortical association networks in schizophrenia and psychotic bipolar disorder. JAMA Psychiatry 2014; 71:109–118
7.
Fusar-Poli P, Howes O, Bechdolf A, et al: Mapping vulnerability to bipolar disorder: a systematic review and meta-analysis of neuroimaging studies. J Psychiatry Neurosci 2012; 37:170–184
8.
Dima D, Roberts RE, Frangou S: Connectomic markers of disease expression, genetic risk, and resilience in bipolar disorder. Transl Psychiatry 2016; 6:e706
9.
Frangou S: Brain structural and functional correlates of resilience to bipolar disorder. Front Hum Neurosci 2012; 5:184
10.
Pompei F, Dima D, Rubia K, et al: Dissociable functional connectivity changes during the Stroop task relating to risk, resilience, and disease expression in bipolar disorder. Neuroimage 2011; 57:576–582
11.
Collin G, van den Heuvel MP, Abramovic L, et al: Brain network analysis reveals affected connectome structure in bipolar I disorder. Hum Brain Mapp 2016; 37:122–134
12.
Rubinov M, Sporns O: Complex network measures of brain connectivity: uses and interpretations. Neuroimage 2010; 52:1059–1069
13.
Leboyer M, Bellivier F, McKeon P, et al: Age at onset and gender resemblance in bipolar siblings. Psychiatry Res 1998; 81:125–131
14.
Crossley NA, Mechelli A, Vértes PE, et al: Cognitive relevance of the community structure of the human brain functional coactivation network. Proc Natl Acad Sci USA 2013; 110:11583–11588
15.
Zalesky A, Fornito A, Harding IH, et al: Whole-brain anatomical networks: does the choice of nodes matter? Neuroimage 2010; 50:970–983
16.
Kaiser M, Hilgetag CC: Nonoptimal component placement, but short processing paths, due to long-distance projections in neural systems. PLOS Comput Biol 2006; 2:e95
17.
Ramsay JO, Silverman BW: Functional Data Analysis. New York, Springer, 2005
18.
Jutla IS, Jeub LGS, Mucha P: A generalized Louvain method for community detection implemented in MATLAB (2011–2012). http://netwiki.amath.unc.edu/GenLouvain/GenLouvain
19.
Traud A, Kelsic ED, Mucha PJ, et al: Comparing community structure to characteristics in online collegiate social networks. SIAM Review 2011; 53:526–543
20.
Gu S, Satterthwaite TD, Medaglia JD, et al: Emergence of system roles in normative neurodevelopment. Proc Natl Acad Sci USA 2015; 112:13681–13686
21.
Genovese CR, Lazar NA, Nichols T: Thresholding of statistical maps in functional neuroimaging using the false discovery rate. Neuroimage 2002; 15:870–878
22.
Patton JH, Stanford MS, Barratt ES: Factor structure of the Barratt impulsiveness scale. J Clin Psychol 1995; 51:768–774
23.
Collin G, Kahn RS, de Reus MA, et al: Impaired rich club connectivity in unaffected siblings of schizophrenia patients. Schizophr Bull 2014; 40:438–448
24.
Yang GJ, Murray JD, Repovs G, et al: Altered global brain signal in schizophrenia. Proc Natl Acad Sci USA 2014; 111:7438–7443
25.
Lo CY, Su TW, Huang CC, et al: Randomization and resilience of brain functional networks as systems-level endophenotypes of schizophrenia. Proc Natl Acad Sci USA 2015; 112:9123–9128
26.
Pearlson GD: Etiologic, phenomenologic, and endophenotypic overlap of schizophrenia and bipolar disorder. Annu Rev Clin Psychol 2015; 11:251–281
27.
MacCabe JH, Lambe MP, Cnattingius S, et al: Scholastic achievement at age 16 and risk of schizophrenia and other psychoses: a national cohort study. Psychol Med 2008; 38:1133–1140
28.
Vreeker A, Boks MP, Abramovic L, et al: High educational performance is a distinctive feature of bipolar disorder: a study on cognition in bipolar disorder, schizophrenia patients, relatives, and controls. Psychol Med 2016; 46:807–818
29.
Jørgensen KN, Nerland S, Norbom LB, et al: Increased MRI-based cortical grey/white-matter contrast in sensory and motor regions in schizophrenia and bipolar disorder. Psychol Med 2016; 46:1971–1985
30.
Giakoumaki SG, Roussos P, Rogdaki M, et al: Evidence of disrupted prepulse inhibition in unaffected siblings of bipolar disorder patients. Biol Psychiatry 2007; 62:1418–1422
31.
Mrad A, Wassim Krir M, Ajmi I, et al: Neurological soft signs in euthymic bipolar I patients: a comparative study with healthy siblings and controls. Psychiatry Res 2016; 236:173–178
32.
Buckner RL, Andrews-Hanna JR, Schacter DL: The brain’s default network: anatomy, function, and relevance to disease. Ann N Y Acad Sci 2008; 1124:1–38
33.
Meda SA, Gill A, Stevens MC, et al: Differences in resting-state functional magnetic resonance imaging functional network connectivity between schizophrenia and psychotic bipolar probands and their unaffected first-degree relatives. Biol Psychiatry 2012; 71:881–889
34.
Ongür D, Lundy M, Greenhouse I, et al: Default mode network abnormalities in bipolar disorder and schizophrenia. Psychiatry Res 2010; 183:59–68
35.
LeDoux JA: Cognitive-emotional interactions in the brain. Cogn Emot 1989; 3:267–289
36.
Phillips ML, Drevets WC, Rauch SL, et al: Neurobiology of emotion perception, I: the neural basis of normal emotion perception. Biol Psychiatry 2003; 54:504–514
37.
Beneyto M, Kristiansen LV, Oni-Orisan A, et al: Abnormal glutamate receptor expression in the medial temporal lobe in schizophrenia and mood disorders. Neuropsychopharmacology 2007; 32:1888–1902
38.
Heckers S, Stone D, Walsh J, et al: Differential hippocampal expression of glutamic acid decarboxylase 65 and 67 messenger RNA in bipolar disorder and schizophrenia. Arch Gen Psychiatry 2002; 59:521–529
39.
Maniglia M, Pavan A, Sato G, et al: Perceptual learning leads to long lasting visual improvement in patients with central vision loss. Restor Neurol Neurosci 2016; 34:697–720
40.
Ge R, Zhang H, Yao L, et al: Motor imagery learning induced changes in functional connectivity of the default mode network. IEEE Trans Neural Syst Rehabil Eng 2015; 23:138–148

Information & Authors

Information

Published In

Go to American Journal of Psychiatry
American Journal of Psychiatry
Pages: 1214 - 1222
PubMed: 28817956

History

Received: 24 January 2017
Revision received: 21 March 2017
Revision received: 2 May 2017
Accepted: 18 May 2017
Published online: 18 August 2017
Published in print: December 01, 2017

Keywords

  1. Mood Disorders-Bipolar
  2. Families
  3. Brain Imaging Techniques

Authors

Details

Gaelle E. Doucet, Ph.D.
From the Department of Psychiatry, Icahn School of Medicine at Mount Sinai, New York; the Department of Bioengineering and the Department of Electrical and Systems Engineering, University of Pennsylvania, Philadelphia; the Department of Psychiatry, Yale University School of Medicine, New Haven, Conn.; and the Olin Neuropsychiatric Institute, Institute of Living, Hartford Hospital, Hartford, Conn.
Danielle S. Bassett, Ph.D.
From the Department of Psychiatry, Icahn School of Medicine at Mount Sinai, New York; the Department of Bioengineering and the Department of Electrical and Systems Engineering, University of Pennsylvania, Philadelphia; the Department of Psychiatry, Yale University School of Medicine, New Haven, Conn.; and the Olin Neuropsychiatric Institute, Institute of Living, Hartford Hospital, Hartford, Conn.
Nailin Yao, Ph.D.
From the Department of Psychiatry, Icahn School of Medicine at Mount Sinai, New York; the Department of Bioengineering and the Department of Electrical and Systems Engineering, University of Pennsylvania, Philadelphia; the Department of Psychiatry, Yale University School of Medicine, New Haven, Conn.; and the Olin Neuropsychiatric Institute, Institute of Living, Hartford Hospital, Hartford, Conn.
David C. Glahn, Ph.D.
From the Department of Psychiatry, Icahn School of Medicine at Mount Sinai, New York; the Department of Bioengineering and the Department of Electrical and Systems Engineering, University of Pennsylvania, Philadelphia; the Department of Psychiatry, Yale University School of Medicine, New Haven, Conn.; and the Olin Neuropsychiatric Institute, Institute of Living, Hartford Hospital, Hartford, Conn.
Sophia Frangou, M.D., Ph.D. [email protected]
From the Department of Psychiatry, Icahn School of Medicine at Mount Sinai, New York; the Department of Bioengineering and the Department of Electrical and Systems Engineering, University of Pennsylvania, Philadelphia; the Department of Psychiatry, Yale University School of Medicine, New Haven, Conn.; and the Olin Neuropsychiatric Institute, Institute of Living, Hartford Hospital, Hartford, Conn.

Notes

Address correspondence to Dr. Frangou ([email protected]).

Competing Interests

The authors report no financial relationships with commercial interests.

Funding Information

National Science Foundation10.13039/100000001: BCS-1430087, BCS-1441502, NSF PHY-1554488
Army Research Office10.13039/100000183: W911NF-10-2-0022, W911NF-14-1-0679
National Institutes of Health10.13039/100000002: R01 MH080912, R01 MH104284-01A1
National Institute of Mental Health10.13039/100000025: 2R01-DC-009209-11
National Institute of Child Health and Human Development1R01HD086888-01

Metrics & Citations

Metrics

Citations

Export Citations

If you have the appropriate software installed, you can download article citation data to the citation manager of your choice. Simply select your manager software from the list below and click Download.

For more information or tips please see 'Downloading to a citation manager' in the Help menu.

Format
Citation style
Style
Copy to clipboard

View Options

View options

PDF/EPUB

View PDF/EPUB

Get Access

Login options

Already a subscriber? Access your subscription through your login credentials or your institution for full access to this article.

Personal login Institutional Login Open Athens login
Purchase Options

Purchase this article to access the full text.

PPV Articles - American Journal of Psychiatry

PPV Articles - American Journal of Psychiatry

Not a subscriber?

Subscribe Now / Learn More

PsychiatryOnline subscription options offer access to the DSM-5-TR® library, books, journals, CME, and patient resources. This all-in-one virtual library provides psychiatrists and mental health professionals with key resources for diagnosis, treatment, research, and professional development.

Need more help? PsychiatryOnline Customer Service may be reached by emailing [email protected] or by calling 800-368-5777 (in the U.S.) or 703-907-7322 (outside the U.S.).

Media

Figures

Other

Tables

Share

Share

Share article link

Share