The clinical high-risk paradigm was developed in the 1990s as a framework for identifying predictors and mechanisms of onset of psychosis, toward the broader goal of stimulating early detection and intervention programs that could lead to improved long-term outcomes (
1). During the intervening years, it has become increasingly apparent that the clinical high-risk syndrome itself is associated with significant burdens, independent of whether it precedes conversion to a psychotic disorder (
2). Individuals meeting clinical high-risk criteria are distressed and seeking treatment (
3). Although by definition their positive symptoms (i.e., delusions, hallucinations, thought disorder) are at subpsychotic intensity, these symptoms nevertheless are disruptive and rate limiting for social and role functioning (
4), and they are, on average, at about the level associated with major depressive disorder with comorbid alcohol abuse (
5). Better characterization and quantification of the clinical course and functional outcomes of clinical high-risk individuals are needed to optimize the design and implementation of early detection and intervention programs for young people with and at risk for psychosis.
Previous work has shown that most “nonconverters” continue to experience attenuated positive symptoms for at least 2 years after first seeking help (
6) and that functioning also tends to remain substantially impaired (
7–
9). Nevertheless, a portion of clinical high-risk individuals experience remission of positive symptoms (
10), and some achieve functional remission (
11,
12). Among those who do recover, remission of positive symptoms tends to be reached sooner than functional remission (
11,
13), suggesting that rates of improvement may differ across domains. Recent work has expanded the range of outcomes of interest in the clinical high-risk population to include symptomatic and functional recovery, remission, recurrence, and relapse (
14). However, the criteria for such outcomes have been predefined rather than discovered in the data. Longitudinal approaches that can ascertain covariant patterns across multiple symptom trajectories over time are needed to capture and quantify the variations in course and outcome among clinical high-risk individuals.
Here we used group-based multitrajectory modeling, a discovery-oriented statistical approach similar to latent growth class analysis, to characterize the longitudinal trajectories of symptoms in four domains (positive, negative, disorganized, general) as well as general functioning among help-seeking clinical high-risk individuals. We used independent discovery (from the second phase of the North American Prodrome Longitudinal Study [NAPLS-2], N=422) and replication (from the first phase of the NAPLS [NAPLS-1], N=133) data sets to identify and assess the replicability of trajectory patterns across samples. We also assessed rates of favorable outcomes relative to unfavorable outcomes for functional and positive symptoms based on prespecified criteria within the identified trajectory groups to further characterize differences in outcomes among clinical high-risk individuals.
Methods
Participants
NAPLS-2.
The NAPLS-2 was a consortium study investigating the prodromal phase of psychosis at eight sites (University of California, Los Angeles; Emory University; Harvard University; Hillside Hospital; University of California, San Diego; University of North Carolina at Chapel Hill; University of Calgary; and Yale University). Help-seeking individuals were enrolled if they met criteria for a clinical high-risk syndrome per the Structured Interview for Prodromal Risk Syndromes (SIPS) (
15) or, if they were age 18 or younger, if they met criteria for schizotypal personality disorder. Other inclusion criteria included age between 12 and 35 years, no current or lifetime diagnosis of an axis I psychotic disorder (including affective psychoses), IQ >70, no history of a CNS disorder, no substance dependence in the past 6 months, and subpsychotic symptoms not clearly caused by an axis I disorder. Recruitment took place between 2008 and 2012, and a total of 764 clinical high-risk individuals participated in the study. Participants were followed for up to five visits occurring every 6 months across 2 years or until the point of conversion to psychosis if it occurred earlier (
16). Information gathered at each visit included current symptom ratings using the SIPS, current functioning indexed by the Global Assessment of Functioning Scale (GAF), and conversion to psychosis as defined by thresholds on the SIPS. Participants provided written informed consent after receiving a complete description of the study.
To facilitate quadratic longitudinal modeling, data from a minimum of three visits were required (see the online supplement for the participant flow chart). Excluded participants who completed two or fewer visits (N=340) did not differ significantly from the analytic sample (N=422) in age, sex, race, or highest parent education level, but they were more likely to convert to psychosis (i.e., because most conversions occurred before the 12-month follow-up, which for most participants represented the third assessment point; see the online supplement). Of the 422 included participants, 193 completed all five assessments, 110 completed four assessments, and 119 completed three assessments. Predominant reasons for study dropout included the participant not appearing for assessment, converting to psychosis prior to the third visit, or being unable to be scheduled (see the online supplement). Individuals with missing data (i.e., three or four visits) were more likely to be male (see the online supplement). Accounting for dropout and sex in the final trajectory model did not substantially change results (see the online supplement).
Some individuals who converted to psychosis completed three or more visits prior to converting (N=19, 4.5%) and were included in one version of the analyses. Inclusion of these eventual converters supported generalization of results to the population of help-seeking clinical high-risk individuals presenting at baseline, independent of their long-term outcomes. Data from conversion visits were not included because visits were not confined to the regular 6-month assessments. In a secondary version of the analyses, exclusion of converters did not substantially change model parameters (see the online supplement).
NAPLS-1.
As a test of replication, we used data from the first phase of the NAPLS consortium (NAPLS-1), which combined data collected at the study sites between 1998 and 2005 (
17). Clinical high-risk participants met criteria for a prodromal risk syndrome based on the SIPS interview at baseline. Although there was some variability in study design across sites, all of them included clinical evaluations at 6-month intervals, for up to 30 months, and administered the SIPS and the GAF at each visit. To facilitate comparison to the NAPLS-2 sample, only individuals who met clinical high-risk criteria were included in the study (N=510), and data from the 30-month visit were omitted (see the
online supplement for the participant flow chart). Participants who were simultaneously enrolled in medication trials (N=47) were also excluded (see the
online supplement). The NAPLS-1 and the NAPLS-2 samples were completely independent and nonoverlapping.
Of the 463 clinical high-risk participants, 133 (28.7%) participated in three or more visits and were included in the analytic sample. Compared with participants with three or more assessments, those who completed one or two assessments were more likely to have converted to psychosis in the first 12 months and to have parents with an education level of high school or less (see the online supplement). Of the 133 participants in the analytic sample, 51 completed three assessment visits, 43 completed four visits, and 39 completed all five visits. Dropout was associated with higher baseline GAF score (see the online supplement). Analyses were rerun to include dropout and baseline GAF parameters, and they suggest that group 1 membership may be inflated by 3%−5% and that group 2 membership may be deflated by a similar proportion in the final models (see the Results section and the online supplement). No substantial changes in model derivation or parameters were observed when eventual converters (N=19) were excluded (see the online supplement).
Symptom and Function Measures
In both the NAPLS-2 and NAPLS-1 samples, current functioning and symptom severity were indexed using the GAF and the Scale of Prodromal Symptoms (SOPS), as assessed in semistructured clinical interviews by trained raters (
16,
17). GAF scores index impairment in terms of symptoms and functioning across social, work, and school domains, and scores range from 1 to 100. The SOPS is used to assess the severity of symptoms within four domains: positive, negative, disorganized, and general. Each domain consists of four to six items and is rated in severity from 0 to 6 (absent to extreme). On the positive scale only, a rating of 3 on any item indicates severity consistent with prodromal criteria, and a rating of 6 on any item indicates “severe and psychotic” and connotes conversion to psychosis. To reflect overall impairment, scores were summed for items within each domain to create composite scores (e.g., “sum of severity of positive symptoms”) at each visit. Possible scores ranged from 0 to 24 (disorganized and general domains), 25 (positive domain), or 36 (negative domain). Because the study was focused on prodromal symptoms, the lowest possible positive score was 3 at baseline.
Data Analyses
Analyses were conducted in SAS, version 9.4, using the PROC TRAJ procedure (
18). Graphs were made in R using ggplot2 (
19) and gridExtra (
20). Start values were tested in Stata, version 15, using a macro created by R. (“Bobby”) Jones (personal communication, April 12, 2018).
Discovery of symptom and functioning multitrajectory groups.
We used group-based multitrajectory modeling, a form of latent growth class analysis, to identify common trajectories of symptoms and functioning in the NAPLS-2. This method is used to approximate the true distribution of trajectories by discovering subgroups of individuals who follow similar patterns of change across time on multiple variables (
18). Notably, models simultaneously considered scores for symptom severity across four domains (positive, negative, disorganized, general) and in functioning (the GAF) at each visit when constructing models and assigning group membership.
To identify the number of distinct, stable trajectories that would be important to represent in multitrajectory models and to check statistical assumptions, models for each dimension were first estimated individually (see the
online supplement). Model comparison began with estimation of one class and increased in number until model fit indices did not meet recommended thresholds or identify theoretically meaningful trajectories. We examined recommended fit indices: lower absolute value Bayesian information criteria and log likelihood relative to the previous model, posterior probability of assignment to groups >0.7, group size >5%, and odds of correct classification >5. Spaghetti plots of individual data trajectories, along with estimated group trajectories, were used to visually assess data separation and model fitness for final univariate models. Guidelines for reporting on latent trajectory studies were followed (
21) (see the
online supplement). Final univariate and multivariate models were tested with 100 sets of start values to assess the likelihood that global maxima were met.
Assessing pattern replicability and comparing models.
The NAPLS-1 data set was used to assess the replicability of multitrajectory patterns derived in the NAPLS-2 data set. Univariate trajectory models were assessed in the same manner as in the NAPLS-2 (see the online supplement). A multitrajectory model with the same number of groups and parameters used in the NAPLS-2 was fitted to the NAPLS-1 data. Trajectory parameters were compared across samples using bootstrapped confidence intervals for each parameter, created by deriving model parameter estimates from 1,000 subsets of 133 individuals (i.e., the size of the NAPLS-1 sample) from the NAPLS-2 data set. Replication criteria were met if the NAPLS-1 parameter fell within the 95% CI of the bootstrapped NAPLS-2 parameter distribution (see the online supplement).
Outcomes.
In both samples, remission of positive symptoms was defined as the absence of any positive symptoms with a severity rating of 3 or greater at a given visit (
22), per prodromal criteria. The threshold for functional remission was set at a GAF score of 61 (“both mild persistent symptoms and some difficulty in social, work, and school functioning”) (
11,
23,
24) (see the
online supplement for analyses with a higher functional threshold). The frequency of a variety of outcomes for positive symptom severity and functioning was assessed within each trajectory group: persistent impairment (remission criteria never met), remission (remission criteria met at the final visit), recurrence (remission criteria met but not sustained), recovery (remission criteria sustained across at least two visits), and relapse (remission criteria met for two visits followed by recurrence). Outcomes were further grouped into “favorable outcomes” (remission and recovery) and “unfavorable outcomes” (persistent impairment, recurrence, relapse) (
14,
25). Rates of favorable and unfavorable outcomes were compared between groups using Wald chi-square tests (two-tailed).
Results
Model Derivation
Among participants in the NAPLS-2 sample (N=422), the mean age at baseline was 18.5 years (SD=4.3), and 59.2% were male. The sample was predominantly Caucasian (55.9%), 17.1% African American, and 27.0% other categories (e.g., Asian, multiracial). For 17.5% of the sample, the highest parent education level was high school or below.
We selected the three-group model because the groups appeared theoretically meaningful and criteria for parameters assessing model fitness were exceeded, indicating that the groups were stable and distinct from one another (see the
online supplement).
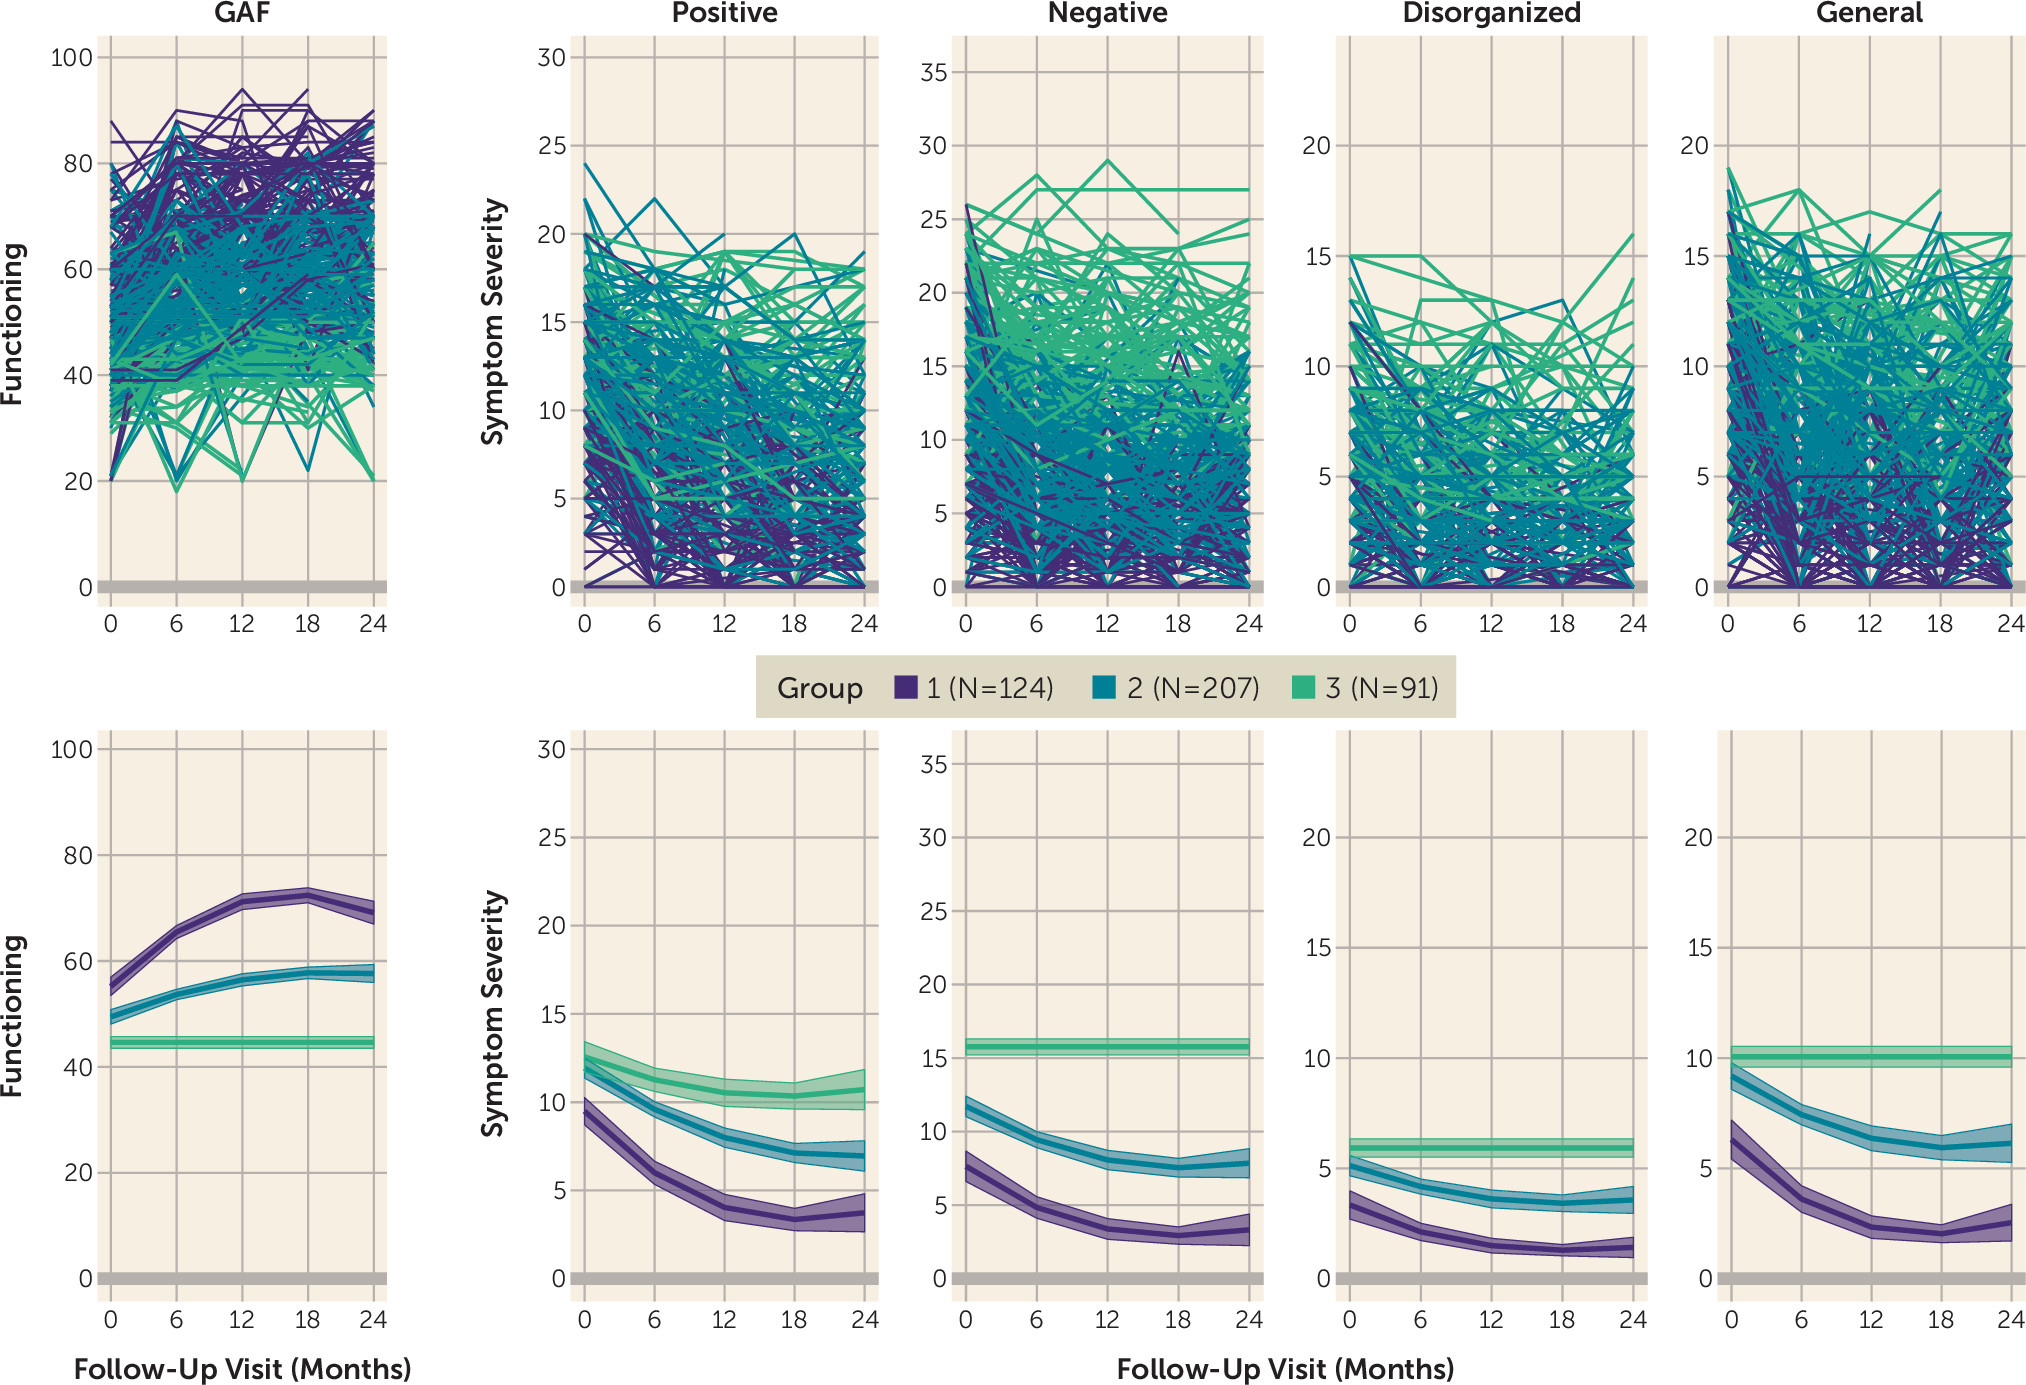
Figure 1 displays the trajectories of each group across the five assessed domains. The three groups corresponded to individuals who improved rapidly across functioning and all symptom domains and generally exhibited minimal impairment by the end of the study (group 1, 29.6%); individuals who exhibited moderate levels of functional impairment and symptoms across all domains at baseline, with some improvement across the study (group 2, 48.9%); and individuals who exhibited high levels of functional impairment and symptom severity with no improvement (i.e., nonsignificant quadratic and linear parameters) across domains, except positive symptom severity (group 3, 21.5%).
The three derived trajectory groups did not differ significantly by age, sex, race, or mean number of visits (see the online supplement). The groups differed significantly on parental education, with group 2 exhibiting the lowest percentage of parents who completed high school or less (11.3%), followed by group 3 (20.9%) and group 1 (25.2%) (χ2=11.27, df=2, p=0.007).
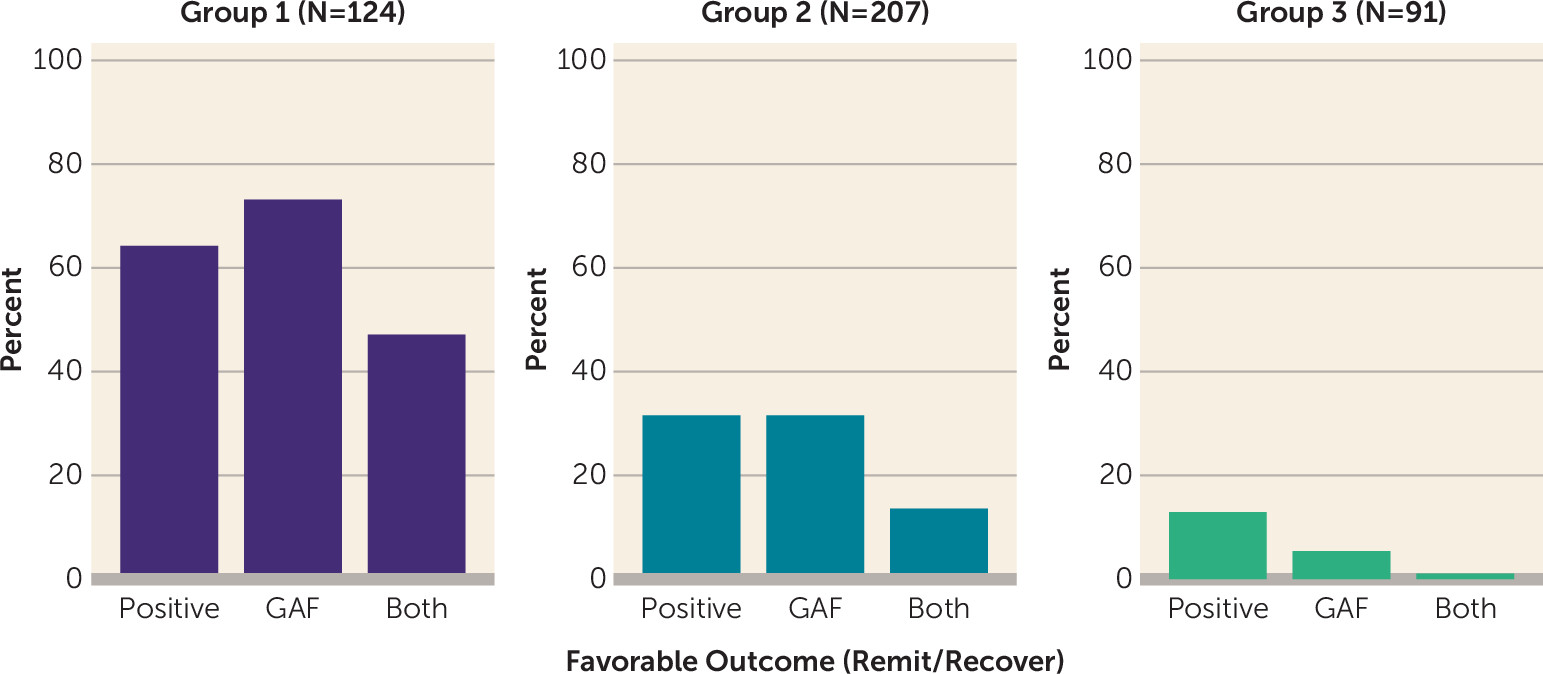
Rates of favorable outcomes (i.e., remission or sustained recovery) on positive symptom severity and functional impairment also differed significantly across groups (
Figure 2; see also the
online supplement). In group 1, more than half of participants exhibited favorable outcomes on positive symptom severity or functional remission, and 47% achieved favorable outcomes on both domains. In contrast, approximately one-third of participants in group 2 reached favorable outcomes on positive symptom severity and functional outcomes, but few (5%) exhibited favorable outcomes in both domains. Very few participants in group 3 (13%) achieved favorable outcomes on positive symptom severity, even fewer (5%) exhibited favorable functional outcomes, and less than 1% showed favorable outcomes on both.
Model Validation
Among participants in the NAPLS-1 sample, the mean age at baseline was 18.0 years (SD=4.6), and 61.7% were male. The sample was predominantly Caucasian (79.0%), 6.8% African American, and 14.3% other categories (e.g., Asian, multiracial). For 12.8% of the sample, the highest parent education level was high school or below.
To assess the replicability of trajectory patterns identified in the NAPLS-2 sample, a three-group quadratic model was derived and assessed in the NAPLS-1 sample (N=133). Criteria for model fitness and reliability were met (see Table S2 in the
online supplement), and the three derived groups (
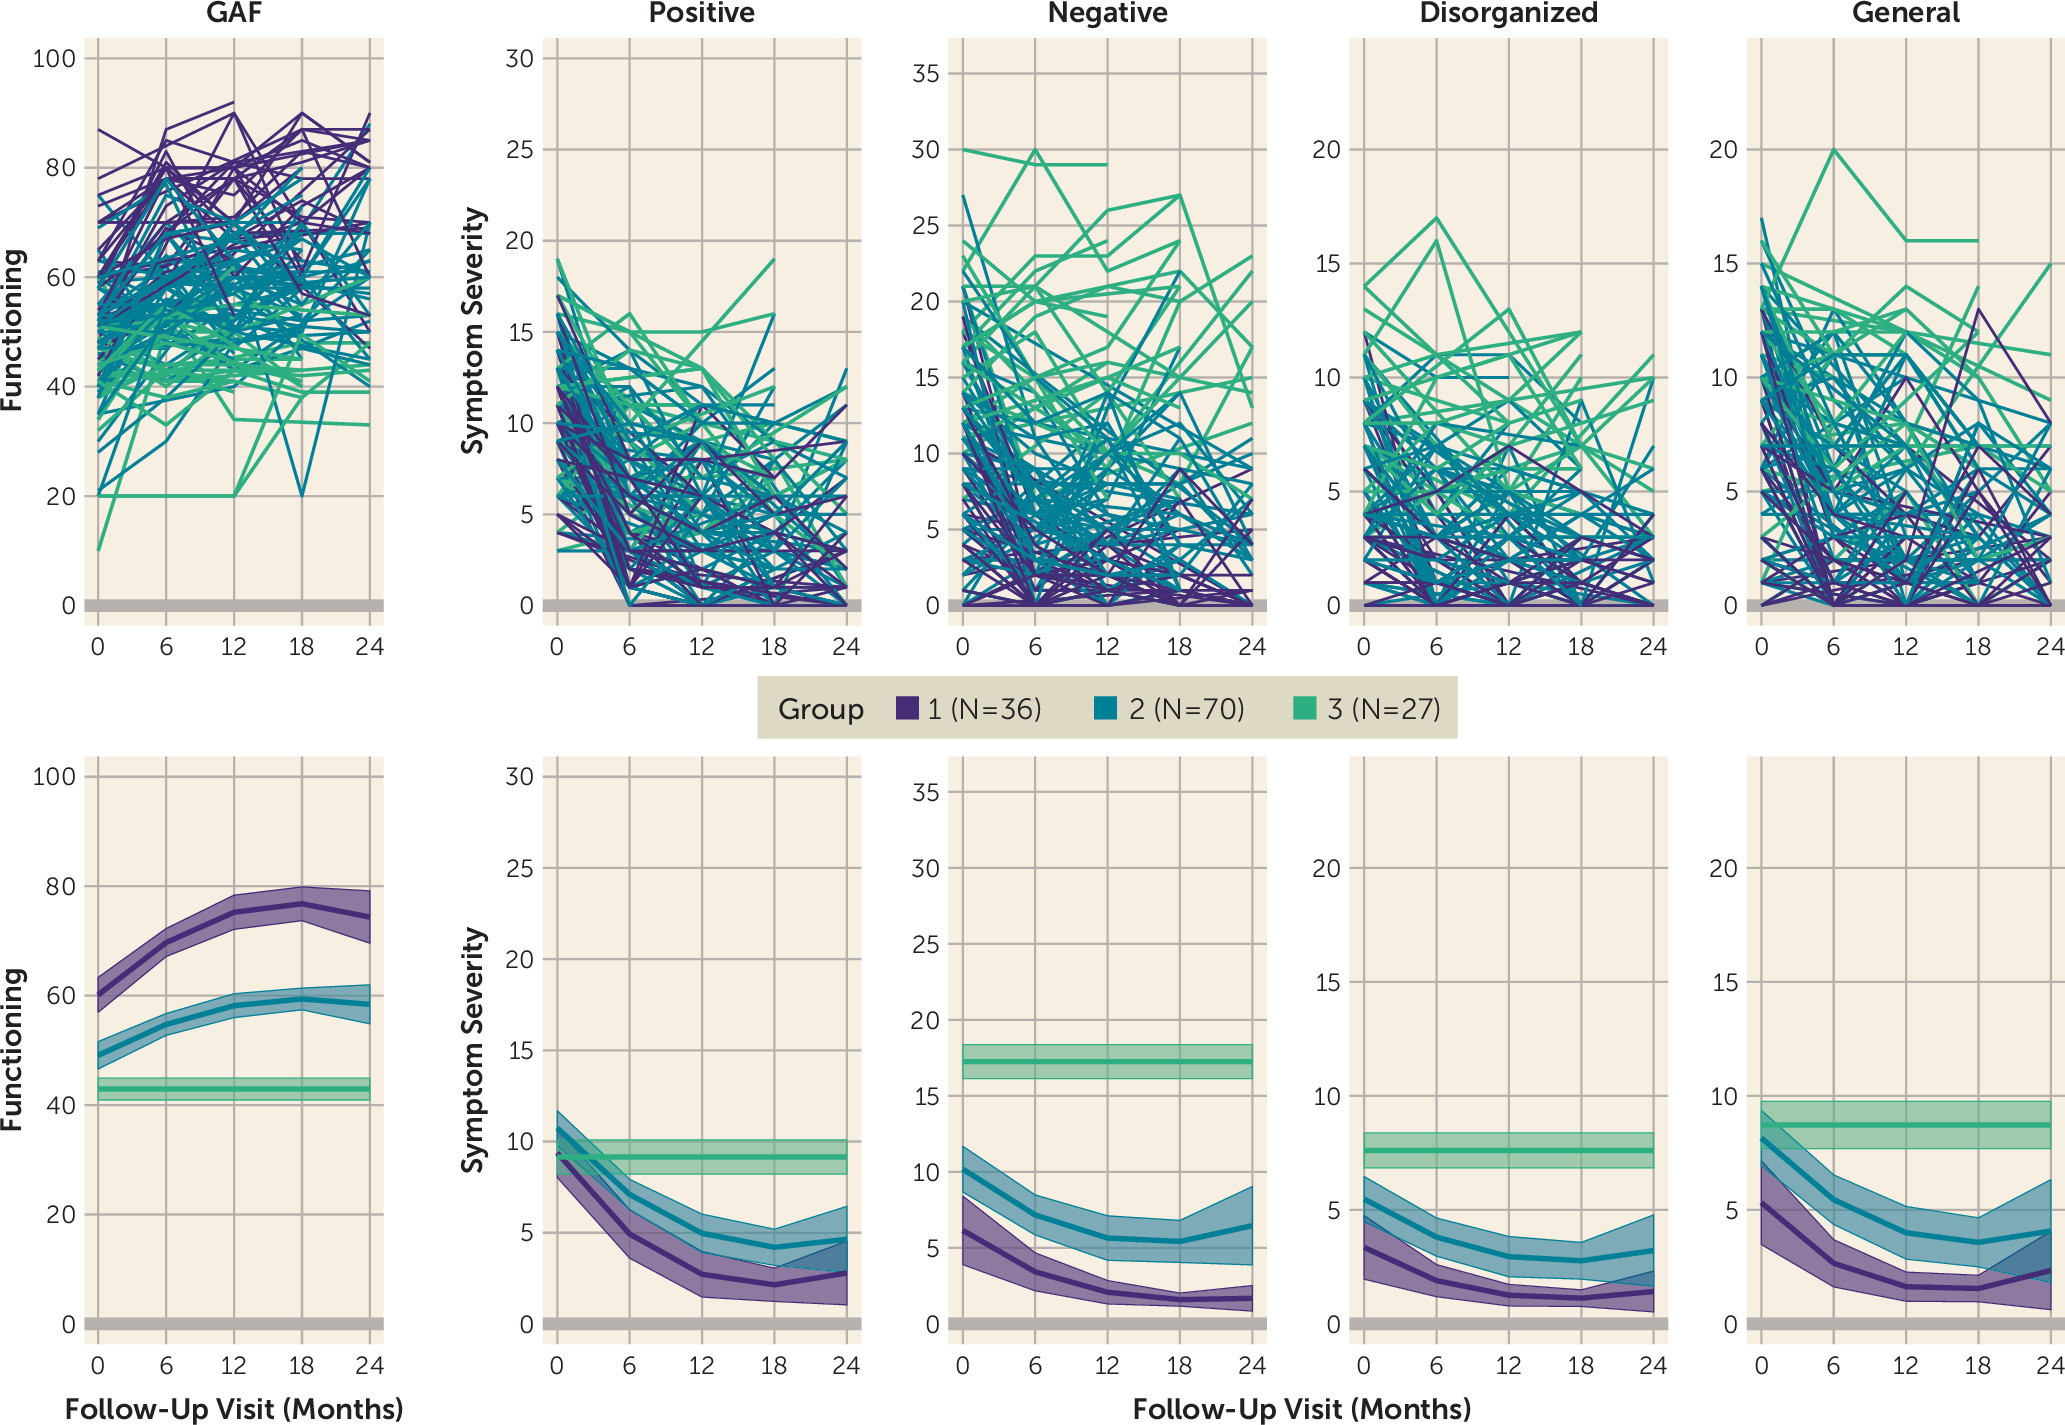
Figure 3) resembled those derived in the NAPLS-2, including individuals who improved rapidly across functioning and all symptom domains and generally exhibited minimal impairment by the end of the study (group 1, 26.7%); individuals who exhibited moderate levels of functional impairment and symptom severity across all domains at baseline, with some improvement (group 2, 54.9%); and individuals who exhibited high levels of functional impairment and symptom severity with no improvement (i.e., nonsignificant quadratic and linear parameters) across all domains (group 3, 18.4%). Of note, dropout analyses suggest that group 1 size estimates may be inflated by 3%−5% and that group 2 estimates may be deflated by a similar proportion in the final model (see the
online supplement).
The three derived trajectory groups did not differ significantly in race, parental education, or mean number of visits (see the online supplement). The groups differed significantly in age at baseline, with group 3 exhibiting the lowest mean age (mean=16.55 years, SD=2.85), followed by group 2 (mean=17.54 years, SD=4.13) and group 1 (mean=20.01 years, SD=5.77) (F=5.51, df=2, p=0.005).
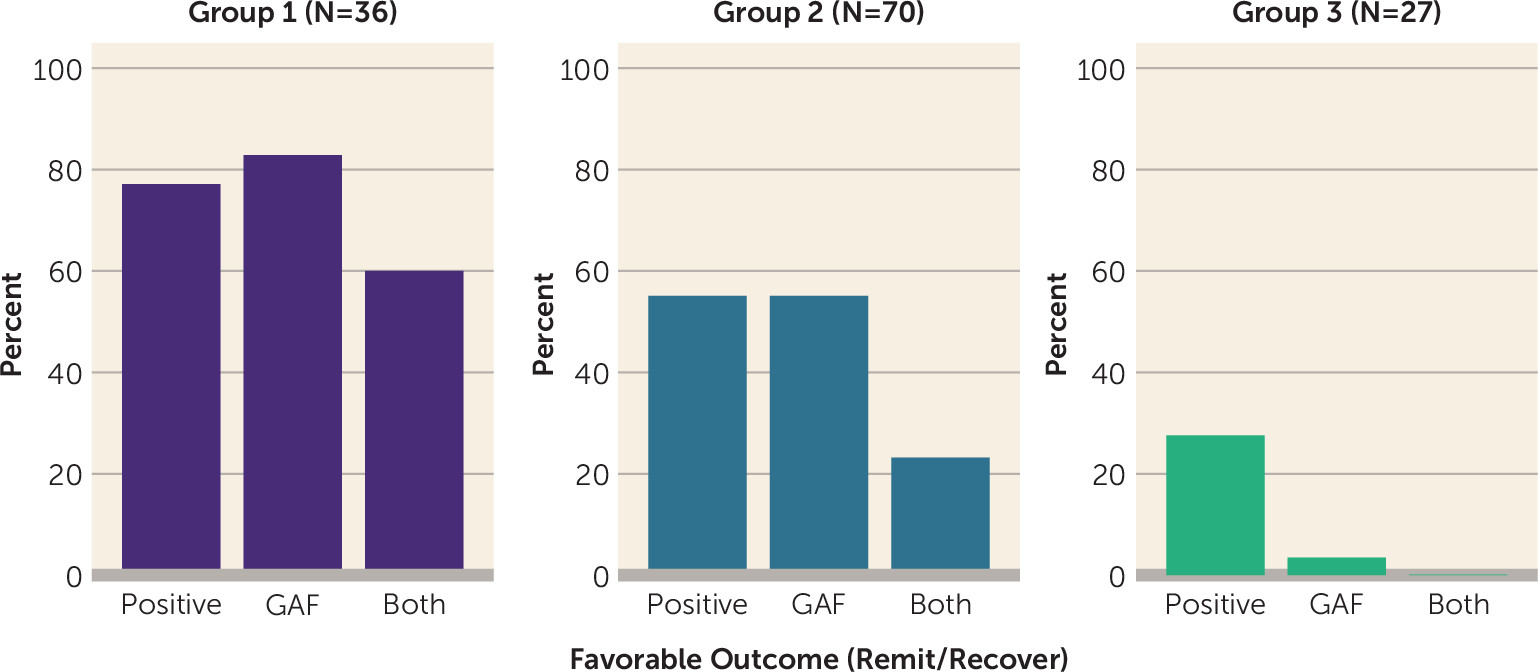
Rates of favorable outcomes on positive symptom severity and functional impairment also differed significantly across groups (
Figure 4; also see the
online supplement). In group 1, more than three-fourths of participants exhibited favorable outcomes on positive symptom severity or functional remission, and a majority (60%) achieved favorable outcomes on both domains. In contrast, approximately 40%−50% of participants in group 2 reached favorable outcomes on positive symptom severity and functional outcomes. Fewer participants in group 3 achieved favorable outcomes on positive symptom severity (30%), only 3% exhibited favorable functional outcomes, and less than 1% achieved favorable outcomes across both symptoms and functioning.
Model Comparison
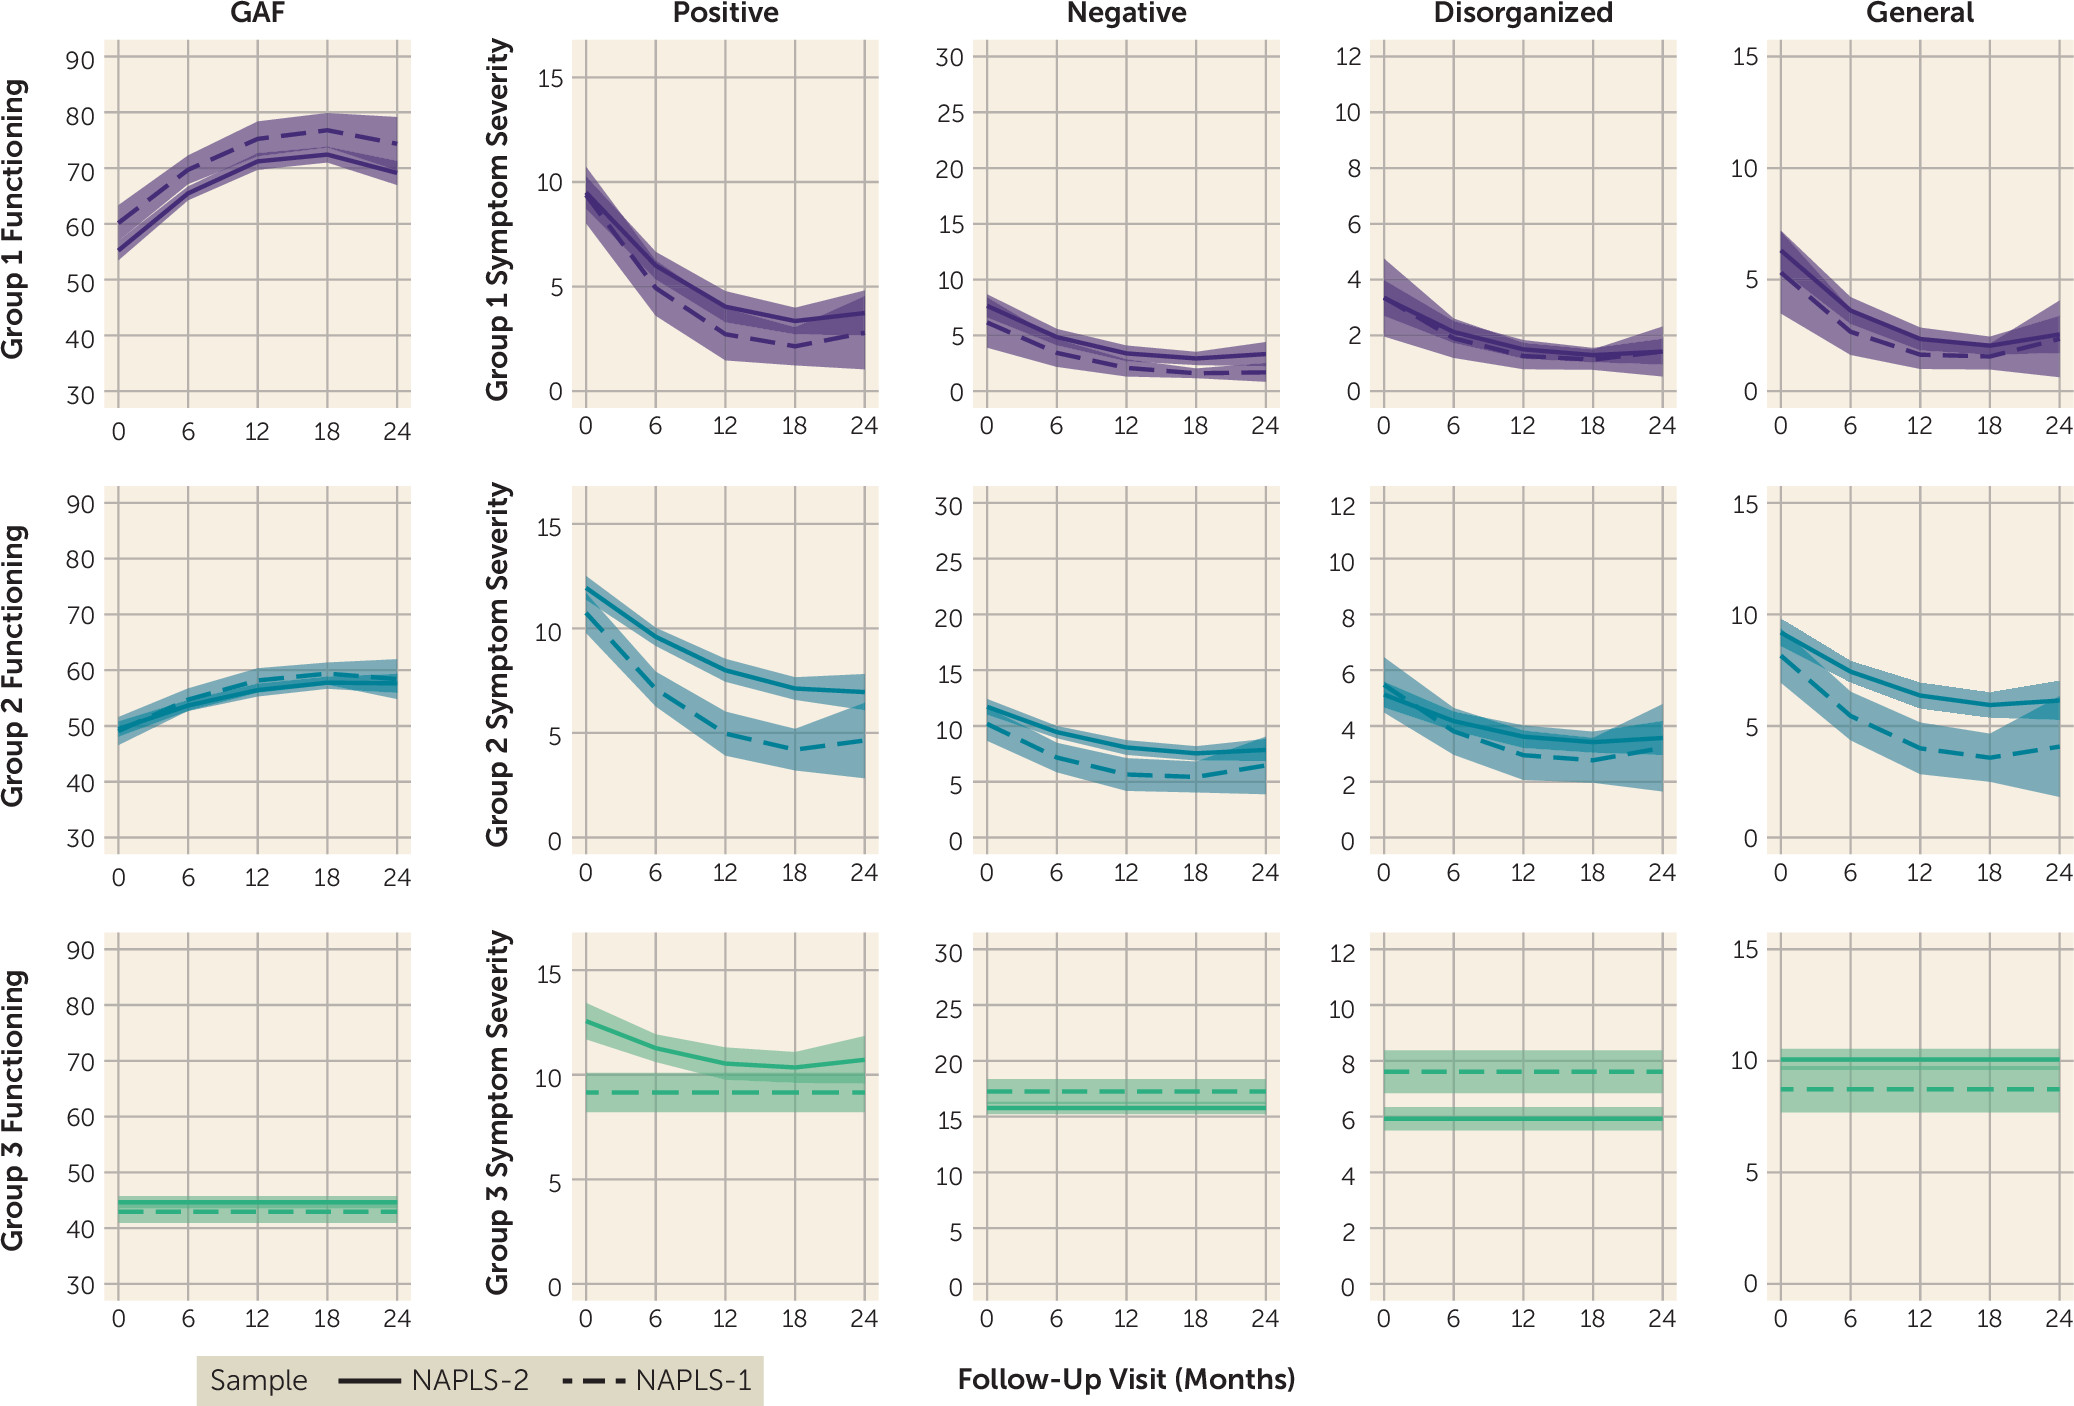
To compare the model estimates identified in the NAPLS-2 and NAPLS-1 samples, trajectories from both samples were plotted together (
Figure 5), and model parameters were compared using bootstrapped confidence intervals (see the
online supplement). Differences between the NAPLS-2 and NAPLS-1 trajectory model parameters (two-tailed, p<0.05) were observed for quadratic and slope parameters for positive, disorganized, and general symptoms in group 2 (steeper in the NAPLS-1) and intercepts for positive symptoms in group 2 (higher in the NAPLS-2). These findings indicate full statistical replicability for groups 1 and 3 and partial statistical replicability for group 2. Despite increased heterogeneity in the slopes and quadratic terms for group 2 across samples, the conceptual definition of this group (moderate improvement across domains, with highest rates during the first 6–12 months of follow-up) was consistent across samples (
Figure 5).
Discussion
We identified three trajectory groups of clinical high-risk individuals that captured most variation across outcome dimensions throughout the 2-year NAPLS-2 study. The patterns of the three trajectory groups broadly replicated, statistically and conceptually, in the independent NAPLS-1 sample, suggesting that the identified groupings are reliable and may be generalizable to the broader clinical high-risk population. Of the three identified groups, patterns ranged from substantial improvement with high rates of favorable outcomes to stable impairment across functioning and symptom domains. Group 1 exhibited rapid improvement across all domains, and close to half of its members exhibited favorable outcomes on both functioning and positive symptoms at their last visit. Group 2 demonstrated moderate improvement across symptom and functioning domains, with approximately a quarter of individuals reaching favorable outcomes on indices of functioning and positive symptoms. In contrast to groups 1 and 2, group 3 exhibited consistent levels of moderate to severe impairment in functioning and symptom severity across domains that persisted across the 2-year period and that generally did not reach any remission criteria.
With knowledge of these profiles, we may be able to develop prediction models using baseline data that could inform needs for treatment. For example, group 3 would likely require substantial intervention for impairments across functioning and symptom domains, whereas group 1 may need only short-term support and monitoring and group 2 may need an intermediate level of support. Post hoc analyses indicated lower rates of comorbid affective and non–cluster A personality disorders in group 1 relative to groups 2 and 3 but did not identify differences between group 2 and group 3, indicating that the burden of additional psychopathology does not fully explain differences in severity of impairment (see the online supplement). Prediction of outcome profiles in addition to conversion may also improve signal-to-noise ratio in clinical trials, as individuals who will likely remit quickly on the targeted symptoms (i.e., group 1) could potentially be excluded. Further assessment of predictors and biological correlates may also yield insight into different mechanistic pathways that contribute to the clinical high risk phenomenon and could provide a platform for individualized early treatment and intervention.
There are a number of limitations associated with data-driven approaches to trajectory modeling. To facilitate quadratic modeling, only individuals with at least three visits were included in the analytic sample. This approach narrows the interpretation of our findings to help-seeking clinical high-risk individuals who participated in at least a year of follow-up assessments. Because many individuals who converted to psychosis did so within the first year of study follow-up (
26), these trajectory groups do not capture functional and symptomatic patterns prior to conversion for most converters. However, other prediction approaches have been developed for conversion (
3) that are complementary to the present approach, and together these tools capture a wider range of the outcomes of help-seeking clinical high-risk individuals. A second limitation of trajectory modeling, and of longitudinal studies broadly, is the influence of missing data on model parameters. The majority of our participants missed at least one of the four biannual follow-up visits, and we thoroughly assessed the missing-at-random assumption and potential influence of differential rates of attrition across trajectory groups (see the
online supplement). The only effect observed was a shift in NAPLS-1 group membership sizes of 3%−5% for groups 1 and 2, which we noted in our interpretation of this model. As model selection is influenced by the number of assessments, length of follow-up, and sample size (N<200), different study designs may lead to alternative models. Lastly, trajectory modeling inherently simplifies the variability of individual trajectories within each class. Some individuals may exhibit greater change compared with others within their group, and conclusions about individual outcomes should be approached with caution. Broadly, it is important to keep in mind that the identified trajectories are estimates of common outcome patterns among the help-seeking clinical high-risk population (
27).
In summary, we identified three profiles of clinical high-risk longitudinal trajectories indicative, respectively, of rapid symptomatic and functional improvement, with high rates of positive outcomes; moderate gains in symptomatic and functional improvement, with ongoing need for support; and stable, chronic impairment in symptoms and functioning. These differences in outcomes highlight the need for individualized treatment for this population and the potential for prediction of subgroup outcomes to improve opportunities for early intervention and treatment.
