Site maintenance Wednesday, November 13th, 2024. Please note that access to some content and account information will be unavailable on this date.
Skip to main content
Full access
Articles
Published Online: 16 December 2019

Distinct Polygenic Score Profiles in Schizophrenia Subgroups With Different Trajectories of Cognitive Development

Abstract

Objective:

Different cognitive development histories in schizophrenia may reflect variation across dimensions of genetic influence. The authors derived and characterized cognitive development trajectory subgroups within a schizophrenia sample and profiled the subgroups across polygenic scores (PGSs) for schizophrenia, cognition, educational attainment, and attention deficit hyperactivity disorder (ADHD).

Methods:

Demographic, clinical, and genetic data were collected at the National Institute of Mental Health from 540 schizophrenia patients, 247 unaffected siblings, and 844 control subjects. Cognitive trajectory subgroups were derived through cluster analysis using estimates of premorbid and current IQ. PGSs were generated using standard methods. Associations were tested using general linear models and logistic regression.

Results:

Cluster analyses identified three cognitive trajectory subgroups in the schizophrenia group: preadolescent cognitive impairment (19%), adolescent disruption of cognitive development (44%), and cognitively stable adolescent development (37%). Together, the four PGSs significantly predicted 7.9% of the variance in subgroup membership. Subgroup characteristics converged with genetic patterns. Cognitively stable individuals had the best adult clinical outcomes and differed from control subjects only in schizophrenia PGSs. Those with adolescent disruption of cognitive development showed the most severe symptoms after diagnosis and were cognitively impaired. This subgroup had the highest schizophrenia PGSs and had disadvantageous cognitive PGSs relative to control subjects and cognitively stable individuals. Individuals showing preadolescent impairment in cognitive and academic performance and poor adult outcome exhibited a generalized PGS disadvantage relative to control subjects and were the only subgroup to differ significantly in education and ADHD PGSs.

Conclusions:

Subgroups derived from patterns of premorbid and current IQ showed different premorbid and clinical characteristics, which converged with broad genetic profiles. Simultaneous analysis of multiple PGSs may contribute to useful clinical stratification in schizophrenia.
Heterogeneity in schizophrenia and other psychotic disorders is a major challenge for understanding the relevant biology and developing new treatments. Differing trajectories of development prior to illness onset are an important dimension of this heterogeneity (1), reflecting poorly understood genetic and environmental influences (2, 3) and yet predicting some of the clinical, functional, and biological characteristics of affected adults (4, 5). Three developmental trajectory subtypes are frequently described: one including those with a lifelong history of impaired social, behavioral, and/or intellectual functioning and an insidious progression toward psychotic illness; a second including individuals with a benign developmental course through adolescence followed by a relatively abrupt onset of psychotic symptoms; and a third including individuals who experience a prominent prodromal phase that begins and progresses during adolescence before transitioning into psychosis. These distinctions have been linked to important course, symptom, and outcome variables (6, 7).
Cognitive ability has often served as a developmental marker in psychotic disorders. Abundant research demonstrates histories of academic difficulties, attention disorders, and cognitive testing differences in many children and adolescents who will later develop schizophrenia (810), as well as relatively stable cognitive performance after diagnosis (11). A strategy for using data from adult patients to identify distinct trajectories of cognitive development takes advantage of well-studied patterns on two estimates of intellectual ability: irregular word reading (e.g., the Wide-Range Achievement Test [WRAT] reading subtest [12]) and full-scale IQ (e.g., the Wechsler Adult Intelligence Scale [WAIS] batteries [13]). These measures are generally commensurate in healthy adults (14). However, many people with schizophrenia diverge from the typical pattern, performing at near normal levels on word reading while showing marked impairment on full-scale IQ. This pattern is thought to reflect the maturation and crystallization of word reading skill in advance of the typical time frame for the onset of acute psychotic symptoms, in contrast with the continuing developmental sensitivity of the skills underlying full-scale IQ, and has prompted the use of word reading performance after diagnosis as a proxy for premorbid IQ (14, 15).
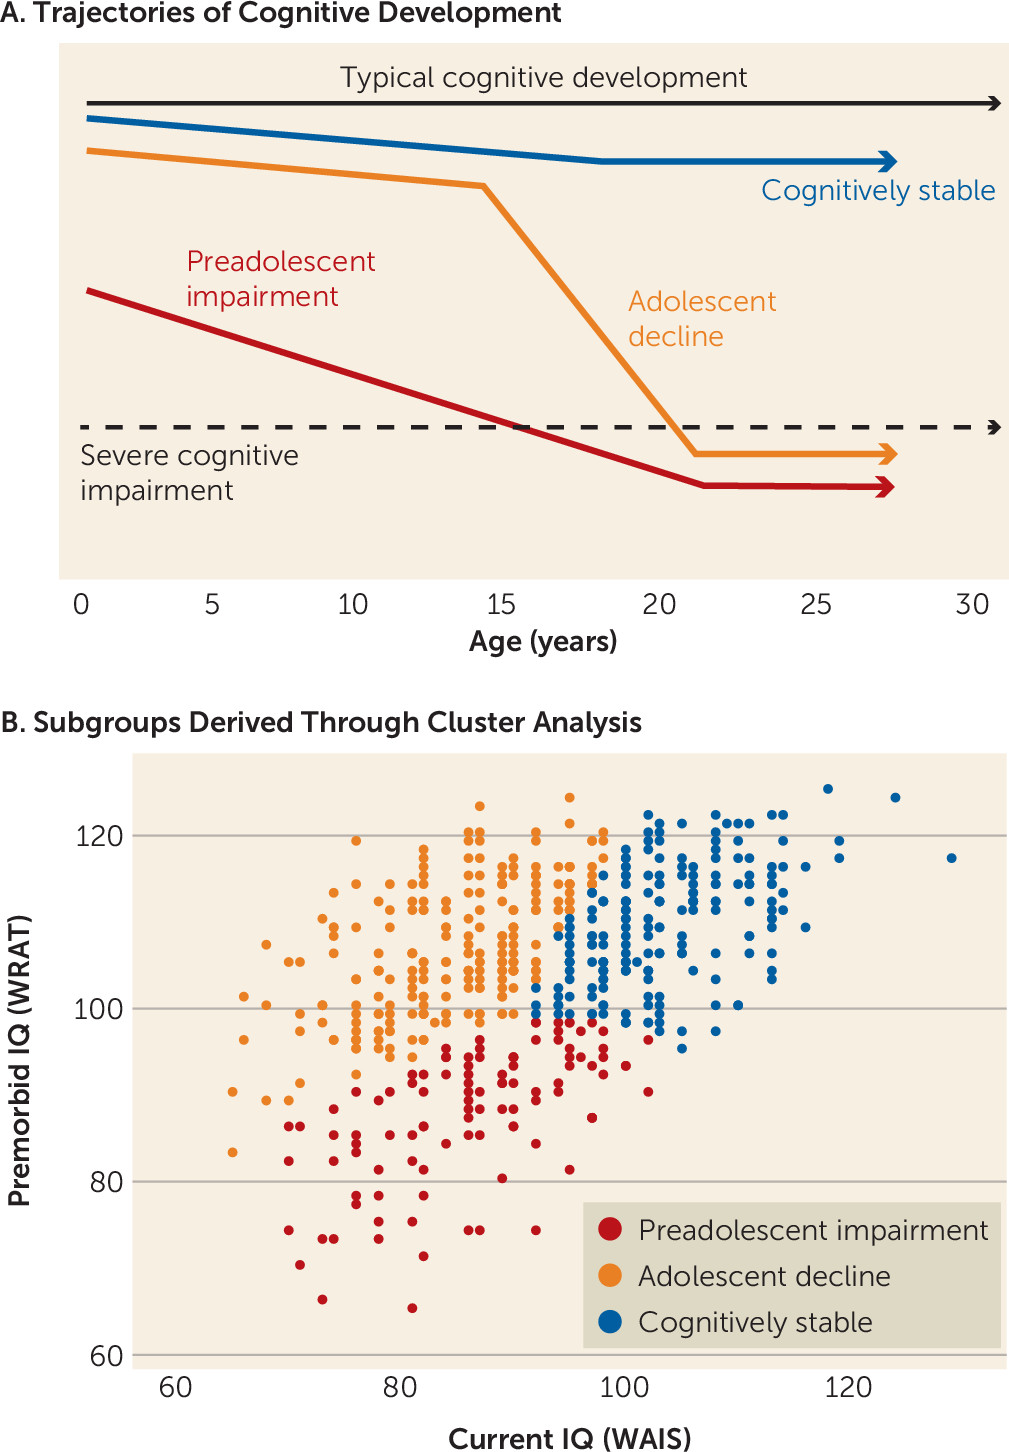
Variation in developmental history has been a target for data-driven subgrouping methods, such as cluster analysis, which parse heterogeneous psychotic disorder samples into subgroups that may be more biologically and behaviorally distinct and treatment relevant (6, 16). Weickert et al. (17) used cluster analysis in 117 schizophrenia patients to show that current (WAIS) and premorbid (WRAT) IQ performance patterns distinguished three subgroups: one with low premorbid and current IQ, suggestive of preadolescent cognitive development issues; one with high premorbid and current IQ, indicating a more stable course of cognitive development; and one with high premorbid IQ but low current IQ, highlighting disruptions to cognitive development during adolescence in particular. These subgroups parallel the broad developmental trajectory subtypes described earlier, reflecting distinct trajectories of cognitive development in schizophrenia (depicted schematically in Figure 1A). In studies following the Weickert et al. study, the premorbid/current IQ subgrouping strategy has proven to be replicable and has shown associations with clinical course, symptom profiles, and functional outcomes (1821). Regarding biological substrates, recent studies have reported subgroup differences in intracranial and total brain volume (22, 23). To our knowledge, no studies have examined the association of premorbid/current IQ subgroups with genome-wide polygenic scores (PGSs), which aggregate the effects of thousands of common genetic markers on particular phenotypes (24, 25).
FIGURE 1. Schematic of cognitive trajectory subtypes and results of premorbid/current IQ cluster analyses in 540 schizophrenia patientsa
a The schematic in panel A depicts three commonly described trajectories of cognitive development up to and through schizophrenia diagnosis: one with evidence of early cognitive impairment suggesting preadolescent developmental issues; one showing a more stable course of cognitive development through adolescence despite emerging psychosis; and one highlighting the adolescent time frame as a period of disrupted cognitive development. The scatterplot in panel B shows the clustering of 540 schizophrenia patients on the basis of premorbid and current IQ into subgroups that align with the three cognitive trajectory subtypes depicted in panel A and with results from earlier studies (17): one with evidence of early cognitive impairment (i.e., low WRAT or premorbid IQ) as well as evidence of ongoing cognitive impairment in adulthood (i.e., low WAIS or current IQ); one with relatively better early cognitive performance (i.e., higher WRAT) and continued better performance in adulthood (i.e., higher WAIS); and one with evidence of relatively good premorbid cognitive performance (i.e., high WRAT) but accompanied by substantially impaired adult performance (i.e., low WAIS). WAIS=Wechsler Adult Intelligence Scale; WRAT=Wide-Range Achievement Test.
Our main goals here were to derive and characterize IQ-based subgroups in a large schizophrenia sample, testing the proposition that these subgroups reflect three distinct trajectories of cognitive development, and to show contrasting profiles of genetic influence—represented here by four PGSs—across the subgroups. Different PGSs can be derived simultaneously in a given sample using results from various genome-wide association studies (GWASs), thus allowing the construction of profiles of influence across multiple genetic dimensions (25). Given that our subgroups were defined by schizophrenia diagnosis and IQ performance patterns, we expected differences in profiles of PGSs for schizophrenia, cognition, educational attainment, and attention deficit hyperactivity disorder (ADHD) that converged with our IQ-based subgrouping. We reasoned that the symptom and outcome differences that have been reported in earlier schizophrenia cognitive subgroup studies (1821) may reflect, in part, differences in underlying schizophrenia genetics. We reasoned further that PGSs for ADHD, cognition, and education would covary in schizophrenia with patterns of current versus premorbid IQ.

Methods

Participants

Our sample consisted of 746 individuals 18–60 years of age (540 of them genotyped) with DSM-IV schizophrenia disorders who were studied at the National Institute of Mental Health Clinical Center between 1996 and 2016. Each study subject was diagnosed by consensus between clinician evaluators using the Structured Clinical Interview for DSM-IV Axis I Disorders (SCID) (26) and available medical records. Participants in the schizophrenia group were stably treated. Full siblings with no history of psychotic disorder (N=370; limited to one per family; 247 genotyped) and community control subjects (N=1,525; 844 genotyped) served as comparison samples. In all samples, participants were excluded if they had a recent or extended past history of substance abuse; a serious medical, neurological, or neurodevelopmental condition; a current learning disorder diagnosis (including dyslexia); or an estimated WAIS IQ below 65. All participants gave written informed consent consistent with National Institutes of Health institutional review board guidelines.

Assessment Procedure

During a 2-day assessment, participants provided demographic information, academic history and learning challenges (e.g., reading or attention difficulties), vocational history, and blood samples for genotyping. They completed a comprehensive neuropsychological battery that yielded a composite index of general cognitive ability (27) (see the Supplementary Methods section in the online supplement). The main analyses focused on a four-subtest estimate of current WAIS IQ (28) and, to index premorbid IQ, the irregular word-reading test from the WRAT (12). The same clinicians who conducted SCID interviews rated participants on the Positive and Negative Syndrome Scale (PANSS) (29), from which composite scores for negative, positive, and concrete/disorganized symptoms were derived (30).

Cluster Analysis

Our hypothesis was that the three premorbid/current IQ schizophrenia subgroups identified in earlier studies would emerge from cluster analyses of WRAT and WAIS IQ. To test this, WRAT and WAIS performance data were analyzed for the full schizophrenia sample using the TwoStep Cluster Analysis procedure in SPSS, version 24 (SPSS, IBM, Armonk, N.Y.; see the online supplement) (31, 32). To reduce collinearity between the two indicators (r=0.50 in the schizophrenia sample), we used their average ([WRAT+WAIS]/2) and difference (WRAT−WAIS) (r=−0.05) as input variables. Unsupervised clustering was performed 1,000 times, with random reorderings, to determine the optimal number of clusters. Results supported a three-cluster solution. Therefore, 50 additional analyses, each specifying three clusters, were used to determine the assignment of individuals to subgroups. General linear model, chi-square, logistic regression, and Fisher’s least significant difference analyses were used to compare groups and subgroups on demographic and clinical variables, controlling for age, sex, and race.

Genotyping and PGS Calculation and Analysis

Genotypes were determined with Illumina BeadChips (510K–2.5M SNP chips) (quality control and other genotyping details are provided in the online supplement). The first 10 principal components of the genomic data (PLINK, version 1.90; https://www.cog-genomics.org/plink/1.9) were derived for use as population stratification covariates. To assess broad differences in subgroup genetics, we used GWAS summary statistics to construct four sets of PGSs in our sample. Schizophrenia PGSs were based on statistics from the 2014 Psychiatric Genomics Consortium schizophrenia GWAS meta-analysis (33) (36,573 schizophrenia case subjects, after excluding the present sample). Three other PGS sets were based on more recent GWAS meta-analyses that did not include our sample (cognition, based on 78,308 individuals [34]; educational attainment, based on 1.1 million individuals [35]; and ADHD, based on 20,183 individuals [36]). In order to match allele frequency variation in the discovery GWAS samples, PGS analyses in the present sample were limited to participants who clustered with HapMap3 CEU and TSI populations (i.e., Caucasians of European descent). After the ancestry restriction, we calculated schizophrenia, cognitive, educational attainment, and ADHD PGSs for 540 people with schizophrenia, 247 of their unaffected full siblings, and 844 control subjects. We derived each of the four PGSs at 10 p-value thresholds (ranging from 5×10⁻⁸ to 1.0) (33). To concentrate the polygenic signal, the 10 scores were reduced to a single score through principal components analysis (37) (see the Supplementary Methods and Results sections in the online supplement).
Subgroup assignments were carried over from schizophrenia cases to 247 unaffected siblings for whom we had genetic data, yielding parallel unaffected sibling subgroups. Control subjects were not assigned to subgroups. Pearson correlations characterized the bivariate associations between PGSs. All group-wise PGS analyses controlled for age, sex, and 10 ancestry-based genomic principal components. Multinomial logistic regression tested whether the four PGSs (entered together) predicted cognitive trajectory subgroup membership. Specifically, this was modeled as the chi-square difference between the full model and a covariates-only model without the PGSs. Effect size was estimated as the difference in Nagelkerke R2 estimates for the two models. Separate general linear model analyses tested whether PGSs for schizophrenia, cognition, education, and ADHD differed by subgroup, with partial eta-squared as the effect size metric. Fisher’s least significant difference analyses were used for pairwise comparisons of PGSs across diagnostic groups and across schizophrenia subgroups.

Results

Table 1 summarizes the characteristics of the 540 schizophrenia patients, 247 unaffected siblings, and 844 community control subjects included in the genetics analyses after ancestry restrictions. Mean age was in the lower 30s for all groups. Relative to siblings and control subjects, the schizophrenia patients were more likely to be male, showed cognitive impairments exceeding one standard deviation on average, and had markedly worse educational performance, employment, and global functioning. As a group, the schizophrenia patients had chronic illness (illness duration, mean=12.3 years, SD=9.5), with moderately severe symptoms (e.g., PANSS total score, mean=60.3, SD=20.9).
TABLE 1. Descriptive statistics for schizophrenia patients, unaffected siblings, and community control subjects (total N=1,631) in a study of cognitive trajectory subgroups and polygenic risk scores in schizophreniaa
 GroupAnalysis
MeasureSchizophrenia Patients (N=540)Unaffected Siblings (N=247)Control Subjects (N=844)StatisticdfpEffect SizePairwise
Demographic characteristics
 N%N%N%     
Male40775.411747.439046.2χ2=114.427.11E–250.091SC>US=CC
Caucasian540100.0247100.0844100.0     
 MeanSDMeanSDMeanSD     
Age (years)34.110.135.210.231.19.7F=25.02, 16272.09E–110.03SC=US>CC
Family SES52.911.853.412.251.611.9F=3.72, 10952.60E–020.007SC=US>CC
Functioning           
Education (years)14.12.115.92.516.62.4F=211.62, 16162.44E–820.208SC<US<CC
GAF score45.214.185.36.487.83.9F=3519.72, 1572<0.00010.817SC<US<CC
 N%N%N%     
Learning difficulties16630.72510.116019.0χ2=26.322.94E–070.028SC>CC>US
Current employment16530.520984.553379.5χ2=305.522.05E–690.261SC<US=CC
 MeanSDMeanSDMeanSD     
Cognition           
WAIS full-scale IQ92.011.4106.410.8109.39.2F=517.12, 16074.12E–1740.392SC<US<CC
WRAT reading test102.910.9106.210.5109.48.4F=81.62, 16141.65E–340.092SC<US<CC
General cognitionb–1.00.7–0.10.50.130.4F=676.42, 15651.96E–2120.464SC<US<CC
Polygenic scores           
Schizophrenia0.410.9–0.010.9–0.301.0F=89.62, 16161.23E–370.1SC>US>CC
Cognition–0.041.0–0.151.00.131.0F=11.52, 16161.10E–050.014SC=US<CC
Education0.021.0–0.11.00.061.0F=4.22, 16160.0160.005US<SC=CC
ADHD0.051.00.041.0–0.041.0F=2.12, 1616ns  
a
Analyses controlled for age and sex and, in analyses of polygenic scores, for 10 ancestry principal components. For pairwise analyses, significance was set at p<0.05, after accounting for three comparisons. For continuous dependent variables, effect size refers to partial eta-squared from general linear model analysis, and for categorical dependent variables, to the difference in Nagelkerke R2 estimates between a covariates-only logistic regression model and a model also including the independent variable of interest. ADHD=attention deficit hyperactivity disorder; CC=community control; GAF=Global Assessment of Functioning Scale; ns=not significant; SES=socioeconomic status (Hollingshead index of socioeconomic status); SC=schizophrenia; US=unaffected sibling.
b
General cognition is a composite of 25 cognitive variables based on earlier work (see the Supplementary Methods section in the online supplement).

Clustering Based on WAIS and WRAT IQ Estimates

In 1,000 unsupervised clustering runs, three-cluster solutions (56.1%) were the most frequent result, followed by four- and six-cluster solutions (23.2% and 11.3%, respectively). Subgroups emerging from the three-cluster solutions were consistent in size, individual subgroup assignments, and mean IQ indicator values. Across 50 further analyses, each constrained to yield three clusters, agreement in assignments of individuals to subgroups was high overall (kappa=0.794) and by subgroup (kappa values, 0.743–0.857). Individuals were assigned to the same subgroup in all 50 runs 53.3% of the time and in at least 30 runs 88.6% of the time. Descriptive statistics are provided in Table 2 for the 540 schizophrenia patients who met ancestry restrictions and had genotype information. Descriptive statistics for all 746 patients, without the ancestry restriction (see Table S1 in the online supplement), demonstrate that apart from race, the characteristics of the subgroups used in genetics analyses closely matched those for the unrestricted subgroups.
TABLE 2. Descriptive statistics for polygenic score analysis samples, by schizophrenia subgroup (total N=540), in a study of cognitive trajectory subgroups and polygenic risk score in schizophreniaa
 GroupAnalysis
MeasurePreadolescent Impairment (N=105)Adolescent Decline (N=237)Cognitively Stable (N=198)StatisticdfpEffect SizePairwise
Demographic characteristics
 N%N%N%     
Male7672.418778.914472.7χ2=2.12ns  
Caucasian105100.0237100.0198100.0     
 MeanSDMeanSDMeanSD     
Age (years)32.48.432.39.937.110.6F=13.92, 5361.00E–060.049PI=AD<CS
Family SES49.210.652.412.655.210.6F=7.42, 3627.16E–040.039PI<AD<CS
Functioning           
Education (years)13.31.913.82.014.82.2F=16.22, 5331.48E–070.057PI<AD<CS
GAF score45.611.742.113.348.715.3F=9.82, 5156.90E–050.046PI=CS>AD
 N%N%N%     
Learning difficulties5047.67130.04422.2χ2=15.524.36E–040.041PI>AD=CS
Currently employed2120.26728.47738.7χ2=9.620.0080.025PI=AD<CS
 MeanSDMeanSDMeanSD     
Cognition           
WAIS full-scale IQ86.48.284.97.5103.46.5F=355.52, 5355.98E–990.571PI=AD<CS
WRAT reading test86.57.8105.67.5108.36.8F=324.32, 5355.62E–930.548PI<AD<CS
General cognitionb–1.50.6–1.40.6–0.50.5F=183.52, 5185.81E–610.415PI=AD<CS
Clinical measures           
Duration of illness (years)11.4811.88.91510.5F=0.72, 518ns  
 N%N%N%     
On antipsychotics10398.120392.618090.7χ2=5.582ns  
 MeanSDMeanSDMeanSD     
Antipsychotic dosage in CPZE (mg/day)651427611413531357F=3.62, 4740.0290.015PI=AD>CS
PANSS           
 Total score59.219.464.121.255.120.1F=7.12, 4239.34E–040.032AD>PI=CS
 Negative score15.68.517.48.914.48.5F=4.22, 4510.0160.018AD>CS
 Positive score8.55.110.25.78.85.3F=3.42, 4300.0350.016PI=CS<AD
 Disorganized score7.73.67.53.95.73.3F=14.92, 4405.30E–070.064PI=AD>CS
Polygenic scores           
Schizophrenia0.421.00.570.90.221.0F=4.52, 5250.0010.026AD>CS
Cognition–0.280.9–0.071.00.121.0F=5.42, 5250.0050.02PI=AD<CS
Education–0.370.90.031.10.230.9F=9.72, 5257.20E–050.036PI<AD<CS
ADHD0.351.0–0.021.1–0.021.0F=5.12, 5250.0070.019PI>AD=CS
a
Analyses controlled for age and sex and, in analyses of polygenic scores, for 10 ancestry principal components. For pairwise analyses, significance was set at p<0.05, after accounting for three comparisons. For continuous dependent variables, effect size refers to partial eta-squared from general linear model analysis, and for categorical dependent variables, to the difference in Nagelkerke R2 estimates between a covariates-only logistic regression model and a model also including the independent variable of interest. AD=adolescent decline; ADHD=attention deficit hyperactivity disorder; CPZE=chlorpromazine equivalents; CS=cognitively stable; GAF=Global Assessment of Functioning Scale; ns=not significant; PANSS=Positive and Negative Syndrome Scale; PI=preadolescent impairment; SES=socioeconomic status (Hollingshead index of socioeconomic status); WAIS=Wechsler Adult Intelligence Scale; WRAT=Wide-Range Achievement Test.
b
General cognition is a composite of 25 cognitive variables based on earlier work (see the Supplementary Methods section in the online supplement).
Across the cluster analyses, 86 individuals (11.4%) were less consistently assigned than others to a specific subgroup. Secondary sensitivity analyses excluding these individuals from the subgroups revealed only minor effects on study results (see the Supplementary Results section and Tables S4 and S5 in the online supplement).

Cognitive Trajectory Subgroup Characteristics and Comparisons

Figure 1A illustrates commonly described trajectories of cognitive development schematically. Figure 1B indicates how the subgroups derived through cluster analysis align with this cognitive development trajectory scheme and, along with Table 2, shows the expected patterns of premorbid (WRAT) and current (WAIS) IQ scores across the three cognitive trajectory subgroups. One subgroup (N=198; 37%) had high mean scores on both of these indicators (“cognitively stable”); a second subgroup (N=105; 19%) had both low premorbid and low current IQs (“preadolescent impairment”); and the third group (N=237; 44%) had high premorbid but low current IQ (“adolescent decline”).
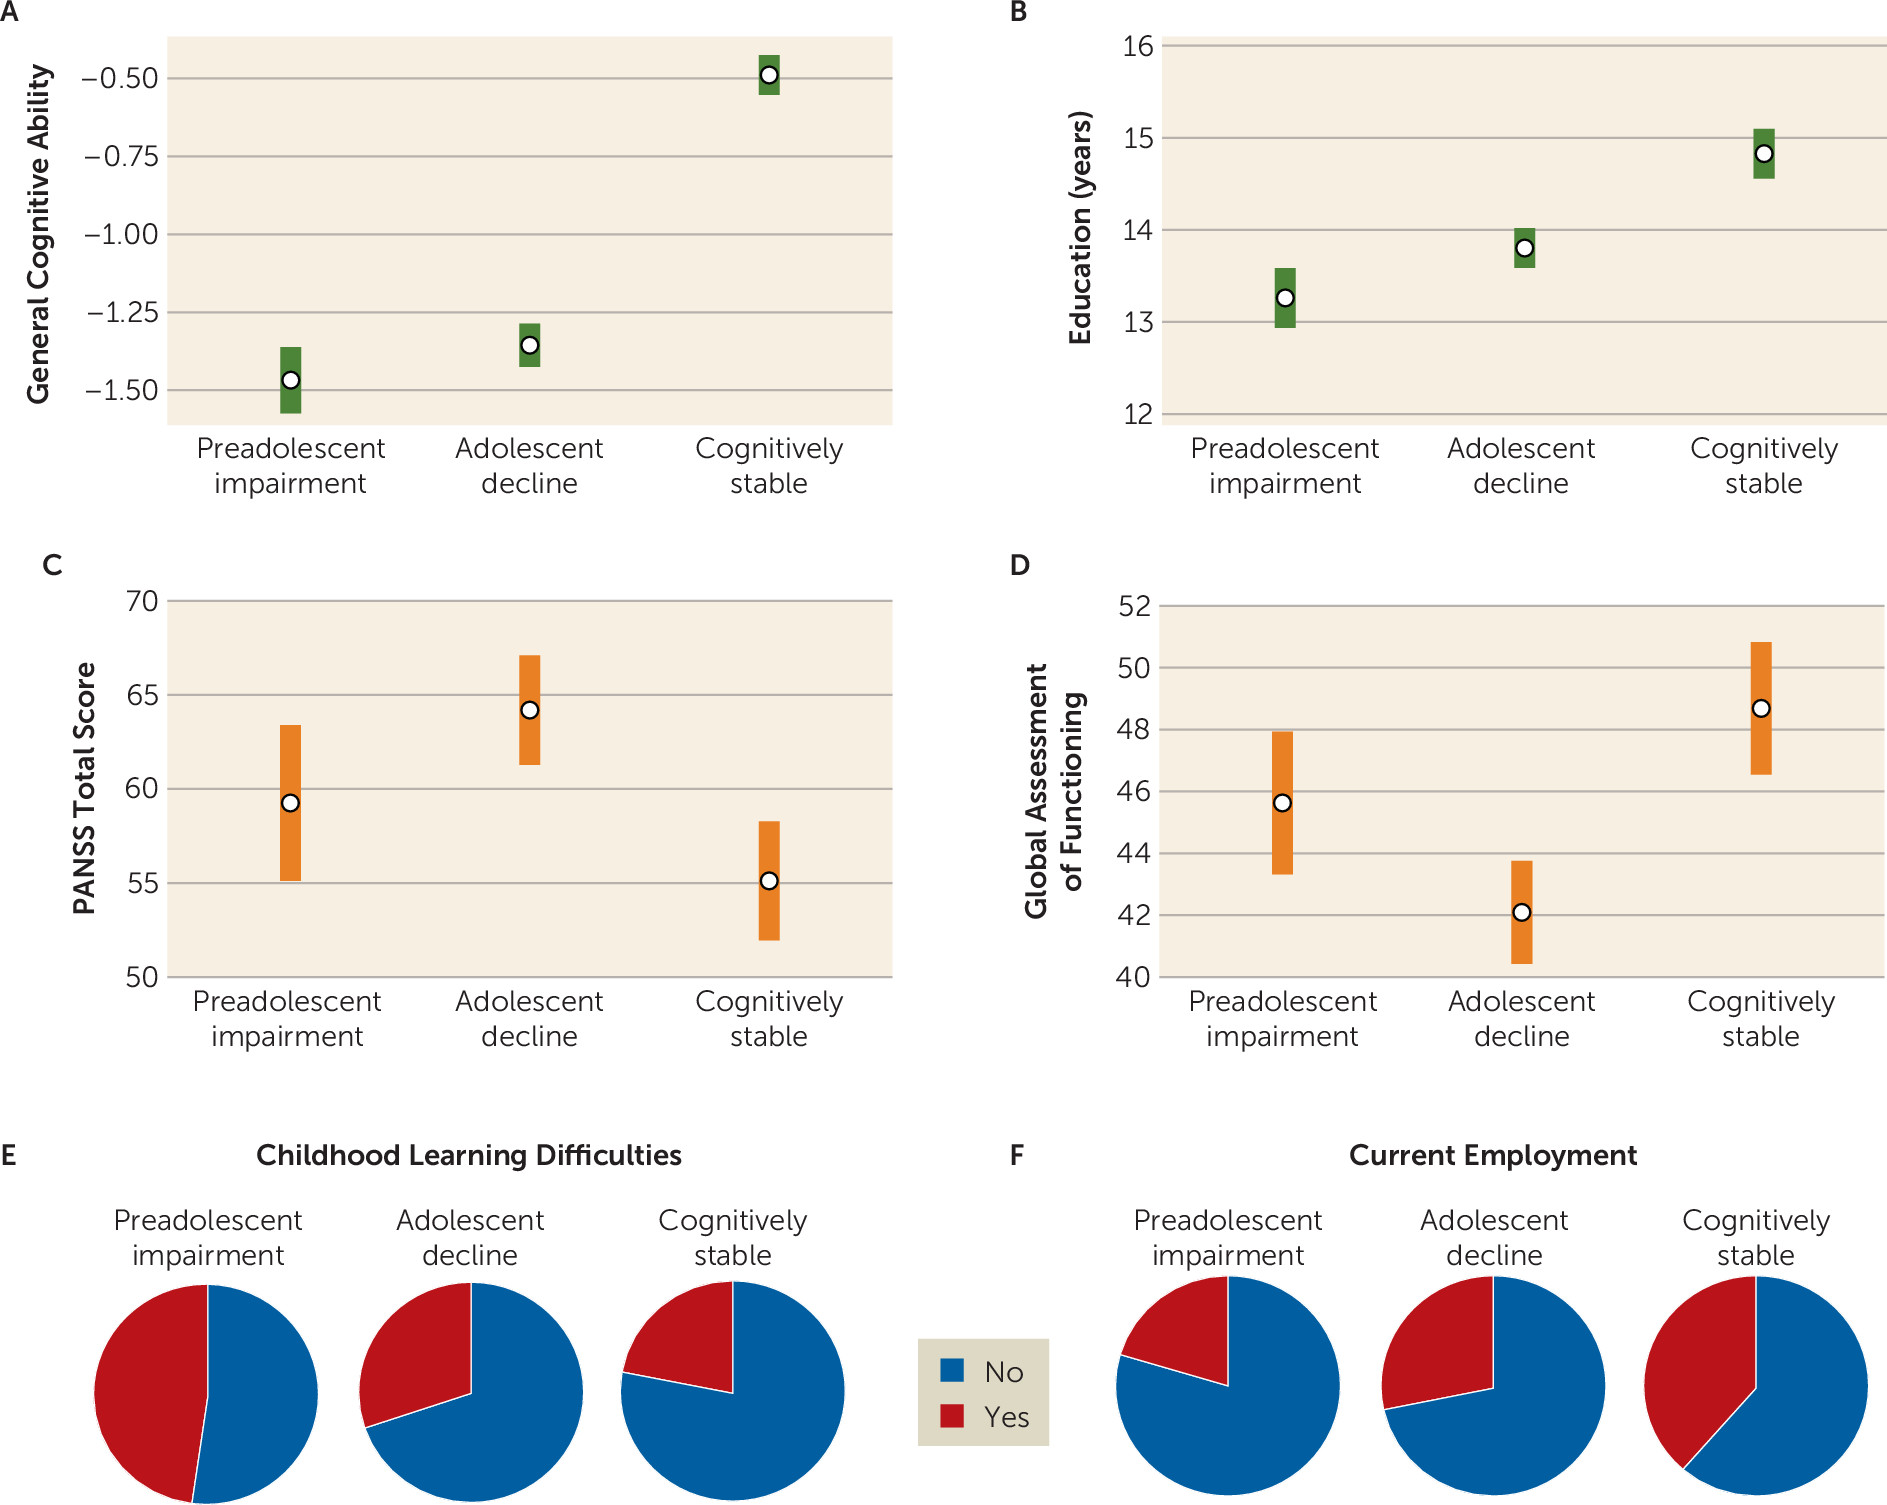
The subgroups also differed significantly on important cognitive, clinical, and functional variables not used in the clustering (detailed in Table 2 and Figure 2). Patients in the cognitively stable subgroup showed markedly less general cognitive impairment than the other subgroups, relatively low symptom severity, more education, and higher levels of employment. The adolescent-decline subgroup had the highest total and positive PANSS scores, the lowest ratings of global functioning, and generalized cognitive impairment. Members of the preadolescent-impairment subgroup had the fewest years of education, the highest rates of childhood learning difficulties, generalized cognitive impairment, and low adult employment.
FIGURE 2. Behavioral characteristics across cognitive trajectory subgroups for 540 schizophrenia patientsa
a Statistical details are provided in Table 2. General cognitive ability (panel A) is indexed by a composite score from a comprehensive neuropsychological battery (27) (see the Supplementary Methods section in the online supplement); the cognitively stable subgroup shows relatively mild general cognitive impairment compared with the other subgroups. The cognitively stable group also completed the most education (panel B), and the preadolescent-impairment subgroup the least, with the adolescent-decline subgroup intermediate. The adolescent-decline subgroup was rated as having the highest symptom severity on the Positive and Negative Syndrome Scale (PANSS) (panel C) and the lowest level of overall functioning (panel D). As shown in panels E and F, the preadolescent-impairment subgroup included the highest proportion of individuals with learning difficulties (e.g., remedial classes, repeated grades) (47.6%), and individuals in the cognitively stable subgroup were most likely to be employed at the time of study participation (38.7%). Error bars represent 95% confidence intervals.
When the cognitive trajectory subgroup assignments were carried over from schizophrenia patients to 247 of their unaffected siblings, the most prominent subgroup differences related to academic and cognitive performance (see the Supplementary Results section and Table S6 in the online supplement). Siblings of the cognitively stable schizophrenia patients had higher levels of education than siblings in the other subgroups. The siblings of preadolescent-impairment patients performed relatively worse on WAIS, WRAT, and general cognitive ability measures, and the cognitively stable siblings performed best. The siblings of adolescent-decline patients performed at an intermediate level relative to the other unaffected sibling subgroups. In general, the sibling findings conformed to the differences observed across the schizophrenia subgroups, but with reduced effect sizes.

PGSs Across Diagnostic Groups

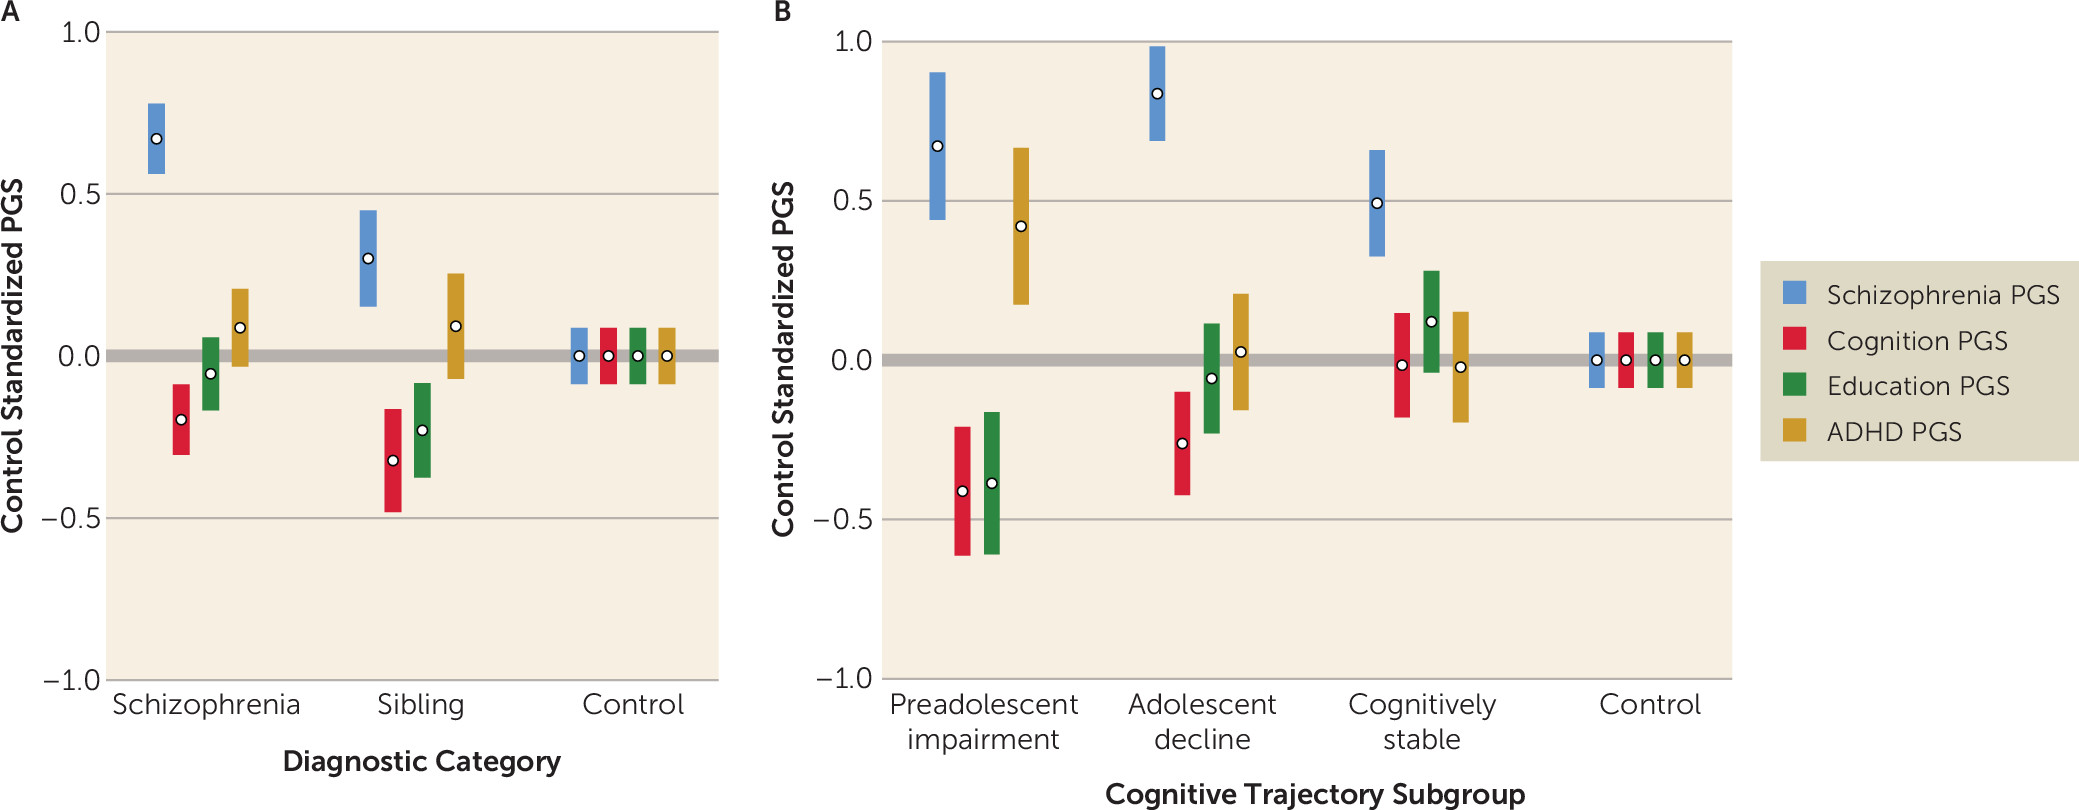
Unsurprisingly, the schizophrenia patients had the highest schizophrenia genetic risk, as indexed by the schizophrenia PGS; the control subjects had the lowest, and unaffected siblings were intermediate between these groups (see Table 1 and Figure 3A). PGSs for cognition and education varied within a narrower range. ADHD PGS did not differ across diagnostic groups. For all groups, PGSs for cognition and education were moderately positively correlated and other PGS correlations were modest (see the Supplementary Results section and Table S2 in the online supplement).
FIGURE 3. Polygenic scores (PGSs) by diagnostic group (total N=1,631) and by schizophrenia cognitive trajectory subgroup (total N=540)a
a Statistical details are provided in Tables 13. The figures depict the profiles of PGSs for the main diagnostic categories in our study (panel A) and the schizophrenia cognitive trajectory subgroups (panel B). PGSs were derived in our samples for schizophrenia, cognition, educational attainment, and attention deficit hyperactivity disorder (ADHD). For the schizophrenia and ADHD PGSs, higher standardized scores indicate higher disorder risk. For cognition and education PGSs, lower standardized scores predict worse cognitive and academic performance. All PGSs were adjusted to account for age, sex, and population stratification and were then standardized. We used control means and standard deviations to standardize the PGSs so that control subjects serve as the reference for differences in PGSs across diagnostic categories and across cognitive trajectory subgroups. Error bars represent 95% confidence intervals.

PGSs in Cognitive Trajectory Subgroups

All PGSs differed significantly across the three cognitive trajectory subgroups, with modest effect sizes (see Table 2 and Figure 3B) and also differed in relation to control subjects (Table 3). Multinomial logistic regression confirmed that PGS patterns across the four polygenic scores significantly predicted cognitive trajectory subgroup membership (Δχ2=43.83, df=8, p=6.10×10⁻⁷, effect size=0.079). Within the multi-PGS model, all the PGSs remained individually significant except the cognition PGS, likely reflecting the previously reported association of cognition and education PGSs (35) (see the Supplementary Results section and Table S2 in the online supplement). Cognitively stable schizophrenia patients had somewhat elevated schizophrenia PGSs but were similar to control subjects across other PGSs, even showing a nominally significant advantage in education PGSs. They had advantageous cognitive PGSs relative to the preadolescent-impairment and adolescent-decline subgroups and advantageous educational attainment PGSs relative to the preadolescent-impairment subgroup. The adolescent decline subgroup had elevated schizophrenia PGSs, which were significantly higher than scores for the cognitively stable subgroup and control subjects, and unfavorable cognition PGSs relative to the same comparison groups. The preadolescent impairment subgroup showed consistently disadvantageous PGSs relative to control subjects. Importantly, this was the only subgroup with significantly elevated ADHD PGSs and significantly reduced educational attainment PGSs.
TABLE 3. General linear model results for contrasts of each polygenic score (PGS) in each cognitive trajectory subgroup with control PGS, in a study of cognitive trajectory subgroup and polygenic risk score in schizophreniaa
 Subgroup (see shaded row headings)Community Control Subjects (N=844)Analysis
PGS and SubgroupMeanSDMeanSDFdfpEffect Size
Cognitively stable (N=198)
Schizophrenia0.221.0–0.301.045.01, 10123.26E–110.042
Cognition0.121.00.131.00.11, 1012ns
Education0.230.90.061.05.31, 10120.020.005
ADHD–0.021.0–0.041.00.91, 1012ns
Adolescent decline (N=237)
Schizophrenia0.570.9–0.301.0168.31, 10677.66E–360.136
Cognition–0.081.00.131.08.21, 10670.0040.008
Education0.021.10.061.00.11, 1067ns
ADHD–0.021.1–0.041.00.51, 1067ns
Preadolescent impairment (N=105)
Schizophrenia0.421.0–0.301.052.61, 9358.62E–130.053
Cognition–0.280.90.131.018.61, 9351.80E–050.019
Education–0.370.90.061.017.81, 9352.70E–050.019
ADHD0.351.0–0.041.016.61, 9354.90E–050.017
a
Analyses controlled for age, sex, and 10 population stratification principal components. Effect size refers to partial eta-squared from general linear model analysis. ADHD=attention deficit hyperactivity disorder; ns=not significant.
PGS profiles in 247 unaffected siblings were generally similar to profiles in corresponding subgroups of schizophrenia patients (compare Figure 3B and Figure S2 in the online supplement). As found in schizophrenia patients, PGS profile significantly predicted sibling cognitive trajectory subgroup assignment (Δχ2=23.87, df=8, p=0.002, effect size=0.093). While schizophrenia PGSs and ADHD PGSs did not differ by subgroup in siblings, for both cognition and educational attainment, the siblings of the preadolescent-impairment schizophrenia patients had significantly lower PGSs than those in the other sibling subgroups and control subjects (see Tables S6 and S7 and Figure S2 in the online supplement).

Discussion

Our goals in this study were, first, to use an IQ-based strategy in a large and extensively phenotyped schizophrenia sample to identify and characterize subgroups with different pre-diagnosis trajectories of cognitive development and, second, to test whether the profiles of four polygenic scores—separately summarizing the influence of common genetic variants associated with schizophrenia, general cognition, educational attainment, and ADHD—differed by subgroup. The resulting IQ patterns and PGS profiles were consistent with hypotheses and congruent in interesting ways. Cluster analysis based only on “premorbid” (WRAT) and current (WAIS) IQ strongly supported a three-subgroup model, similar to findings in earlier studies (18, 20, 21), with cognitively stable, adolescent-decline, and preadolescent-impairment subgroups. Distinct cognitive, clinical, and functional characteristics across subgroups helped validate the guiding cognitive development trajectories framework. Finally, profiles of the four PGSs showed a remarkable convergence with the developmental framework and with subgroup characteristics.
For 37% of the sample, relatively strong performance on both the WRAT and the WAIS suggested a stable cognitive development trajectory, with good early-life cognitive and educational functioning and a more limited impact of emerging psychosis on cognition. Subgroup clinical and functional characteristics in adulthood—beyond WRAT and WAIS results—indicated that individuals in this subgroup had a milder course of illness with relatively lower levels of schizophrenia symptoms (particularly negative symptoms), a strong advantage in general cognitive performance, and higher levels of employment than their peers. The PGS profile for the cognitively stable subgroup was, likewise, relatively more benign than the profiles for the other schizophrenia subgroups. Individuals in this group were similar to control subjects on PGSs for cognition and ADHD. They showed a slight advantage on education PGS, which may relate to a previously reported and counterintuitive positive association between schizophrenia and education PGS (35, 38). These individuals were only disadvantaged relative to control subjects on schizophrenia PGS.
For the adolescent-decline subgroup, which accounted for 44% of the sample, the matrix of findings was quite different. For these individuals, premorbid IQ in the normal range combined with substantially impaired current IQ suggested a disruption of cognitive development during adolescence, likely overlapping with psychosis prodrome and onset. Illness course and outcome for this subgroup were unfavorable. As adults, in addition to broadly impaired cognitive performance, members of the adolescent-decline subgroup had the most severe schizophrenia symptoms among the subgroups, especially positive symptoms, as well as low levels of employment and the lowest Global Assessment of Functioning ratings. Those in the adolescent-decline group also showed a distinct and unfavorable PGS profile, with a significant disadvantage in terms of schizophrenia and cognition PGSs relative to control subjects and those in the cognitively stable subgroup.
The preadolescent-impairment subgroup, comprising 19% of the sample, was also distinctive. Substantial impairment in both WRAT and WAIS performance in this group suggested early-life divergence from typical cognitive development. Supporting this interpretation, the subgroup had the highest rates of childhood learning problems and the fewest years of education completed. These individuals also had globally impaired cognition and low rates of employment in adulthood. Symptoms were intermediate relative to the cognitively stable and adolescent-decline subgroups. Individuals in the preadolescent-impairment subgroup showed a generalized profile of unfavorable PGSs across the four phenotypes. They were at a significant disadvantage in all PGSs relative to control subjects, and in all but schizophrenia PGS relative to the cognitively stable subgroup. It is particularly striking in light of evidence of early-life cognitive and academic abnormalities that this was the only cognitive trajectory subgroup with robust disadvantages in both education and ADHD PGSs, perhaps suggesting a distinct genetic etiology.
The PGS profile for each unaffected sibling subgroup was consistent with the profile in the corresponding schizophrenia subgroup, although only the cognition and education PGSs differed significantly across the sibling subgroups. As with the schizophrenia subgroups, PGS profiles predicted sibling subgroup assignments, and sibling subgroup PGS differences converged with differences in observed academic and cognitive performance. This consistency of affected and unaffected sibling subgroup PGS profiles and associations is further evidence of the importance of inherited polygenic factors in distinguishing the cognitive trajectory subgroups.
Although cognitive impairment is common in schizophrenia, the extent of impairment and the trajectory of development leading to impairment vary considerably. A literature seeking to address this heterogeneity has proposed that developmental trajectory subgroups with distinct patterns of course and outcome can be formed using estimates of premorbid and current intellectual functioning (1721). Recent work has identified brain structure differences across subgroups (22, 23), but genetic differences have not been examined.
With the completion in recent years of high-quality GWASs for many common disorders and traits, PGSs are becoming accessible research tools. Combined with the increasing availability of large, comprehensively phenotyped and genotyped samples, PGSs have also evolved rapidly as clinical tools, now providing actionable information in conditions such as coronary artery disease (39). Despite these promising developments, the clinical utility of PGSs in psychiatry is less clear. The variance in diagnostic status explained by any single PGS is not yet adequate to allow biologically informed diagnosis or helpful clinical stratification (2, 3). Among other factors, comorbidities and pleiotropy in psychiatric disorders and genetic correlations between the disorders and traits such as cognition and education greatly complicate the resolution of genetic influences and risk (38).
On the other hand, it is exactly these characteristics of psychiatric disorders that may make simultaneous analysis of multiple PGSs a potent strategy for resolving developmental and diagnostic heterogeneity (40). The present results offer support for this approach. The set of PGSs included diagnosis-based (schizophrenia and ADHD) and trait-based (cognition and education) PGSs, and both contributed to subgroup differentiation. Together, the four PGSs predicted 7.9% of the variance in cognitive trajectory subgroup membership. Although variance explained was relatively modest, employing a set of PGSs was useful in shifting focus beyond simple case-control discrimination toward the prediction of important within-diagnosis differences, and we draw encouragement from the fact that we accounted for within-group variance at a level comparable to that of studies focused on between-group variance (33, 36). Thus, in ways that parallel recent findings for depression onset (40), PGS profiles discriminated cognitive developmental trajectories in schizophrenia and were, to a degree, clinically informative, showing associations with facets of illness course and outcome. To be clear, the present findings that four PGSs account for a modest proportion of variance across cognitive development trajectories in schizophrenia do not provide a basis for clinical stratification of new patients or individuals at risk of illness. However, this work illustrates how multiple PGSs might contribute in the future to stratification that has not been achievable in psychiatric disorders with single-diagnosis PGSs.
Various limitations of this study should be considered. The samples are small by the standards of genetics analyses, and the findings await replication (24). At the same time, while modest in size, the present sample offers a consistent ascertainment approach, comparison samples, and extensive clinical, cognitive, and functional data, as well as genotypes. Moreover, key statistical findings were robust. Another limitation involves the subgrouping approach. Lacking detailed information about developmental history in each case, we employed a proxy measure of “premorbid IQ” as one cornerstone of our subgrouping, as others have done (17), providing an estimate of cognitive performance in early adolescence, prior to the onset of psychosis. Contrasting characteristics of the subgroups provided some validation of the strategy, but it would be preferable to analyze direct information about pre-diagnosis developmental history (40).
The use of current methods for creating PGSs also involves certain limitations. Although it is clear that psychiatric disorders involve both common and rare forms of genetic variation, PGSs reflect only common genetic variants, missing important elements of the genetic landscape (2). Furthermore, PGSs reflect small genetic effects across the genome and offer limited traction for the investigation of specific biological mechanisms. Notably, the various GWASs on which this study’s PGSs were based involved overwhelmingly Caucasian samples. We restricted our analyses accordingly. The strategies employed here may not be available for non-Caucasian samples until high-quality GWASs in such samples are completed.
In conclusion, the findings of this study suggest that adult cognitive data can be used to generate schizophrenia subgroups with distinct trajectories of cognitive development, and that these subgroups are characterized by quite different profiles of psychiatric, cognitive, and academic genetic influence.
Supplementary Material

File (appi.ajp.2019.19050527.ds001.pdf)

References

1.
Walker EF: Schizophrenia: A Life-Course Developmental Perspective. San Diego, Academic Press, 1991
2.
Smoller JW, Andreassen OA, Edenberg HJ, et al: Psychiatric genetics and the structure of psychopathology. Mol Psychiatry 2019; 24:409–420
3.
Weinberger DR: Thinking about schizophrenia in an era of genomic medicine. Am J Psychiatry 2019; 176:12–20
4.
Kendler KS, Ohlsson H, Keefe RSE, et al: The joint impact of cognitive performance in adolescence and familial cognitive aptitude on risk for major psychiatric disorders: a delineation of four potential pathways to illness. Mol Psychiatry 2018; 23:1076–1083
5.
Mollon J, Reichenberg A: Cognitive development prior to onset of psychosis. Psychol Med 2018; 48:392–403
6.
Cole VT, Apud JA, Weinberger DR, et al: Using latent class growth analysis to form trajectories of premorbid adjustment in schizophrenia. J Abnorm Psychol 2012; 121:388–395
7.
Larsen TK, Friis S, Haahr U, et al: Premorbid adjustment in first-episode non-affective psychosis: distinct patterns of pre-onset course. Br J Psychiatry 2004; 185:108–115
8.
Kendler KS, Ohlsson H, Sundquist J, et al: IQ and schizophrenia in a Swedish national sample: their causal relationship and the interaction of IQ with genetic risk. Am J Psychiatry 2015; 172:259–265
9.
Maccabe JH: Population-based cohort studies on premorbid cognitive function in schizophrenia. Epidemiol Rev 2008; 30:77–83
10.
Reichenberg A, Weiser M, Rapp MA, et al: Elaboration on premorbid intellectual performance in schizophrenia: premorbid intellectual decline and risk for schizophrenia. Arch Gen Psychiatry 2005; 62:1297–1304
11.
Lewandowski KE, Cohen BM, Ongur D: Evolution of neuropsychological dysfunction during the course of schizophrenia and bipolar disorder. Psychol Med 2011; 41:225–241
12.
Wilkinson G: Wide Range Achievement Test–Revision 3: Administration Manual. Wilmington, Del, Wide Range, Inc, 1993
13.
Wechsler D: Wechsler Adult Intelligence Test, 4th ed. San Antonio, Tex, Psychological Corp, 2008
14.
O’Carroll R, Walker M, Dunan J, et al: Selecting controls for schizophrenia research studies: the use of the National Adult Reading Test (NART) is a measure of premorbid ability. Schizophr Res 1992; 8:137–141
15.
Kremen WS, Pepple JR, Tsuang MT, et al: The “3 Rs” and neuropsychological function in schizophrenia: an empirical test of the matching fallacy. Neuropsychology 1996; 10:22–31
16.
Horton LE, Tarbox SI, Olino TM, et al: Trajectories of premorbid childhood and adolescent functioning in schizophrenia-spectrum psychoses: a first-episode study. Psychiatry Res 2015; 227:339–346
17.
Weickert TW, Goldberg TE, Gold JM, et al: Cognitive impairments in patients with schizophrenia displaying preserved and compromised intellect. Arch Gen Psychiatry 2000; 57:907–913
18.
Badcock JC, Dragović M, Waters FA, et al: Dimensions of intelligence in schizophrenia: evidence from patients with preserved, deteriorated, and compromised intellect. J Psychiatr Res 2005; 39:11–19
19.
Joyce EM, Hutton SB, Mutsatsa SH, et al: Cognitive heterogeneity in first-episode schizophrenia. Br J Psychiatry 2005; 187:516–522
20.
Leeson VC, Sharma P, Harrison M, et al: IQ trajectory, cognitive reserve, and clinical outcome following a first episode of psychosis: a 3-year longitudinal study. Schizophr Bull 2011; 37:768–777
21.
Wells R, Swaminathan V, Sundram S, et al: The impact of premorbid and current intellect in schizophrenia: cognitive, symptom, and functional outcomes. NPJ Schizophr 2015; 1:15043
22.
Czepielewski LS, Wang L, Gama CS, et al: The relationship of intellectual functioning and cognitive performance to brain structure in schizophrenia. Schizophr Bull 2017; 43:355–364
23.
Woodward ND, Heckers S: Brain structure in neuropsychologically defined subgroups of schizophrenia and psychotic bipolar disorder. Schizophr Bull 2015; 41:1349–1359
24.
Dudbridge F: Power and predictive accuracy of polygenic risk scores. PLoS Genet 2013; 9:e1003348
25.
Krapohl E, Euesden J, Zabaneh D, et al: Phenome-wide analysis of genome-wide polygenic scores. Mol Psychiatry 2016; 21:1188–1193
26.
First M, Spitzer R, Gibbon M, et al: Structured Clinical Interview for DSM-IV Axis I Disorders. New York, New York State Psychiatric Institute, Biometrics Research, 1994
27.
Dickinson D, Goldberg TE, Gold JM, et al: Cognitive factor structure and invariance in people with schizophrenia, their unaffected siblings, and controls. Schizophr Bull 2011; 37:1157–1167
28.
Kaufman A: Assessing Adolescent and Adult Intelligence. Boston, Allyn and Bacon, 1990
29.
Kay SR, Fiszbein A, Opler LA: The Positive and Negative Syndrome Scale (PANSS) for schizophrenia. Schizophr Bull 1987; 13:261–276
30.
Wallwork RS, Fortgang R, Hashimoto R, et al: Searching for a consensus five-factor model of the Positive and Negative Syndrome Scale for schizophrenia. Schizophr Res 2012; 137:246–250
31.
Chiu T, Fang D, Chen J, et al: A robust and scalable clustering algorithm for mixed type attributes in large database environment, in the 7th ACM SIGKDD International Conference on Knowledge Discovery and Data Mining, 2001, pp 263–268
32.
Norusis MJ: IBM SPSS Statistics 19 Statistical Procedures Companion. Upper Saddle River, NJ, Prentice Hall, 2011
33.
Schizophrenia Working Group of the Psychiatric Genomics Consortium: Biological insights from 108 schizophrenia-associated genetic loci. Nature 2014; 511:421–427
34.
Sniekers S, Stringer S, Watanabe K, et al: Genome-wide association meta-analysis of 78,308 individuals identifies new loci and genes influencing human intelligence. Nat Genet 2017; 49:1107–1112
35.
Lee JJ, Wedow R, Okbay A, et al: Gene discovery and polygenic prediction from a genome-wide association study of educational attainment in 1.1 million individuals. Nat Genet 2018; 50:1112–1121
36.
Demontis D, Walters RK, Martin J, et al: Discovery of the first genome-wide significant risk loci for attention deficit/hyperactivity disorder. Nat Genet 2019; 51:63–75
37.
Bergen SE, Ploner A, Howrigan D, et al: Joint contributions of rare copy number variants and common SNPs to risk for schizophrenia. Am J Psychiatry 2018; 176:29–35
38.
Brainstorm Consortium, Anttila V, Bulik-Sullivan B, et al: Analysis of shared heritability in common disorders of the brain. Science 2018; 360:eaap8757
39.
Khera AV, Chaffin M, Aragam KG, et al: Genome-wide polygenic scores for common diseases identify individuals with risk equivalent to monogenic mutations. Nat Genet 2018; 50:1219–1224
40.
Rice F, Riglin L, Thapar AK, et al: Characterizing developmental trajectories and the role of neuropsychiatric genetic risk variants in early-onset depression. JAMA Psychiatry 2019; 76:306–313

Information & Authors

Information

Published In

Go to American Journal of Psychiatry
American Journal of Psychiatry
Pages: 298 - 307
PubMed: 31838871

History

Received: 22 May 2019
Revision received: 6 September 2019
Accepted: 23 September 2019
Published online: 16 December 2019
Published in print: April 01, 2020

Keywords

  1. Schizophrenia
  2. Cognition
  3. Polygenic Score
  4. Premorbid IQ
  5. Genetics
  6. Developmental Trajectory

Authors

Details

Dwight Dickinson, Ph.D., J.D. [email protected]
Clinical and Translational Neuroscience Branch, NIMH, Bethesda, Md.
Sofia R. Zaidman, B.A.
Clinical and Translational Neuroscience Branch, NIMH, Bethesda, Md.
Evan J. Giangrande, M.A.
Clinical and Translational Neuroscience Branch, NIMH, Bethesda, Md.
Daniel P. Eisenberg, M.D.
Clinical and Translational Neuroscience Branch, NIMH, Bethesda, Md.
Michael D. Gregory, M.D.
Clinical and Translational Neuroscience Branch, NIMH, Bethesda, Md.
Karen F. Berman, M.D.
Clinical and Translational Neuroscience Branch, NIMH, Bethesda, Md.

Notes

Send correspondence to Dr. Dickinson ([email protected]).

Competing Interests

The authors report no financial relationships with commercial interests.

Funding Information

Division of Intramural Research, National Institute of Mental Health: NCT 95-M-0150
Supported with funding from the Division of Intramural Research Programs, NIMH, to programs within the NIMH Clinical and Translational Neuroscience Branch (Dr. Berman, principal investigator), clinical study number NCT 95-M-0150 and annual report number MH002652-25.

Metrics & Citations

Metrics

Citations

Export Citations

If you have the appropriate software installed, you can download article citation data to the citation manager of your choice. Simply select your manager software from the list below and click Download.

For more information or tips please see 'Downloading to a citation manager' in the Help menu.

Format
Citation style
Style
Copy to clipboard

View Options

View options

PDF/EPUB

View PDF/EPUB

Get Access

Login options

Already a subscriber? Access your subscription through your login credentials or your institution for full access to this article.

Personal login Institutional Login Open Athens login
Purchase Options

Purchase this article to access the full text.

PPV Articles - American Journal of Psychiatry

PPV Articles - American Journal of Psychiatry

Not a subscriber?

Subscribe Now / Learn More

PsychiatryOnline subscription options offer access to the DSM-5-TR® library, books, journals, CME, and patient resources. This all-in-one virtual library provides psychiatrists and mental health professionals with key resources for diagnosis, treatment, research, and professional development.

Need more help? PsychiatryOnline Customer Service may be reached by emailing [email protected] or by calling 800-368-5777 (in the U.S.) or 703-907-7322 (outside the U.S.).

Media

Figures

Other

Tables

Share

Share

Share article link

Share