Abstract

Objective:

Cerebral small vessel disease (SVD) is considered the most important vascular contributor to cognitive decline and dementia, although a causal relation between its MRI markers and dementia still needs to be established. The authors investigated the relation between baseline SVD severity as well as SVD progression on MRI markers and incident dementia, by subtype, in individuals with sporadic SVD over a follow-up period of 14 years.

Methods:

The study included 503 participants with sporadic SVD, and without dementia, from the prospective Radboud University Nijmegen Diffusion Tensor and Magnetic Resonance Cohort (RUN DMC) study, with screening for baseline inclusion conducted in 2006. Follow-ups in 2011, 2015, and 2020 included cognitive assessments and MRI scans. Dementia was diagnosed according to DSM-5 criteria and stratified into Alzheimer’s dementia and vascular dementia.

Results:

Dementia as an endpoint was available for 498 participants (99.0%) and occurred in 108 participants (21.5%) (Alzheimer’s dementia, N=38; vascular dementia, N=34; mixed-etiology Alzheimer’s dementia/vascular dementia, N=26), with a median follow-up time of 13.2 years (interquartile range, 8.8–13.8). Higher baseline white matter hyperintensity (WMH) volume (hazard ratio=1.31 per 1-SD increase, 95% CI=1.02–1.67), presence of diffusion-weighted-imaging-positive lesions (hazard ratio=2.03, 95% CI=1.01–4.04), and higher peak width of skeletonized mean diffusivity (hazard ratio=1.24 per 1-SD increase, 95% CI=1.02–1.51) were independently associated with all-cause dementia and vascular dementia. WMH progression predicted incident all-cause dementia (hazard ratio=1.76 per 1-SD increase, 95% CI=1.18–2.63).

Conclusions:

Both baseline SVD severity and SVD progression were independently associated with an increase in risk of all-cause dementia over a follow-up of 14 years. The results suggest that SVD progression precedes dementia and may causally contribute to its development. Slowing SVD progression may delay dementia onset.
Cerebral small vessel disease (SVD) is considered the most important vascular contributor to cognitive decline and dementia (1, 2). SVD causes damage to the brain parenchyma, detected with MRI by several characteristics, including white matter hyperintensities (WMHs), lacunes of presumed vascular origin, cerebral microbleeds, and recent small subcortical infarcts (3). Although a causal relation between SVD and dementia is assumed from a neurobiological perspective, an indisputable independent relation between MRI markers of SVD and dementia still needs to be established. These MRI markers, especially WMHs, do not necessarily reflect the underlying biology of the disease and do not directly translate to biology at the tissue level.
Several studies have shown associations between various MRI markers of SVD and all-cause dementia. However, these studies often had follow-up durations of only several years, did not adjust for concurrent neurodegeneration, or did not examine SVD progression over a long period in relation to incident dementia (1, 47). Therefore, the evidence so far has not yet established an independent role of MRI markers of SVD in all-cause dementia. Long follow-up is required, since SVD progresses slowly and patients express little or no cognitive change over shorter time periods (8, 9).
Although formal evidence for the presumed causal role of SVD in the development of dementia can only be provided by randomized intervention research, strong support for such a relation can be obtained in longitudinal observational research by demonstrating a dose-response relationship, temporality, and nonspuriousness (10). We therefore investigated the relation between baseline SVD severity as well as SVD progression and incident all-cause dementia, stratified into Alzheimer’s dementia and vascular dementia, while adjusting for hippocampal atrophy (as an imaging marker for neurodegenerative processes). We did this in 503 individuals with sporadic SVD who were free of dementia at baseline, over a uniquely long-term follow-up period of 14 years.
We hypothesized that both high baseline SVD severity and a higher rate of SVD progression are independently associated with an increased risk of all-cause dementia, especially for the incidence of vascular dementia.

Methods

Study Design and Population

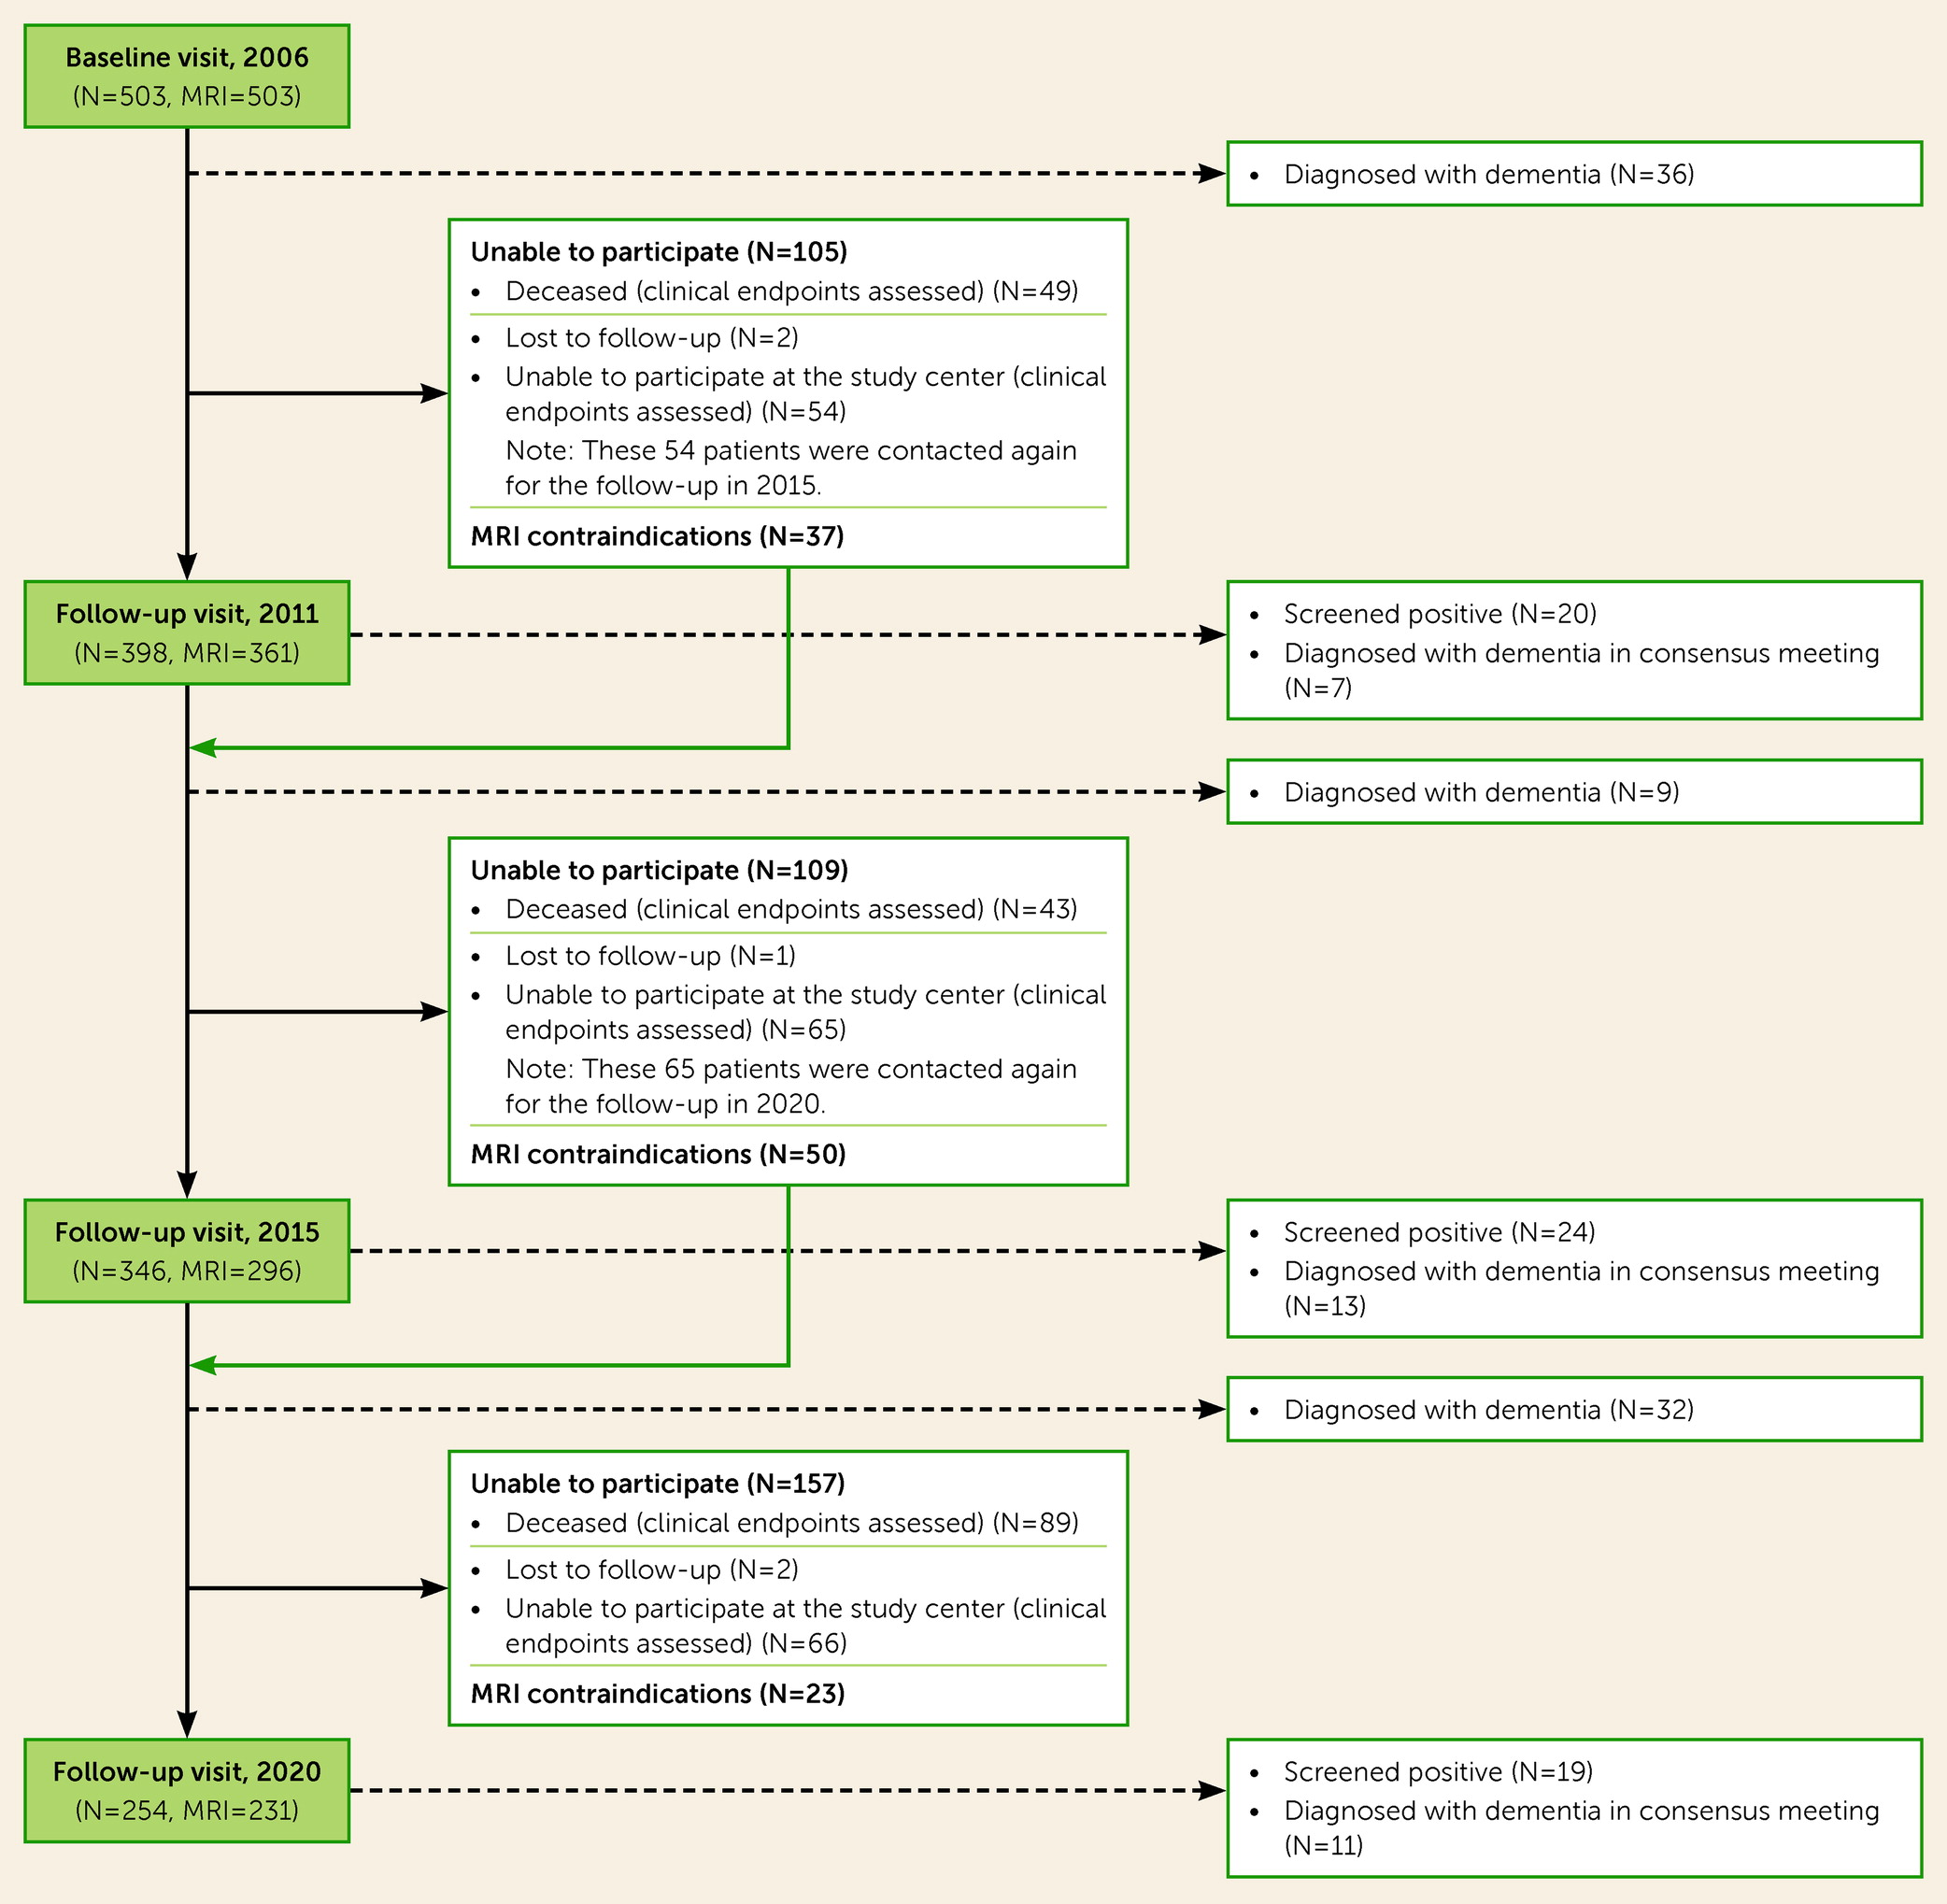
This study is embedded within the long-term Radboud University Nijmegen Diffusion Tensor and Magnetic Resonance Cohort (RUN DMC) study in individuals with sporadic SVD, which investigates the risk factors and clinical outcomes of SVD. The study rationale and protocol have been reported previously (11). In short, a total of 503 consecutive community-dwelling patients, ages 50–85 years, who were referred to the Radboud University Medical Center neurology outpatient clinic and who underwent brain MRI were screened for baseline inclusion in 2006. SVD diagnosis was based on MRI and included presence of WMHs or lacunes (12). The main exclusion criteria at baseline were presence of dementia, parkinsonism, non-SVD-related white matter lesions (e.g., multiple sclerosis), or a life expectancy of less than 6 months. Follow-up assessments took place in 2011, 2015, and 2020. At all time points, patients completed structured medical questionnaires and underwent physical examination, motor tests, standardized neuropsychological examination, and brain MRI. A flowchart of patient participation in all follow-ups is provided in Figure S1 in the online supplement.
The Medical Review Ethics Committee region Arnhem‐Nijmegen approved the study, and all participants gave written informed consent.

Neuropsychological Examination and Education Classification

Cognitive function at baseline and at all follow-up waves was assessed by a standardized neuropsychological test battery covering the following cognitive domains: working and episodic memory, executive function, psychomotor speed, fluency, and attention. The cognitive tests have been described in detail elsewhere; parallel versions were used when appropriate to overcome material-specific practice effects (13).
Education level was classified into seven levels in accordance with the Dutch educational system (1 indicates having less than a complete primary education and 7 indicates having a university degree or higher). We then dichotomized these into two categories, namely, primary education or less (levels 1–2) and more than primary education (levels 3–7).

Vascular Risk Factors

Hypertension was defined as a systolic blood pressure ≥140 mmHg and/or a diastolic blood pressure ≥90 mmHg at the baseline examination or the use of blood-pressure-lowering medications. Diabetes and hypercholesterolemia were considered to be present if the patient was taking oral glucose-lowering drugs, insulin, or lipid-lowering drugs. Information on smoking status was dichotomized into ever (current or former) or never smoking.

MRI Protocol

Images were acquired on 1.5-T MRI scanners (in 2006, Magnetom Sonata [Siemens]; in 2011 and 2015, Magnetom Avanto [Siemens]) and included the following whole-brain scans: three-dimensional T1 MPRAGE imaging (isotropic voxel size, 1.0 mm3); FLAIR sequences (2006: voxel size=0.5×0.5×5.0 mm, interslice gap=1.0 mm; 2011 and 2015: voxel size=0.5×0.5×2.5 mm, interslice gap=0.5 mm); and a transversal T2*-weighted gradient echo sequence (2006: isotropic voxel size=2.5 mm3, four unweighted scans, and 30 diffusion-weighted scans at b=900 s/mm2; 2011 and 2015: eight unweighted scans and 60 diffusion-weighted scans at b=900 s/mm2). The same head coil was used at both time points. Full acquisition details have been described previously (11).

Brain Volumetry

Gray matter volume, white matter volume, and CSF volume were assessed using SPM12 (https://www.fil.ion.ucl.ac.uk/spm) unified segmentation routines on the T1 MPRAGE images corrected for WMHs, as described in detail previously (14). Intracranial volume (ICV) was calculated by summing gray matter volume, white matter volume, and CSF volume as well as total brain volume by summing gray matter and white matter volumes. To correct for interscan effects, we corrected for differences in ICV between baseline and follow-up. We normalized all volumes to baseline ICV to account for head size. Hippocampal volume segmentations were automatically processed with the longitudinal stream in FreeSurfer, version 5.3 (15). The calculation of hippocampal segmentations has been reported in detail previously (16).

MRI Markers of SVD

MRI markers of SVD were rated according to the Standards for Reporting Vascular Changes on Neuroimaging (STRIVE) criteria (3). WMH volumes were calculated by a semiautomatic WMH segmentation method, described in detail elsewhere (17). Segmentations were visually checked for segmentation errors by one trained rater, blinded for clinical data. To minimize the effects of changes in FLAIR acquisition sequence parameters, follow-up FLAIR images were resliced to match baseline slice thickness using FMRIB’s Linear Image Registration Tool (FLIRT), which is part of FSL. WMH volumes were normalized to ICV. Follow-up WMH volumes were corrected to baseline ICV, so that WMH volumetric changes over time could be quantified. Lacunes and cerebral microbleeds were rated manually on FLAIR/T1-weighted and T2*-weighted MRI scans, respectively. Both markers were rated by two trained raters blinded for clinical data, with excellent interrater agreement in a random sample of 10% of the scans (weighted kappa values were 0.87 and 0.95, respectively, for the number of lacunes, and 0.85 and 0.86, respectively, for the number of cerebral microbleeds) (18).
To facilitate consistent identification of incident lacunes, difference images were constructed for T1 and FLAIR images to identify incident lacunes. The images were first fully stripped using the Brain Extraction Tool (BET) in FSL. All follow-up images were then registered to the baseline scans. Difference images were generated by subtracting the registered and intensity-normalized baseline T1 and FLAIR images from the corresponding T1 and FLAIR images at the follow-ups. Incident lacunes were defined as hypointense voxel clusters on a uniform background (19).

Diffusion Tensor Imaging Preprocessing

All diffusion-weighted images were denoised using a local principal component analysis filter and corrected for cardiac, head motion, and eddy current artifacts simultaneously using the “PATCH” algorithm, as described previously (20). Diffusion-weighted-imaging-positive (DWI+) lesions were rated on mean diffusivity and trace images. The peak width of skeletonized mean diffusivity (PSMD) was calculated with the PSMD tool provided at http://www.psmd-marker.com (21).

Dementia Diagnostic Workup

Dementia case finding was performed for all patients, with a different approach for those who participated in the in-person study visit than for those who died or declined in-person follow-up participation.
Patients who participated in the in-person follow-ups (in 2011, 2015, and 2020) were first screened with the Mini Mental State Examination (MMSE) (22) and the Instrumental Activities of Daily Living (IADL) scale (23) during all follow-up waves. Participants screened positive if they fulfilled two criteria: 1) an MMSE score below 26 or a decline of ≥3 points compared to the previous assessment, and 2) having an impairment on least one item of the IADL scale (i.e., a score <8). Patients who screened positive were subsequently evaluated in an independent multidisciplinary consensus panel meeting consisting of a neurologist, a clinical neuropsychologist, and a geriatrician. Adjudication of dementia diagnosis was done by evaluating all available clinical data, neuropsychological examinations, depressive symptom scores (assessed with the Center for Epidemiologic Studies Depression Scale [CES-D]) (24), and MRI data from all time points available. In addition, for every patient who screened positive, the general practitioner or nursing home treating physician as well as family members or other informal caregivers were contacted to provide a comprehensive history and evaluation of the interference of cognitive deficits in the patient’s daily functioning. In cases where there was a need for an additional in-person evaluation, patients were subsequently referred to the Radboudumc Alzheimer Center memory clinic.
For patients who did not participate at the follow-up time points (i.e., those who were deceased or who declined participation), medical records on their cognitive status were retrieved from the general practitioner or nursing home treating physicians. Cases of patients diagnosed with dementia or a cognitive disorder by their own treating physician were reviewed again independently by the members of the consensus panel, additionally taking into consideration the already collected research data on cognitive function and mood, activities of daily living, decline over time during previous visits, and all available neuroimaging.
The diagnosis of dementia was based on the DSM-5 clinical criteria for major neurocognitive disorder due to a neurodegenerative disease. The disease criteria for Alzheimer’s dementia were based on the National Institute on Aging and Alzheimer’s Association (NIA-AA) Research Framework (25); our patients in this dementia category were described as having Alzheimer’s clinical syndrome. Vascular dementia was specified using the National Institute of Neurological Disorders and Stroke and Association Internationale pour la Recherche et l’Enseignement en Neurosciences (NINDS-AIREN) disease criteria (26). Individuals with a dementia diagnosis who did not meet these criteria were classified as having etiologically mixed dementia (mixed Alzheimer’s dementia/vascular dementia) (27), frontotemporal dementia, or Parkinson’s dementia.
The date of dementia onset was defined as the date of diagnosis. When the date of diagnosis was not exactly known (for example, when diagnosed at the consensus meeting), we used the midpoint between the date the diagnosis was confirmed and the previous visit. Participants who did not develop dementia were censored at the time of last contact, date of most recently retrieved medical information regarding cognitive status from general practitioners, or death.

Statistical Analysis

Differences in baseline characteristics between subgroups were compared using Mann-Whitney U tests, one-way analysis of variance, or chi-square tests as appropriate. WMH volumes were log-transformed to achieve a normal distribution.
Person-years at risk was calculated from date of baseline assessment until onset of dementia, death, or date of last follow-up. Cumulative incidence of all-cause dementia was calculated by using Kaplan-Meier analyses for the different MRI markers of SVD, stratified by severity. Differences were tested using log-rank tests.
Cox proportional regression analyses were used to study the association between MRI markers of SVD and dementia incidence. Two models were constructed: in the first model, adjustments were made for age, sex, CES-D score, education level, and the vascular risk factor score (based on the number of vascular risk factors [0–4] at baseline). In the second model, additional adjustment was made for hippocampal volume as an imaging marker for concurrent neurodegenerative processes. Conversely, to study hippocampal volume in relation to dementia incidence, adjustment was made for PSMD (as this is considered to be the most sensitive marker capturing SVD) (21). To eliminate the effect of unintentionally included subclinical dementia cases at baseline, sensitivity analyses were performed by excluding participants who developed incident dementia in the first 5 years, until the first follow-up (2011). We performed similar Cox regression analyses between baseline MRI markers of SVD and dementia after 2011. Death was considered a competing risk, by using the proportional hazards model of Fine and Gray (28). Schoenfeld residuals were investigated to verify the proportionality of hazards. There were no indications that the proportional hazards assumption was violated. Similar sensitivity analyses were also performed specifically for Alzheimer’s dementia and vascular dementia.
The relation between SVD and dementia was further investigated by analyzing progression of MRI markers as determinants of incident dementia. Only patients who underwent at least two MRI scans between the follow-up assessments of 2006, 2011, and 2015 were included in these analyses. We included only dementia cases that occurred after a second MRI, to ensure use of serial MRI data prior to dementia conversion. We constructed linear mixed-effects models to estimate annualized rate changes of MRI markers, namely, WMH volumes, hippocampal volume, total brain volume, gray matter volume, and white matter volume. The intercept and slope of each participant’s linear trajectory were allowed to vary with both fixed and random effects. Fixed-effect variation was accounted for by time, and random-effect variation allowed for interindividual differences. Slopes for each patient were extracted and used for further analyses.
Three models were employed by using the Fine and Gray hazards model and taking death as a competing risk: in model 1, the progression of MRI markers was adjusted for age, sex, education level, and risk factor score; in model 2, each marker was additionally adjusted for its baseline measure; and in model 3 we additionally adjusted for baseline hippocampal volume; hippocampal volume was adjusted for baseline PSMD.
All statistical analyses were performed in R, version 4.1.1.

Results

At baseline, 503 participants were included, with a mean age of 65.7 years (SD=8.8). Dementia as an endpoint was available for 498 patients (99.0%); five patients were lost to follow-up and were censored (three due to emigration; two nonresponders after contact) (Figure 1). Of these 498 participants, 108 (21.5%) developed dementia after a median follow-up duration of 13.2 years (interquartile range, 8.8–13.8), resulting in an incidence rate of 19.4 per 1,000 person-years. Dementia subtype could be established in 107 of the 108 cases (99.0%). Alzheimer’s dementia was the most common cause of dementia (38 cases; 35.2%), followed by vascular dementia (34 cases; 31.5%) and dementia of mixed etiology (Alzheimer’s dementia/vascular dementia; 26 cases; 24.1%) (see Table S1 in the online supplement).
FIGURE 1. Flowchart of the design of the RUN DMC cohort study from 2006 to 2020a
aRUN DMC=Radboud University Nijmegen Diffusion Tensor and Magnetic Resonance Cohort.

SVD Severity and Dementia Incidence

On average, individuals who developed dementia were older, had a lower education level, showed worse cognitive performance, and had a higher burden of MRI markers of SVD at baseline (Table 1). Within the dementia subtypes, patients who developed vascular dementia showed worse cognitive performance at baseline and had higher baseline SVD burden on MRI compared with patients diagnosed with Alzheimer’s dementia or mixed Alzheimer’s dementia/vascular dementia (see Table S2 in the online supplement).
TABLE 1. Baseline characteristics of participants with and without incident dementiaa
CharacteristicParticipants Without Incident Dementia (N=390)Participants With Incident Dementia (N=108) 
 MeanSDMeanSDp
Demographic characteristics     
 Age (years)63.88.472.46.6<0.001
 N%N%p
 Male21855.96358.30.65
 Higher than primary education level35992.19083.30.007
 MedianIQRMedianIQRp
Cognition     
 MMSE score2928 to 302826 to 29<0.001
 Cognitive index0.17−0.36 to 0.620.57−0.95 to −0.15<0.001
 MeanSDMeanSDp
 CES-D score12.469.3312.469.150.74
 N%N%p
Vascular risk factors     
 Hypertension27971.58780.60.06
 Diabetes5313.62018.50.20
 Hypercholesterolemia18146.45550.90.41
 Ever smoking27771.07468.50.61
 MedianIQRMedianIQRp
MRI characteristics     
 Fazekas score11 to 221 to 2<0.001
 White matter hyperintensities (mL)2.850.99 to 9.378.493.57 to 17.87<0.001
 N%N%p
 Presence of lacunes9424.14238.90.002
 Presence of microbleedsb5915.22220.40.21
 Presence of DWI+ lesionsc143.698.30.04
 MedianIQRMedianIQRp
 PSMD of white matterc (10–3 mm2/s)0.310.28 to 0.360.370.33 to 0.43<0.001
 MeanSDMeanSDp
 Hippocampal volume (mL)7.810.986.840.79<0.001
 Total brain volume (mL)1003.2370.351076.7175.34<0.001
 Gray matter volume (mL)615.1150.59574.6846.79<0.001
 White matter volume (mL)462.0143.10428.5547.36<0.001
a
CES-D=Center for Epidemiologic Studies Depression Scale; DWI+=diffusion-weighted imaging positive; IQR=interquartile range; MMSE=Mini Mental State Examination; PSMD=peak width of skeletonized mean diffusivity.
b
Four patients were excluded because of insufficient scan quality.
c
Three patients were excluded because of insufficient scan quality.
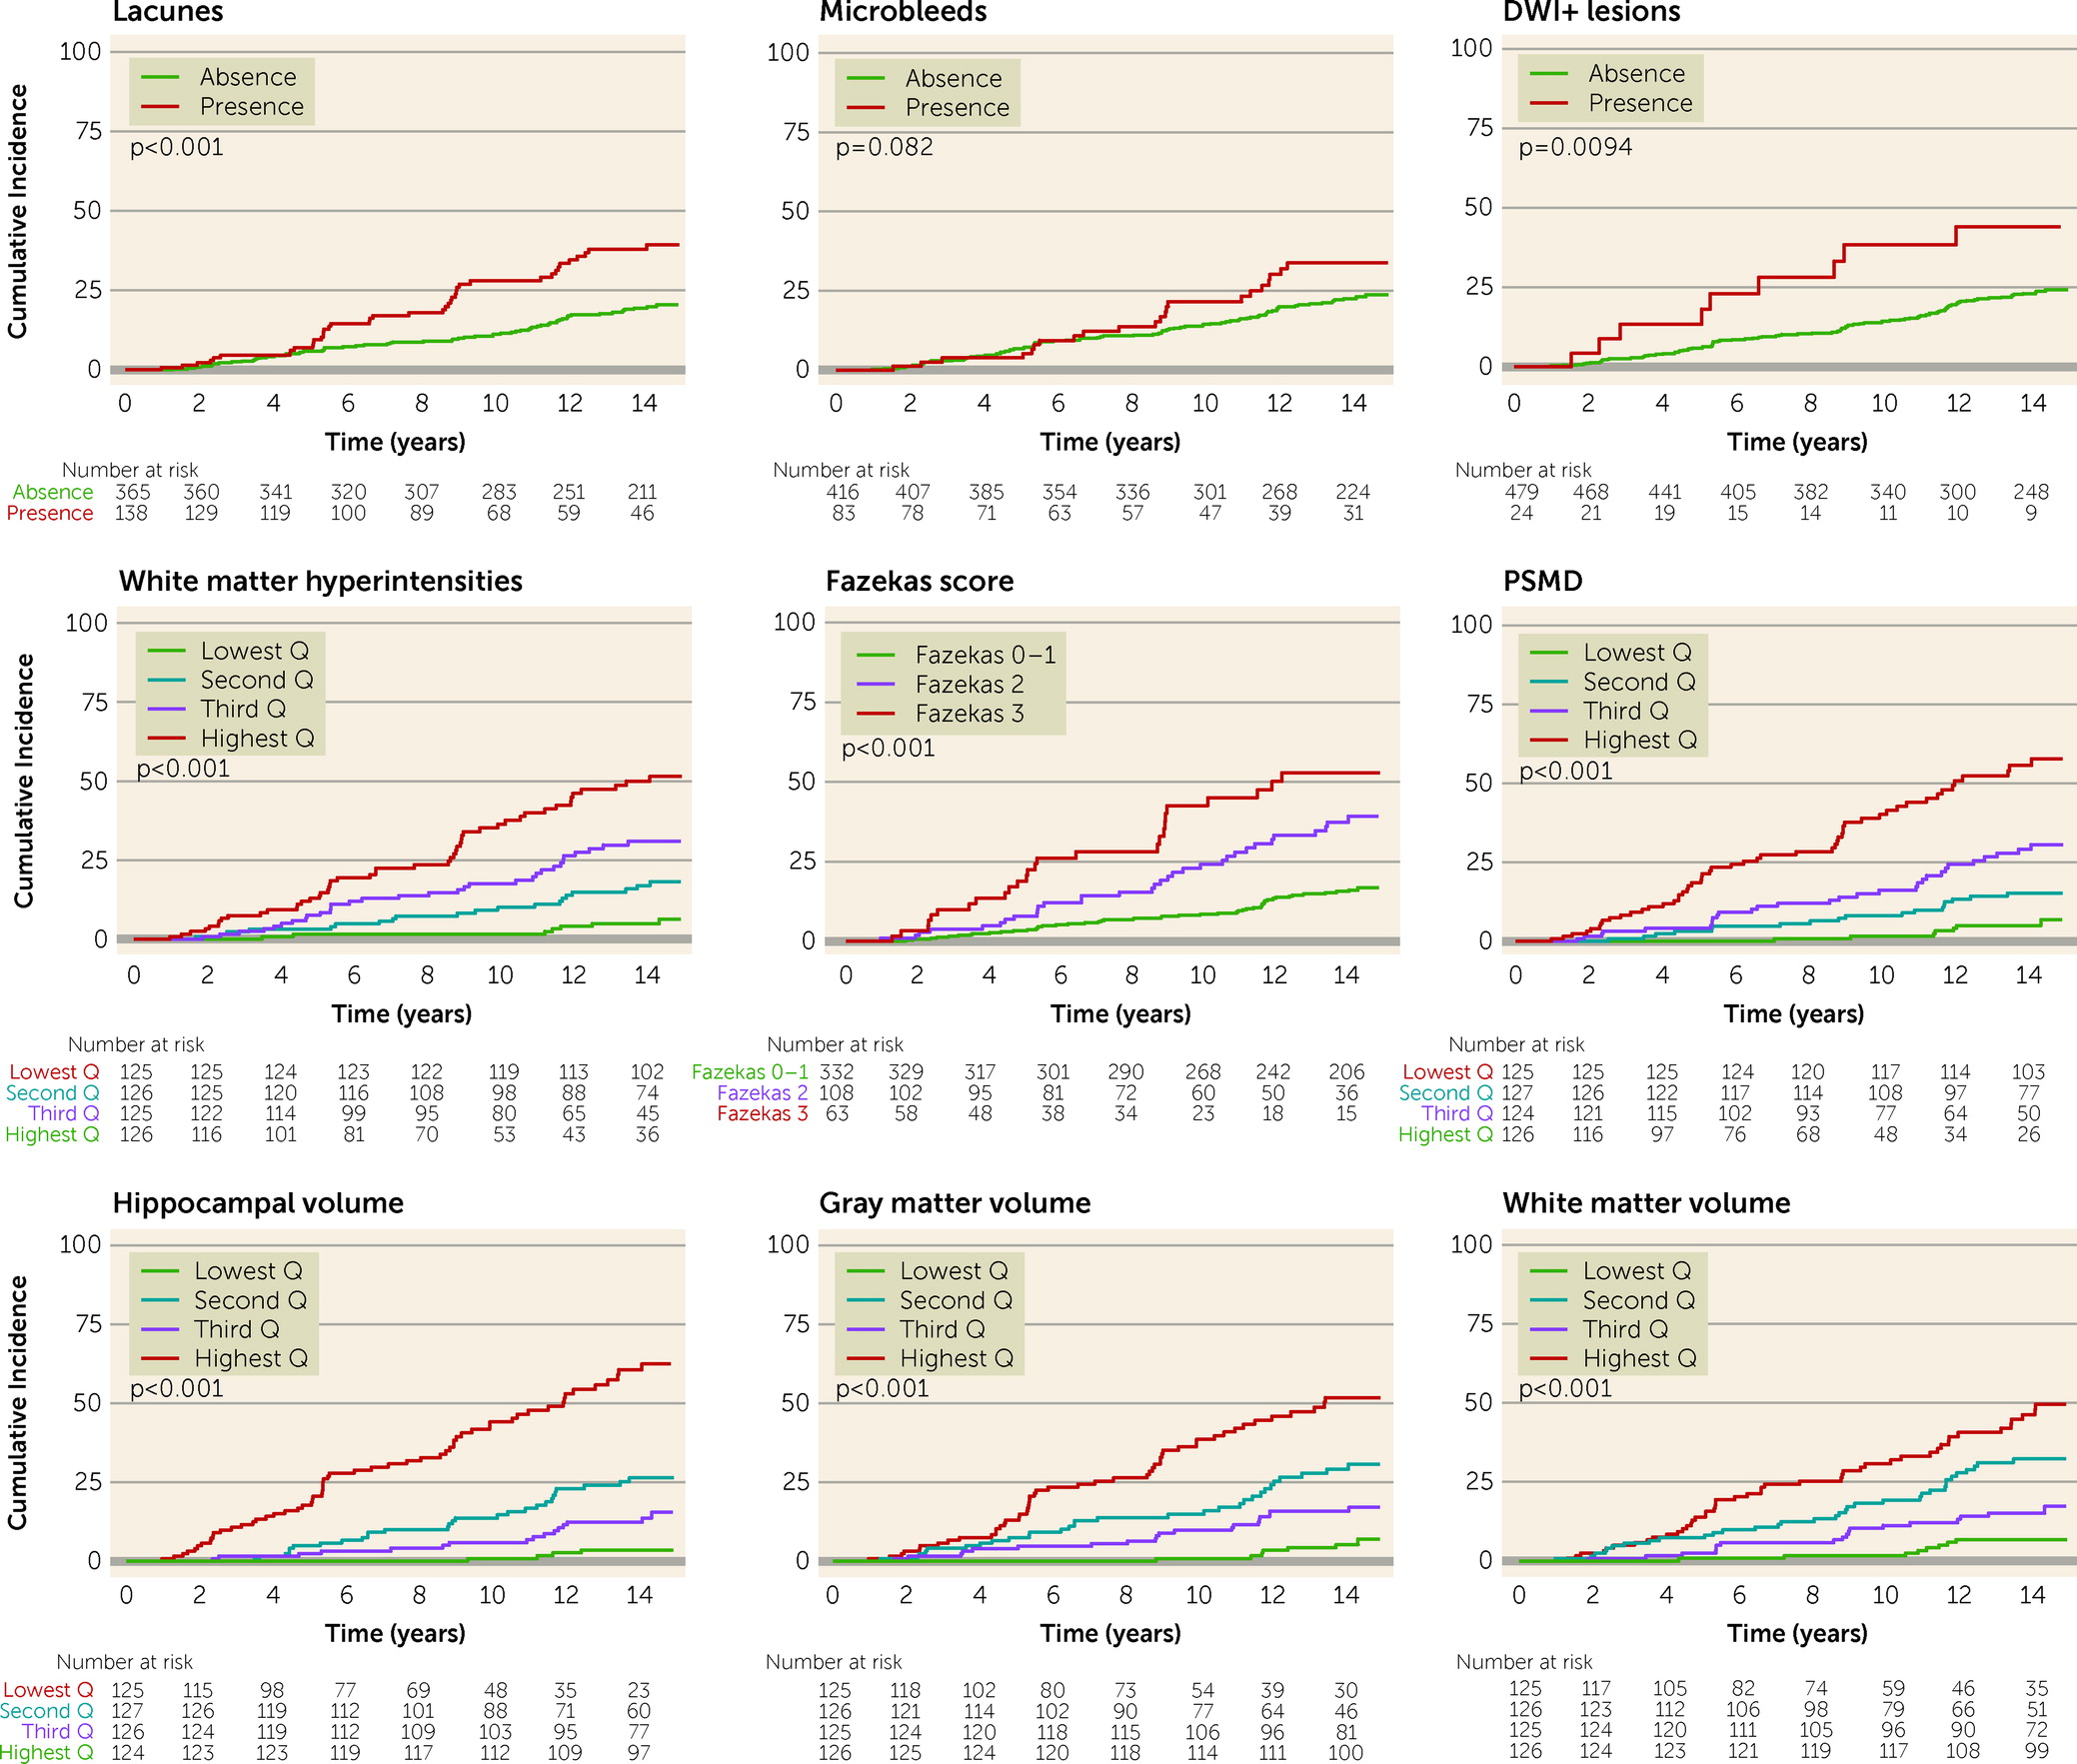
The cumulative 14-year risk of dementia was highest in patients with the highest WMH volume quartile (50.4% cumulative risk over 14 years) and PSMD (62.8% cumulative risk over 14 years), and 61.4% for patients with the lowest hippocampal volume quartile (Figure 2). In contrast to all other MRI markers of SVD, presence of cerebral microbleeds was not significantly associated with 14-year risk of dementia (log-rank p=0.082).
FIGURE 2. Cumulative risk of all-cause dementia, by MRI characteristicsa
aDWI+=diffusion-weighted imaging positive; Q=quartile; PSMD=peak width of skeletonized mean diffusivity.
After adjustment for age, sex, CES-D score, education level, and vascular risk factor score, all MRI markers of SVD (except for lacunes and cerebral microbleeds) were significantly associated with all-cause dementia (Table 2, model 1). When additionally adjusting for hippocampal volume at baseline (Table 2, model 2), more WMHs (hazard ratio=1.31 per 1-SD increase, 95% CI=1.02–1.67; p=0.04), presence of DWI+ lesions (hazard ratio=2.03, 95% CI=1.01–4.04; p=0.04), higher PSMD (hazard ratio=1.24 per 1-SD increase, 95% CI=1.02–1.51; p=0.03), and lower white matter volume (hazard ratio=1.22 per 1-SD decrease, 95% CI=1.01–1.49; p=0.04) were independently associated with higher risk of incident all-cause dementia. After adjustment for PSMD, lower hippocampal volume was also associated with all-cause dementia (hazard ratio=1.70 per 1-SD decrease, 95% CI=1.31–2.25; p<0.001).
TABLE 2. Association between MRI characteristics and incident all-cause dementiaa
 All-Cause Dementia: Model 1 (N=108)All-Cause Dementia: Model 2 (N=108)
MRI CharacteristicHazard Ratio95% CIpHazard Ratio95% CIp
White matter hyperintensities (mL) per 1-SD increase (log-transformed)1.391.07–1.760.021.311.02–1.670.04
Presence of lacunes1.230.83–1.870.291.190.78–1.800.41
Presence of microbleedsb0.840.52–1.410.570.810.50–1.350.49
Presence of DWI+ lesionsc2.071.03–4.170.042.031.03–4.170.04
PSMD white matterc (10–3 mm2/s) per 1-SD increase1.361.13–1.670.0021.241.02–1.510.03
Hippocampal volume (mL) per 1-SD decrease1.871.46–2.42<0.0011.701.31–2.25<0.001
Total brain volume (mL) per 1-SD decrease1.721.15–2.440.0021.411.00–1.960.06
Gray matter volume (mL) per 1-SD decrease1.341.03–1.740.031.110.89–1.510.41
White matter volume (mL) per 1-SD decrease1.261.03–1.530.021.221.01–1.490.04
a
The table summarizes Cox proportional hazards analyses for studying associations between small vessel disease markers and all-cause dementia. Model 1 was adjusted for age, sex, score on the Center for Epidemiologic Studies Depression Scale, education level, and vascular risk factor score. Model 2 was additionally adjusted for hippocampal volume; hippocampal volume was adjusted for PSMD. DWI+=diffusion-weighted imaging positive; PSMD=peak width of skeletonized mean diffusivity.
b
Three patients were excluded because of insufficient scan quality.
c
Four patients were excluded because of insufficient scan quality.
When dementia subtypes specifically were examined, and after adjusting for confounders, all MRI markers of SVD were associated with vascular dementia, while lower hippocampal volume, fewer WMHs, and a lower PSMD were associated with Alzheimer’s dementia (see Table S3 in the online supplement).
The results did not change significantly after dementia cases that developed before the first follow-up were excluded (see Table S4 in the online supplement).

SVD Progression and Dementia Incidence

A total of 364 patients underwent at least two MRI scans between 2006 and 2015, of whom 59 developed dementia (Alzheimer’s dementia, N=18; vascular dementia, N=16; mixed Alzheimer’s dementia/vascular dementia, N=18; Lewy body dementia, N=3; frontotemporal dementia, N=1; Parkinson’s dementia, N=2; and Parkinson’s dementia/vascular dementia, N=1). WMH progression predicted incident all-cause dementia, even after adjustment for baseline WMH volume and hippocampal volume (as an imaging marker for neurodegenerative processes) (hazard ratio=1.76 per 1-SD increase, 95% CI=1.18–2.63; p=0.005). Incident lacunes were also associated with all-cause dementia after adjusting for baseline presence of lacunes, although the association was not significant after adjustment for baseline hippocampal volume (Table 3).
TABLE 3. Association between small vessel disease progression and all-cause dementiaa
 All-Cause Dementia: Model 1 (N=59)All-Cause Dementia: Model 2 (N=59)All-Cause Dementia: Model 3 (N=59)
MRI Progression MarkersHazard Ratio95% CIpHazard Ratio95% CIpHazard Ratio95% CIp
Annualized white matter hyperintensities (mL/year) per 1-SD increase (log-transformed)1.631.32–1.96<0.0011.611.08–2.390.021.761.18–2.630.005
Lacunes incidence2.921.38–6.150.0062.251.02–5.060.052.220.98–4.990.05
Microbleeds incidence1.460.81–2.560.231.330.96–2.450.191.540.87–2.670.14
Annualized hippocampal volume (mL/year) per 1-SD decrease1.961.51–2.50<0.0013.312.37–4.76<0.0013.412.35–4.77<0.001
Annualized total brain volume (mL/year) per 1-SD decrease1.921.41–2.43<0.0011.761.27–2.22<0.0011.681.22–1.870.003
Annualized gray matter volume (mL/year) per 1-SD decrease1.621.22–1.85<0.0011.611.27–1.98<0.0011.571.27–1.920.001
Annualized white matter volume (mL/year) per 1-SD decrease1.711.29–2.07<0.0011.501.17–1.930.0021.441.11–1.970.01
a
The table summarizes Cox proportional hazards analyses for studying associations between progression of MRI/small vessel disease markers and all-cause dementia. Model 1 was adjusted for age, sex, score on the Center for Epidemiologic Studies Depression Scale, education level, and vascular risk factor score. In model 2, each progression variable was additionally adjusted for its baseline measure. Model 3 was additionally adjusted for baseline hippocampal volume; hippocampal atrophy rate was adjusted for baseline peak width of skeletonized mean diffusivity.
Decrease in hippocampal volume, total brain volume, gray matter volume, and white matter volume were significantly associated with all-cause dementia, with hippocampal volume decrease showing the strongest association, even after adjusting for baseline PSMD to adjust for SVD burden (hazard ratio=3.41 per 1-SD decrease, 95% CI=2.35–4.77; p<0.001).

Discussion

We found that SVD severity at baseline and SVD progression over a 9-year course were independently associated with an increased risk of incident all-cause dementia over a follow-up of 14 years. These observations provide strong starting evidence for a causal role of SVD in the development of dementia.
Our results regarding long-term dementia incidence extend the existing knowledge of short-term dementia incidence in SVD. Higher dementia incidences were reported for previous SVD cohorts with shorter follow-ups—18.2% in the St George’s Cognition and Neuroimaging in Stroke (SCANS) study (29) and 14.0% in the Leukoaraiosis and Disability (LADIS) study (30) after a median follow-up of approximately 3 years—compared with the incidence of 21.5% we observed over 14 years of follow-up. However, the patients included in these studies were much older and had higher cardiovascular and SVD burden at baseline compared with our cohort, which is a more representative sample of community-dwelling individuals.
Our finding that SVD severity at baseline is associated with an increase in risk of dementia is in line with previous studies (4, 3133). Yet, the majority of these studies had relatively short follow-ups, of only several years, and did not adjust for hippocampal volume (4, 7, 31). It may therefore be that ongoing neurodegeneration explained the development of dementia soon after baseline and that the patients included in those shorter studies already had (subclinical) signs of cognitive impairment at baseline. This issue is countered by following patients over a longer follow-up.
Higher WMH volume, presence of DWI+ lesions, and higher PSMD were independent SVD predictors for all-cause dementia. PSMD has previously been shown to outperform conventional MRI markers of SVD (e.g., WMHs) when studying SVD severity in relation to cognitive impairment (21) and is considered the most reliable MRI marker capturing SVD. Our findings here clearly show that it can also predict long-term all-cause dementia. Detection of DWI+ lesions also independently predicted all-cause dementia after a follow-up of 14 years. This extends the findings of a previous study conducted in memory clinic patients showing that DWI+ lesions were associated with an increased risk of vascular dementia (but not all-cause dementia and not with adjustment for hippocampal volume) after a median follow-up of 2 years (5). Therefore, despite its low occurrence, presence of DWI+ lesions may serve as a marker of “active” SVD reflecting further ongoing vascular brain damage, and may thus guide targeted prevention strategies by identifying high-risk patients.
We noted that presence of most MRI markers of SVD was associated with a higher risk of incident vascular dementia, yet a lower risk of Alzheimer’s dementia. This seems counterintuitive, since SVD is increasingly recognized in the etiology of Alzheimer’s dementia (34). However, this can be explained by confirmation bias during our diagnostic workup, as the presence of severe SVD favors a vascular dementia diagnosis on the basis of accepted diagnostic criteria (26), resulting in a few Alzheimer’s dementia cases with severe SVD burden.
Given our longitudinal design and long follow-up with multiple cognitive and MRI evaluations, we were able to study the 9-year SVD progression on incident all-cause dementia. WMH progression and incident lacunes (however, not after adjustment for hippocampal volume) were significantly associated with incident all-cause dementia, as well as hippocampal, gray matter, and white matter atrophy. Of note, the effect of progression of these MRI markers on dementia in our study is most likely an underestimation, since attrition bias may have occurred: older participants with higher SVD burden at baseline may not have been able to participate in the follow-up assessments, either because they were deceased or because they had greater frailty. We previously demonstrated (35) that mainly these patients with high SVD burden also show the highest SVD progression rate over time, and therefore the loss of these patients to follow-up may have attenuated the true effect of SVD progression on dementia.
Our results extend previous smaller longitudinal studies investigating SVD progression over a much shorter follow-up and with varying populations in terms of age, cognitive status, and cardiovascular disease burden. In one previous study, WMH progression and deterioration of microstructural integrity within 3 years were found to be related to dementia incidence (7). However, that study had smaller numbers of patients with incident dementia (N=18) and included only patients with lacunar stroke who were much older and had higher SVD burden. In another pair of studies, 4-year WMH progression was associated with cognitive decline in both cognitively unimpaired older individuals and patients with Alzheimer’s dementia (36, 37). However, these studies did not adjust for any neurodegenerative markers.
Equivocal results have contributed to a long debate on whether and how SVD relates to dementia. It is proposed that SVD causes cognitive decline by directly disconnecting white matter pathways underlying complex cortical-subcortical networks involved in efficient processing of cognitive and memory functions (16), or via synergistic interaction with Alzheimer’s pathology, that is, hippocampal atrophy and β-amyloid load (16, 38). Another study showed a causal relation between incident subcortical infarcts and atrophy of connected cortical regions (39). However, other alternative mechanisms, including overlapping genetic risk profiles, inflammation, and a disrupted cholinergic system, have also been suggested to interact in this relation (40, 41). Since depression is associated with presence of SVD and incident dementia, we adjusted for depressive symptoms in our multivariable analyses. Still, the MRI markers were associated with incident dementia independent of depressive symptoms.
SVD has cross-sectionally been related to hippocampal atrophy, but other concurrent neurodegenerative processes likely affect hippocampal volume as well. Yet, by adjusting for hippocampal volume, we may have partially adjusted for the effect of SVD, even though hippocampal volume is not an established MRI marker of SVD. Of note, we showed that even when we adjusted for hippocampal atrophy, SVD severity at baseline and its progression over time were still significantly associated with dementia incidence.
Some limitations of our study need to be considered. Even though the dementia diagnosis adjudication was done in a structured and standardized way, in which a consensus panel consisting of experts from different fields reviewed all available clinical, cognitive, and MRI data (including SVD severity and hippocampal atrophy), the diagnosis of Alzheimer’s dementia did not involve identification of β-amyloid or tau levels, or genetic profiles, which could improve the accuracy of Alzheimer’s dementia diagnosis. However, this only limits the stratified analyses and does not apply to all-cause dementia incidence, since this is often a clinical diagnosis. Another limitation is that the status of the large arteries was not evaluated during the study, and therefore we cannot preclude the possibility that the MRI markers of SVD could to some extent be caused by hypoperfusion or cerebral emboli resulting from carotid stenoses or intracranial stenoses, which may also mediate the relation between WMHs and cognitive decline (42, 43). Nevertheless, this does not influence the clinical implication and interpretation of finding an association between presence of the studied MRI markers (regardless of their etiology) and incident dementia. Besides, the risk of misclassifying large artery disease as SVD seems small, given the low prevalence (<2%) of carotid or intracranial stenosis (according to the TOAST criteria) in asymptomatic White individuals (42, 44).
Furthermore, there was a scanner change between 2006 and 2011, which may have led to measurement variability due to differences in slice thickness and FLAIR contrast. Consequently, we were not able to study longitudinal changes in diffusion MRI measures. However, these differences are almost inevitable with improvements in hardware and sequence design, especially in very long follow-up studies. Nevertheless, we minimized WMH measurement differences by reslicing the follow-up FLAIR scans to match baseline scans.
There are several strengths of this study. We present a long follow-up period (14 years) in SVD patients, with data acquired from a comprehensive and standardized clinical and neuroimaging workup, and with very few participants lost to follow-up (1.0%). Such a long follow-up offers insights into the long-term dementia outcome of SVD during a clinically relevant time period. For example, this long-term follow-up revealed that the largest differences in the cumulative risk of dementia by SVD severity only become apparent after 10 years, and not within several years after baseline, an interval chosen in most follow-up studies investigating SVD outcomes. Another strength of this study is the ability to investigate the (annual) 9-year progression of SVD markers in relation to incident dementia. Furthermore, in contrast to many other studies, we adjusted for hippocampal volume, an important neurodegenerative confounder in incident dementia, thereby increasing the clinical significance of the SVD markers.
In summary, both baseline SVD severity and SVD progression are independently associated with the long-term risk of all-cause dementia. Our results suggest that SVD progression precedes dementia and may causally contribute to its development, and consequently position SVD as a modifiable target for dementia prevention. Intensive blood pressure management has been shown in one trial to reduce SVD progression (45), although another large trial recorded no effect of intensive cardiovascular management on all-cause dementia incidence (46), indicating that therapeutic options for SVD should extend beyond adequate management of cardiovascular risk factors. Agents improving endothelial dysfunction, blood-brain barrier integrity, and anti-inflammatory effects, but also preventive strategies for managing vascular risk factors earlier in life, have been proposed as potentially promising therapeutic targets for SVD and thus dementia (47). A delay in disease onset by merely a few years could reduce the devastating burden of dementia substantially.
Supplementary Material

File (appi.ajp.20220380.ds001.pdf)

REFERENCES

1.
Debette S, Schilling S, Duperron MG, et al: Clinical significance of magnetic resonance imaging markers of vascular brain injury: a systematic review and meta-analysis. JAMA Neurol 2019; 76:81–94
2.
Wardlaw JM, Smith C, Dichgans M: Small vessel disease: mechanisms and clinical implications. Lancet Neurol 2019; 18:684–696
3.
Wardlaw JM, Smith EE, Biessels GJ, et al: Neuroimaging standards for research into small vessel disease and its contribution to ageing and neurodegeneration. Lancet Neurol 2013; 12:822–838
4.
Vermeer SE, Prins ND, den Heijer T, et al: Silent brain infarcts and the risk of dementia and cognitive decline. N Engl J Med 2003; 348:1215–1222
5.
Ferro DA, van den Brink H, Exalto LG, et al: Clinical relevance of acute cerebral microinfarcts in vascular cognitive impairment. Neurology 2019; 92:e1558–e1566
6.
Bos D, Wolters FJ, Darweesh SKL, et al: Cerebral small vessel disease and the risk of dementia: a systematic review and meta-analysis of population-based evidence. Alzheimers Dement 2018; 14:1482–1492
7.
Zeestraten EA, Lawrence AJ, Lambert C, et al: Change in multimodal MRI markers predicts dementia risk in cerebral small vessel disease. Neurology 2017; 89:1869–1876
8.
Lawrence AJ, Brookes RL, Zeestraten EA, et al: Pattern and rate of cognitive decline in cerebral small vessel disease: a prospective study. PLoS One 2015; 10:e0135523
9.
van Leijsen EMC, van Uden IWM, Ghafoorian M, et al: Nonlinear temporal dynamics of cerebral small vessel disease: the RUN DMC study. Neurology 2017; 89:1569–1577
10.
Hill AB: The environment and disease: association or causation? Proc R Soc Med 1965; 58:295–300
11.
van Norden AG, de Laat KF, Gons RA, et al: Causes and consequences of cerebral small vessel disease: the RUN DMC study: a prospective cohort study; study rationale and protocol. BMC Neurol 2011; 11:29
12.
Erkinjuntti T: Subcortical vascular dementia. Cerebrovasc Dis 2002; 13:58–60
13.
van Uden IWM, van der Holst HM, Schaapsmeerders P, et al: Baseline white matter microstructural integrity is not related to cognitive decline after 5 years: the RUN DMC study. BBA Clin 2015; 4:108–114
14.
Tuladhar AM, van Uden IWM, Rutten-Jacobs LCA, et al: Structural network efficiency predicts conversion to dementia. Neurology 2016; 86:1112–1119
15.
Reuter M, Schmansky NJ, Rosas HD, et al: Within-subject template estimation for unbiased longitudinal image analysis. Neuroimage 2012; 61:1402–1418
16.
van Leijsen EMC, Tay J, van Uden IWM, et al: Memory decline in elderly with cerebral small vessel disease explained by temporal interactions between white matter hyperintensities and hippocampal atrophy. Hippocampus 2019; 29:500–510
17.
Ghafoorian M, Karssemeijer N, van Uden IWM, et al: Automated detection of white matter hyperintensities of all sizes in cerebral small vessel disease. Med Phys 2016; 43:6246
18.
van Uden IWM, Tuladhar AM, van der Holst HM, et al: Diffusion tensor imaging of the hippocampus predicts the risk of dementia: the RUN DMC study. Hum Brain Mapp 2016; 37:327–337
19.
Duering M, Csanadi E, Gesierich B, et al: Incident lacunes preferentially localize to the edge of white matter hyperintensities: insights into the pathophysiology of cerebral small vessel disease. Brain 2013; 136:2717–2726
20.
Zwiers MP: Patching cardiac and head motion artefacts in diffusion-weighted images. Neuroimage 2010; 53:565–575
21.
Baykara E, Gesierich B, Adam R, et al: A novel imaging marker for small vessel disease based on skeletonization of white matter tracts and diffusion histograms. Ann Neurol 2016; 80:581–592
22.
Folstein MF, Folstein SE, McHugh PR: “Mini-Mental State”: a practical method for grading the cognitive state of patients for the clinician. J Psychiatr Res 1975; 12:189–198
23.
Barberger-Gateau P, Commenges D, Gagnon M, et al: Instrumental activities of daily living as a screening tool for cognitive impairment and dementia in elderly community dwellers. J Am Geriatr Soc 1992; 40:1129–1134
24.
Radloff LS: The use of the Center for Epidemiologic Studies Depression Scale in adolescents and young adults. J Youth Adolesc 1991; 20:149–166
25.
Jack CR, Jr., Bennett DA, Blennow K, et al: NIA-AA Research Framework: toward a biological definition of Alzheimer’s disease. Alzheimers Dement 2018; 14:535–562
26.
Román GC, Tatemichi TK, Erkinjuntti T, et al: Vascular dementia: diagnostic criteria for research studies: report of the NINDS-AIREN International Workshop. Neurology 1993; 43:250–260
27.
McKhann GM, Knopman DS, Chertkow H, et al: The diagnosis of dementia due to Alzheimer’s disease: recommendations from the National Institute on Aging–Alzheimer’s Association workgroups on diagnostic guidelines for Alzheimer’s disease. Alzheimers Dement 2011; 7:263–269
28.
Fine JP, Gray RJ: A proportional hazards model for the subdistribution of a competing risk. J Am Stat Assoc 1999; 94:496–509
29.
Williams OA, Zeestraten EA, Benjamin P, et al: Predicting dementia in cerebral small vessel disease using an automatic diffusion tensor image segmentation technique. Stroke 2019; 50:2775–2782
30.
Madureira S, Verdelho A, Moleiro C, et al: Neuropsychological predictors of dementia in a three-year follow-up period: data from the LADIS study. Dement Geriatr Cogn Disord 2010; 29:325–334
31.
Brickman AM, Zahodne LB, Guzman VA, et al: Reconsidering harbingers of dementia: progression of parietal lobe white matter hyperintensities predicts Alzheimer’s disease incidence. Neurobiol Aging 2015; 36:27–32
32.
Debette S, Beiser A, DeCarli C, et al: Association of MRI markers of vascular brain injury with incident stroke, mild cognitive impairment, dementia, and mortality: the Framingham Offspring Study. Stroke 2010; 41:600–606
33.
Kaffashian S, Soumaré A, Zhu YC, et al: Long-term clinical impact of vascular brain lesions on magnetic resonance imaging in older adults in the population. Stroke 2016; 47:2865–2869
34.
Cortes-Canteli M, Iadecola C: Alzheimer’s disease and vascular aging. J Am Coll Cardiol 2020; 75:942–951
35.
Cai M, Jacob MA, van Loenen MR, et al: Determinants and temporal dynamics of cerebral small vessel disease: 14-year follow-up. Stroke 2022; 53:2789–2798
36.
Maillard P, Carmichael O, Fletcher E, et al: Coevolution of white matter hyperintensities and cognition in the elderly. Neurology 2012; 79:442–448
37.
Silbert LC, Dodge HH, Perkins LG, et al: Trajectory of white matter hyperintensity burden preceding mild cognitive impairment. Neurology 2012; 79:741–747
38.
Graff-Radford J, Arenaza-Urquijo EM, Knopman DS, et al: White matter hyperintensities: relationship to amyloid and tau burden. Brain 2019; 142:2483–2491
39.
Duering M, Righart R, Csanadi E, et al: Incident subcortical infarcts induce focal thinning in connected cortical regions. Neurology 2012; 79:2025–2028
40.
Caruso P, Signori R, Moretti R: Small vessel disease to subcortical dementia: a dynamic model, which interfaces aging, cholinergic dysregulation, and the neurovascular unit. Vasc Health Risk Manag 2019; 15:259–281
41.
Low A, Su L, Stefaniak JD, et al: Inherited risk of dementia and the progression of cerebral small vessel disease and inflammatory markers in cognitively healthy midlife adults: the PREVENT Dementia study. Neurobiol Aging 2020; 98:124–133
42.
Romero JR, Beiser A, Seshadri S, et al: Carotid artery atherosclerosis, MRI indices of brain ischemia, aging, and cognitive impairment: the Framingham study. Stroke 2009; 40:1590–1596
43.
Brisset M, Boutouyrie P, Pico F, et al: Large-vessel correlates of cerebral small-vessel disease. Neurology 2013; 80:662–669
44.
Wardlaw JM, Doubal FN, Eadie E, et al: Little association between intracranial arterial stenosis and lacunar stroke. Cerebrovasc Dis 2011; 31:12–18
45.
Nasrallah IM, Nasrallah IM, Pajewski NM, et al: Association of intensive vs standard blood pressure control with cerebral white matter lesions. JAMA 2019; 322:524–534
46.
Moll van Charante EP, Richard E, Eurelings LS, et al: Effectiveness of a 6-year multidomain vascular care intervention to prevent dementia (preDIVA): a cluster-randomised controlled trial. Lancet 2016; 388:797–805
47.
Bath PM, Wardlaw JM: Pharmacological treatment and prevention of cerebral small vessel disease: a review of potential interventions. Int J Stroke 2015; 10:469–478

Information & Authors

Information

Published In

Go to American Journal of Psychiatry
American Journal of Psychiatry
Pages: 508 - 518
PubMed: 37073486

History

Received: 25 April 2022
Revision received: 4 August 2022
Revision received: 29 September 2022
Accepted: 31 October 2022
Published online: 19 April 2023
Published in print: July 01, 2023

Keywords

  1. Small Vessel Disease
  2. Dementia
  3. MRI
  4. Cognitive Decline
  5. Alzheimer’s Disease
  6. Neuroimaging

Authors

Details

Mina A. Jacob, M.D.
Department of Neurology, Radboud University Medical Center, Nijmegen, the Netherlands, and Donders Center for Medical Neuroscience, Radboud University, Nijmegen (Jacob, Cai, van de Donk, Bergkamp, Tuladhar, de Leeuw); Department of Neurology, Guangdong Neuroscience Institute, Guangdong Provincial People’s Hospital, and Guangdong Academy of Medical Sciences, Guangzhou, China (Cai); Center for Cognitive Neuroimaging, Donders Institute for Brain, Cognition, and Behavior, Radboud University, Nijmegen (Marques, Norris); Center for Cognition, Donders Institute for Brain, Cognition, and Behavior, Radboud University, Nijmegen (Kessels); Vincent van Gogh Institute for Psychiatry, Venray, the Netherlands (Kessels); Department of Medical Psychology, Radboudumc Alzheimer Center, Radboud University Medical Center, Nijmegen (Kessels); Department of Geriatrics, Radboudumc Alzheimer Center, Radboud University Medical Center, and Donders Institute for Brain, Cognition, and Behavior, Radboud University, Nijmegen (Claassen); Department of Biomedical Engineering, Medical Image Analysis Center and Quantitative Biomedical Imaging Group (qbig), University of Basel, Basel, Switzerland (Duering).
Mengfei Cai, M.D., Ph.D.
Department of Neurology, Radboud University Medical Center, Nijmegen, the Netherlands, and Donders Center for Medical Neuroscience, Radboud University, Nijmegen (Jacob, Cai, van de Donk, Bergkamp, Tuladhar, de Leeuw); Department of Neurology, Guangdong Neuroscience Institute, Guangdong Provincial People’s Hospital, and Guangdong Academy of Medical Sciences, Guangzhou, China (Cai); Center for Cognitive Neuroimaging, Donders Institute for Brain, Cognition, and Behavior, Radboud University, Nijmegen (Marques, Norris); Center for Cognition, Donders Institute for Brain, Cognition, and Behavior, Radboud University, Nijmegen (Kessels); Vincent van Gogh Institute for Psychiatry, Venray, the Netherlands (Kessels); Department of Medical Psychology, Radboudumc Alzheimer Center, Radboud University Medical Center, Nijmegen (Kessels); Department of Geriatrics, Radboudumc Alzheimer Center, Radboud University Medical Center, and Donders Institute for Brain, Cognition, and Behavior, Radboud University, Nijmegen (Claassen); Department of Biomedical Engineering, Medical Image Analysis Center and Quantitative Biomedical Imaging Group (qbig), University of Basel, Basel, Switzerland (Duering).
Vera van de Donk, M.Sc.
Department of Neurology, Radboud University Medical Center, Nijmegen, the Netherlands, and Donders Center for Medical Neuroscience, Radboud University, Nijmegen (Jacob, Cai, van de Donk, Bergkamp, Tuladhar, de Leeuw); Department of Neurology, Guangdong Neuroscience Institute, Guangdong Provincial People’s Hospital, and Guangdong Academy of Medical Sciences, Guangzhou, China (Cai); Center for Cognitive Neuroimaging, Donders Institute for Brain, Cognition, and Behavior, Radboud University, Nijmegen (Marques, Norris); Center for Cognition, Donders Institute for Brain, Cognition, and Behavior, Radboud University, Nijmegen (Kessels); Vincent van Gogh Institute for Psychiatry, Venray, the Netherlands (Kessels); Department of Medical Psychology, Radboudumc Alzheimer Center, Radboud University Medical Center, Nijmegen (Kessels); Department of Geriatrics, Radboudumc Alzheimer Center, Radboud University Medical Center, and Donders Institute for Brain, Cognition, and Behavior, Radboud University, Nijmegen (Claassen); Department of Biomedical Engineering, Medical Image Analysis Center and Quantitative Biomedical Imaging Group (qbig), University of Basel, Basel, Switzerland (Duering).
Mayra Bergkamp, M.D.
Department of Neurology, Radboud University Medical Center, Nijmegen, the Netherlands, and Donders Center for Medical Neuroscience, Radboud University, Nijmegen (Jacob, Cai, van de Donk, Bergkamp, Tuladhar, de Leeuw); Department of Neurology, Guangdong Neuroscience Institute, Guangdong Provincial People’s Hospital, and Guangdong Academy of Medical Sciences, Guangzhou, China (Cai); Center for Cognitive Neuroimaging, Donders Institute for Brain, Cognition, and Behavior, Radboud University, Nijmegen (Marques, Norris); Center for Cognition, Donders Institute for Brain, Cognition, and Behavior, Radboud University, Nijmegen (Kessels); Vincent van Gogh Institute for Psychiatry, Venray, the Netherlands (Kessels); Department of Medical Psychology, Radboudumc Alzheimer Center, Radboud University Medical Center, Nijmegen (Kessels); Department of Geriatrics, Radboudumc Alzheimer Center, Radboud University Medical Center, and Donders Institute for Brain, Cognition, and Behavior, Radboud University, Nijmegen (Claassen); Department of Biomedical Engineering, Medical Image Analysis Center and Quantitative Biomedical Imaging Group (qbig), University of Basel, Basel, Switzerland (Duering).
José Marques, Ph.D.
Department of Neurology, Radboud University Medical Center, Nijmegen, the Netherlands, and Donders Center for Medical Neuroscience, Radboud University, Nijmegen (Jacob, Cai, van de Donk, Bergkamp, Tuladhar, de Leeuw); Department of Neurology, Guangdong Neuroscience Institute, Guangdong Provincial People’s Hospital, and Guangdong Academy of Medical Sciences, Guangzhou, China (Cai); Center for Cognitive Neuroimaging, Donders Institute for Brain, Cognition, and Behavior, Radboud University, Nijmegen (Marques, Norris); Center for Cognition, Donders Institute for Brain, Cognition, and Behavior, Radboud University, Nijmegen (Kessels); Vincent van Gogh Institute for Psychiatry, Venray, the Netherlands (Kessels); Department of Medical Psychology, Radboudumc Alzheimer Center, Radboud University Medical Center, Nijmegen (Kessels); Department of Geriatrics, Radboudumc Alzheimer Center, Radboud University Medical Center, and Donders Institute for Brain, Cognition, and Behavior, Radboud University, Nijmegen (Claassen); Department of Biomedical Engineering, Medical Image Analysis Center and Quantitative Biomedical Imaging Group (qbig), University of Basel, Basel, Switzerland (Duering).
David G. Norris, Ph.D.
Department of Neurology, Radboud University Medical Center, Nijmegen, the Netherlands, and Donders Center for Medical Neuroscience, Radboud University, Nijmegen (Jacob, Cai, van de Donk, Bergkamp, Tuladhar, de Leeuw); Department of Neurology, Guangdong Neuroscience Institute, Guangdong Provincial People’s Hospital, and Guangdong Academy of Medical Sciences, Guangzhou, China (Cai); Center for Cognitive Neuroimaging, Donders Institute for Brain, Cognition, and Behavior, Radboud University, Nijmegen (Marques, Norris); Center for Cognition, Donders Institute for Brain, Cognition, and Behavior, Radboud University, Nijmegen (Kessels); Vincent van Gogh Institute for Psychiatry, Venray, the Netherlands (Kessels); Department of Medical Psychology, Radboudumc Alzheimer Center, Radboud University Medical Center, Nijmegen (Kessels); Department of Geriatrics, Radboudumc Alzheimer Center, Radboud University Medical Center, and Donders Institute for Brain, Cognition, and Behavior, Radboud University, Nijmegen (Claassen); Department of Biomedical Engineering, Medical Image Analysis Center and Quantitative Biomedical Imaging Group (qbig), University of Basel, Basel, Switzerland (Duering).
Roy P.C. Kessels, Ph.D.
Department of Neurology, Radboud University Medical Center, Nijmegen, the Netherlands, and Donders Center for Medical Neuroscience, Radboud University, Nijmegen (Jacob, Cai, van de Donk, Bergkamp, Tuladhar, de Leeuw); Department of Neurology, Guangdong Neuroscience Institute, Guangdong Provincial People’s Hospital, and Guangdong Academy of Medical Sciences, Guangzhou, China (Cai); Center for Cognitive Neuroimaging, Donders Institute for Brain, Cognition, and Behavior, Radboud University, Nijmegen (Marques, Norris); Center for Cognition, Donders Institute for Brain, Cognition, and Behavior, Radboud University, Nijmegen (Kessels); Vincent van Gogh Institute for Psychiatry, Venray, the Netherlands (Kessels); Department of Medical Psychology, Radboudumc Alzheimer Center, Radboud University Medical Center, Nijmegen (Kessels); Department of Geriatrics, Radboudumc Alzheimer Center, Radboud University Medical Center, and Donders Institute for Brain, Cognition, and Behavior, Radboud University, Nijmegen (Claassen); Department of Biomedical Engineering, Medical Image Analysis Center and Quantitative Biomedical Imaging Group (qbig), University of Basel, Basel, Switzerland (Duering).
Jurgen A.H.R. Claassen, M.D., Ph.D.
Department of Neurology, Radboud University Medical Center, Nijmegen, the Netherlands, and Donders Center for Medical Neuroscience, Radboud University, Nijmegen (Jacob, Cai, van de Donk, Bergkamp, Tuladhar, de Leeuw); Department of Neurology, Guangdong Neuroscience Institute, Guangdong Provincial People’s Hospital, and Guangdong Academy of Medical Sciences, Guangzhou, China (Cai); Center for Cognitive Neuroimaging, Donders Institute for Brain, Cognition, and Behavior, Radboud University, Nijmegen (Marques, Norris); Center for Cognition, Donders Institute for Brain, Cognition, and Behavior, Radboud University, Nijmegen (Kessels); Vincent van Gogh Institute for Psychiatry, Venray, the Netherlands (Kessels); Department of Medical Psychology, Radboudumc Alzheimer Center, Radboud University Medical Center, Nijmegen (Kessels); Department of Geriatrics, Radboudumc Alzheimer Center, Radboud University Medical Center, and Donders Institute for Brain, Cognition, and Behavior, Radboud University, Nijmegen (Claassen); Department of Biomedical Engineering, Medical Image Analysis Center and Quantitative Biomedical Imaging Group (qbig), University of Basel, Basel, Switzerland (Duering).
Marco Duering, M.D.
Department of Neurology, Radboud University Medical Center, Nijmegen, the Netherlands, and Donders Center for Medical Neuroscience, Radboud University, Nijmegen (Jacob, Cai, van de Donk, Bergkamp, Tuladhar, de Leeuw); Department of Neurology, Guangdong Neuroscience Institute, Guangdong Provincial People’s Hospital, and Guangdong Academy of Medical Sciences, Guangzhou, China (Cai); Center for Cognitive Neuroimaging, Donders Institute for Brain, Cognition, and Behavior, Radboud University, Nijmegen (Marques, Norris); Center for Cognition, Donders Institute for Brain, Cognition, and Behavior, Radboud University, Nijmegen (Kessels); Vincent van Gogh Institute for Psychiatry, Venray, the Netherlands (Kessels); Department of Medical Psychology, Radboudumc Alzheimer Center, Radboud University Medical Center, Nijmegen (Kessels); Department of Geriatrics, Radboudumc Alzheimer Center, Radboud University Medical Center, and Donders Institute for Brain, Cognition, and Behavior, Radboud University, Nijmegen (Claassen); Department of Biomedical Engineering, Medical Image Analysis Center and Quantitative Biomedical Imaging Group (qbig), University of Basel, Basel, Switzerland (Duering).
Anil M. Tuladhar, M.D., Ph.D.
Department of Neurology, Radboud University Medical Center, Nijmegen, the Netherlands, and Donders Center for Medical Neuroscience, Radboud University, Nijmegen (Jacob, Cai, van de Donk, Bergkamp, Tuladhar, de Leeuw); Department of Neurology, Guangdong Neuroscience Institute, Guangdong Provincial People’s Hospital, and Guangdong Academy of Medical Sciences, Guangzhou, China (Cai); Center for Cognitive Neuroimaging, Donders Institute for Brain, Cognition, and Behavior, Radboud University, Nijmegen (Marques, Norris); Center for Cognition, Donders Institute for Brain, Cognition, and Behavior, Radboud University, Nijmegen (Kessels); Vincent van Gogh Institute for Psychiatry, Venray, the Netherlands (Kessels); Department of Medical Psychology, Radboudumc Alzheimer Center, Radboud University Medical Center, Nijmegen (Kessels); Department of Geriatrics, Radboudumc Alzheimer Center, Radboud University Medical Center, and Donders Institute for Brain, Cognition, and Behavior, Radboud University, Nijmegen (Claassen); Department of Biomedical Engineering, Medical Image Analysis Center and Quantitative Biomedical Imaging Group (qbig), University of Basel, Basel, Switzerland (Duering).
Frank-Erik de Leeuw, M.D., Ph.D. [email protected]
Department of Neurology, Radboud University Medical Center, Nijmegen, the Netherlands, and Donders Center for Medical Neuroscience, Radboud University, Nijmegen (Jacob, Cai, van de Donk, Bergkamp, Tuladhar, de Leeuw); Department of Neurology, Guangdong Neuroscience Institute, Guangdong Provincial People’s Hospital, and Guangdong Academy of Medical Sciences, Guangzhou, China (Cai); Center for Cognitive Neuroimaging, Donders Institute for Brain, Cognition, and Behavior, Radboud University, Nijmegen (Marques, Norris); Center for Cognition, Donders Institute for Brain, Cognition, and Behavior, Radboud University, Nijmegen (Kessels); Vincent van Gogh Institute for Psychiatry, Venray, the Netherlands (Kessels); Department of Medical Psychology, Radboudumc Alzheimer Center, Radboud University Medical Center, Nijmegen (Kessels); Department of Geriatrics, Radboudumc Alzheimer Center, Radboud University Medical Center, and Donders Institute for Brain, Cognition, and Behavior, Radboud University, Nijmegen (Claassen); Department of Biomedical Engineering, Medical Image Analysis Center and Quantitative Biomedical Imaging Group (qbig), University of Basel, Basel, Switzerland (Duering).

Notes

Send correspondence to Prof. de Leeuw ([email protected]).

Author Contributions

Drs. Jacob and Cai contributed equally to this study.

Competing Interests

Dr. Claassen is local principal investigator at Radboudumc for the EVOKE study sponsored by Novo Nordisk. Dr. Duering has served as a consultant for Roche, as a speaker for Bayer and Sanofi, and as an adjudication board member for Hovid Berhad. The other authors report no financial relationships with commercial interests.

Funding Information

Supported by a Dutch Brain Foundation personal fellowship (H04-12; F2009[1]-16, to Prof. de Leeuw) and by a VIDI innovational grant (016.126.351) from the Netherlands Organization for Scientific Research (Prof. de Leeuw). Dr. Tuladhar is a junior staff member of the Dutch Heart Foundation (grant 2016T044). Dr. Cai is supported by the China Scholarship Council (201706100189).

Metrics & Citations

Metrics

Citations

Export Citations

If you have the appropriate software installed, you can download article citation data to the citation manager of your choice. Simply select your manager software from the list below and click Download.

For more information or tips please see 'Downloading to a citation manager' in the Help menu.

Format
Citation style
Style
Copy to clipboard

View Options

View options

PDF/EPUB

View PDF/EPUB

Login options

Already a subscriber? Access your subscription through your login credentials or your institution for full access to this article.

Personal login Institutional Login Open Athens login
Purchase Options

Purchase this article to access the full text.

PPV Articles - American Journal of Psychiatry

PPV Articles - American Journal of Psychiatry

Not a subscriber?

Subscribe Now / Learn More

PsychiatryOnline subscription options offer access to the DSM-5-TR® library, books, journals, CME, and patient resources. This all-in-one virtual library provides psychiatrists and mental health professionals with key resources for diagnosis, treatment, research, and professional development.

Need more help? PsychiatryOnline Customer Service may be reached by emailing [email protected] or by calling 800-368-5777 (in the U.S.) or 703-907-7322 (outside the U.S.).

Media

Figures

Other

Tables

Share

Share

Share article link

Share