The Efficacy of Cognitive-Behavioral Therapy and Psychodynamic Therapy in the Outpatient Treatment of Major Depression: A Randomized Clinical Trial
Abstract
Objective
Method
Results
Conclusions
Method
Design
Participants
Interventions
Outcome Measures
Randomization
Statistical Methods
| Characteristic | Total Sample (N=341) | CBT Group (N=164) | Psychodynamic Therapy Group (N=177) | |||
|---|---|---|---|---|---|---|
| Demographic | ||||||
| Mean | SD | Mean | SD | Mean | SD | |
| Age (years) | 38.91 | 10.30 | 38.27 | 10.13 | 39.49 | 10.44 |
| N | % | N | % | N | % | |
| Gender | ||||||
| Male | 102 | 29.9 | 51 | 31.1 | 51 | 28.8 |
| Female | 239 | 70.1 | 113 | 68.9 | 126 | 71.2 |
| Cultural background | ||||||
| Northwest European | 186 | 55.0 | 92 | 56.1 | 94 | 54.0 |
| Other | 152 | 44.9 | 72 | 43.9 | 80 | 46.0 |
| Marital status | ||||||
| Married | 80 | 23.7 | 45 | 27.4 | 35 | 20.1 |
| Divorced | 69 | 20.4 | 34 | 20.7 | 35 | 20.1 |
| Widowed | 10 | 3.0 | 4 | 2.4 | 6 | 3.4 |
| Never married | 176 | 52.1 | 80 | 48.8 | 96 | 55.2 |
| Other | 3 | 0.9 | 1 | 0.6 | 2 | 1.1 |
| Living situation | ||||||
| Living with at least one other person | 220 | 65.3 | 110 | 67.1 | 110 | 63.6 |
| Living alone | 106 | 31.5 | 51 | 31.1 | 55 | 31.8 |
| Other | 11 | 3.3 | 3 | 1.8 | 8 | 4.6 |
| Job status | ||||||
| Currently working | 130 | 38.8 | 61 | 37.4 | 69 | 40.1 |
| Receiving sickness benefits | 55 | 16.4 | 35 | 21.5 | 20 | 11.6 |
| Receiving social security benefits | 74 | 22.1 | 34 | 20.9 | 40 | 23.3 |
| Receiving disability benefits | 32 | 9.6 | 13 | 8.0 | 19 | 11.0 |
| Student | 14 | 4.2 | 5 | 3.1 | 9 | 5.2 |
| Other | 30 | 9.0 | 15 | 9.2 | 15 | 8.7 |
| Education level | ||||||
| Low | 67 | 20.0 | 35 | 21.5 | 32 | 18.6 |
| Intermediate | 159 | 47.5 | 71 | 43.6 | 88 | 51.2 |
| High | 101 | 30.1 | 55 | 33.7 | 46 | 26.7 |
| Other | 8 | 2.4 | 2 | 1.2 | 6 | 3.5 |
| Main income before taxes | ||||||
| ≤€1,273 a month | 113 | 42.8 | 49 | 37.4 | 64 | 48.1 |
| ≥€1,274 a month | 151 | 57.2 | 82 | 62.6 | 69 | 51.9 |
| Symptom severity | ||||||
| HAM-D score >24 | 129 | 37.8 | 66 | 40.2 | 63 | 35.6 |
| Mean | SD | Mean | SD | Mean | SD | |
| HAM-D score | 23.40 | 5.35 | 23.68 | 5.47 | 23.14 | 5.24 |
| Patient-rated depression score | 42.73 | 11.00 | 42.88 | 10.08 | 42.60 | 11.82 |
| N | % | N | % | N | % | |
| Comorbid axis I disorderb | ||||||
| No | 204 | 59.8 | 98 | 59.8 | 106 | 59.9 |
| Yes | 137 | 40.2 | 66 | 40.2 | 71 | 40.1 |
| Depression | ||||||
| Duration present episode | ||||||
| <6 months | 84 | 25.1 | 48 | 29.8 | 36 | 20.8 |
| 6 months–1 year | 88 | 26.3 | 43 | 26.7 | 45 | 26.0 |
| 1–2 years | 43 | 12.9 | 22 | 13.7 | 21 | 12.1 |
| >2 years | 86 | 25.7 | 35 | 21.7 | 51 | 29.5 |
| Unknown | 33 | 9.9 | 13 | 8.1 | 20 | 11.6 |
| Previous treatment for current depressive episode | ||||||
| No | 218 | 65.3 | 100 | 62.1 | 118 | 68.2 |
| Yes | 116 | 34.7 | 61 | 37.9 | 55 | 31.8 |
| Number of previous depressive episodes | ||||||
| None | 103 | 31.1 | 55 | 34.6 | 48 | 27.9 |
| One | 69 | 20.8 | 29 | 18.2 | 40 | 23.3 |
| Two or more | 159 | 48.0 | 75 | 47.2 | 84 | 48.8 |
| Comorbid dysthymia | ||||||
| No | 194 | 66.0 | 94 | 68.1 | 100 | 64.1 |
| Yes | 100 | 34.0 | 44 | 31.9 | 56 | 35.9 |
Power Analysis
Results
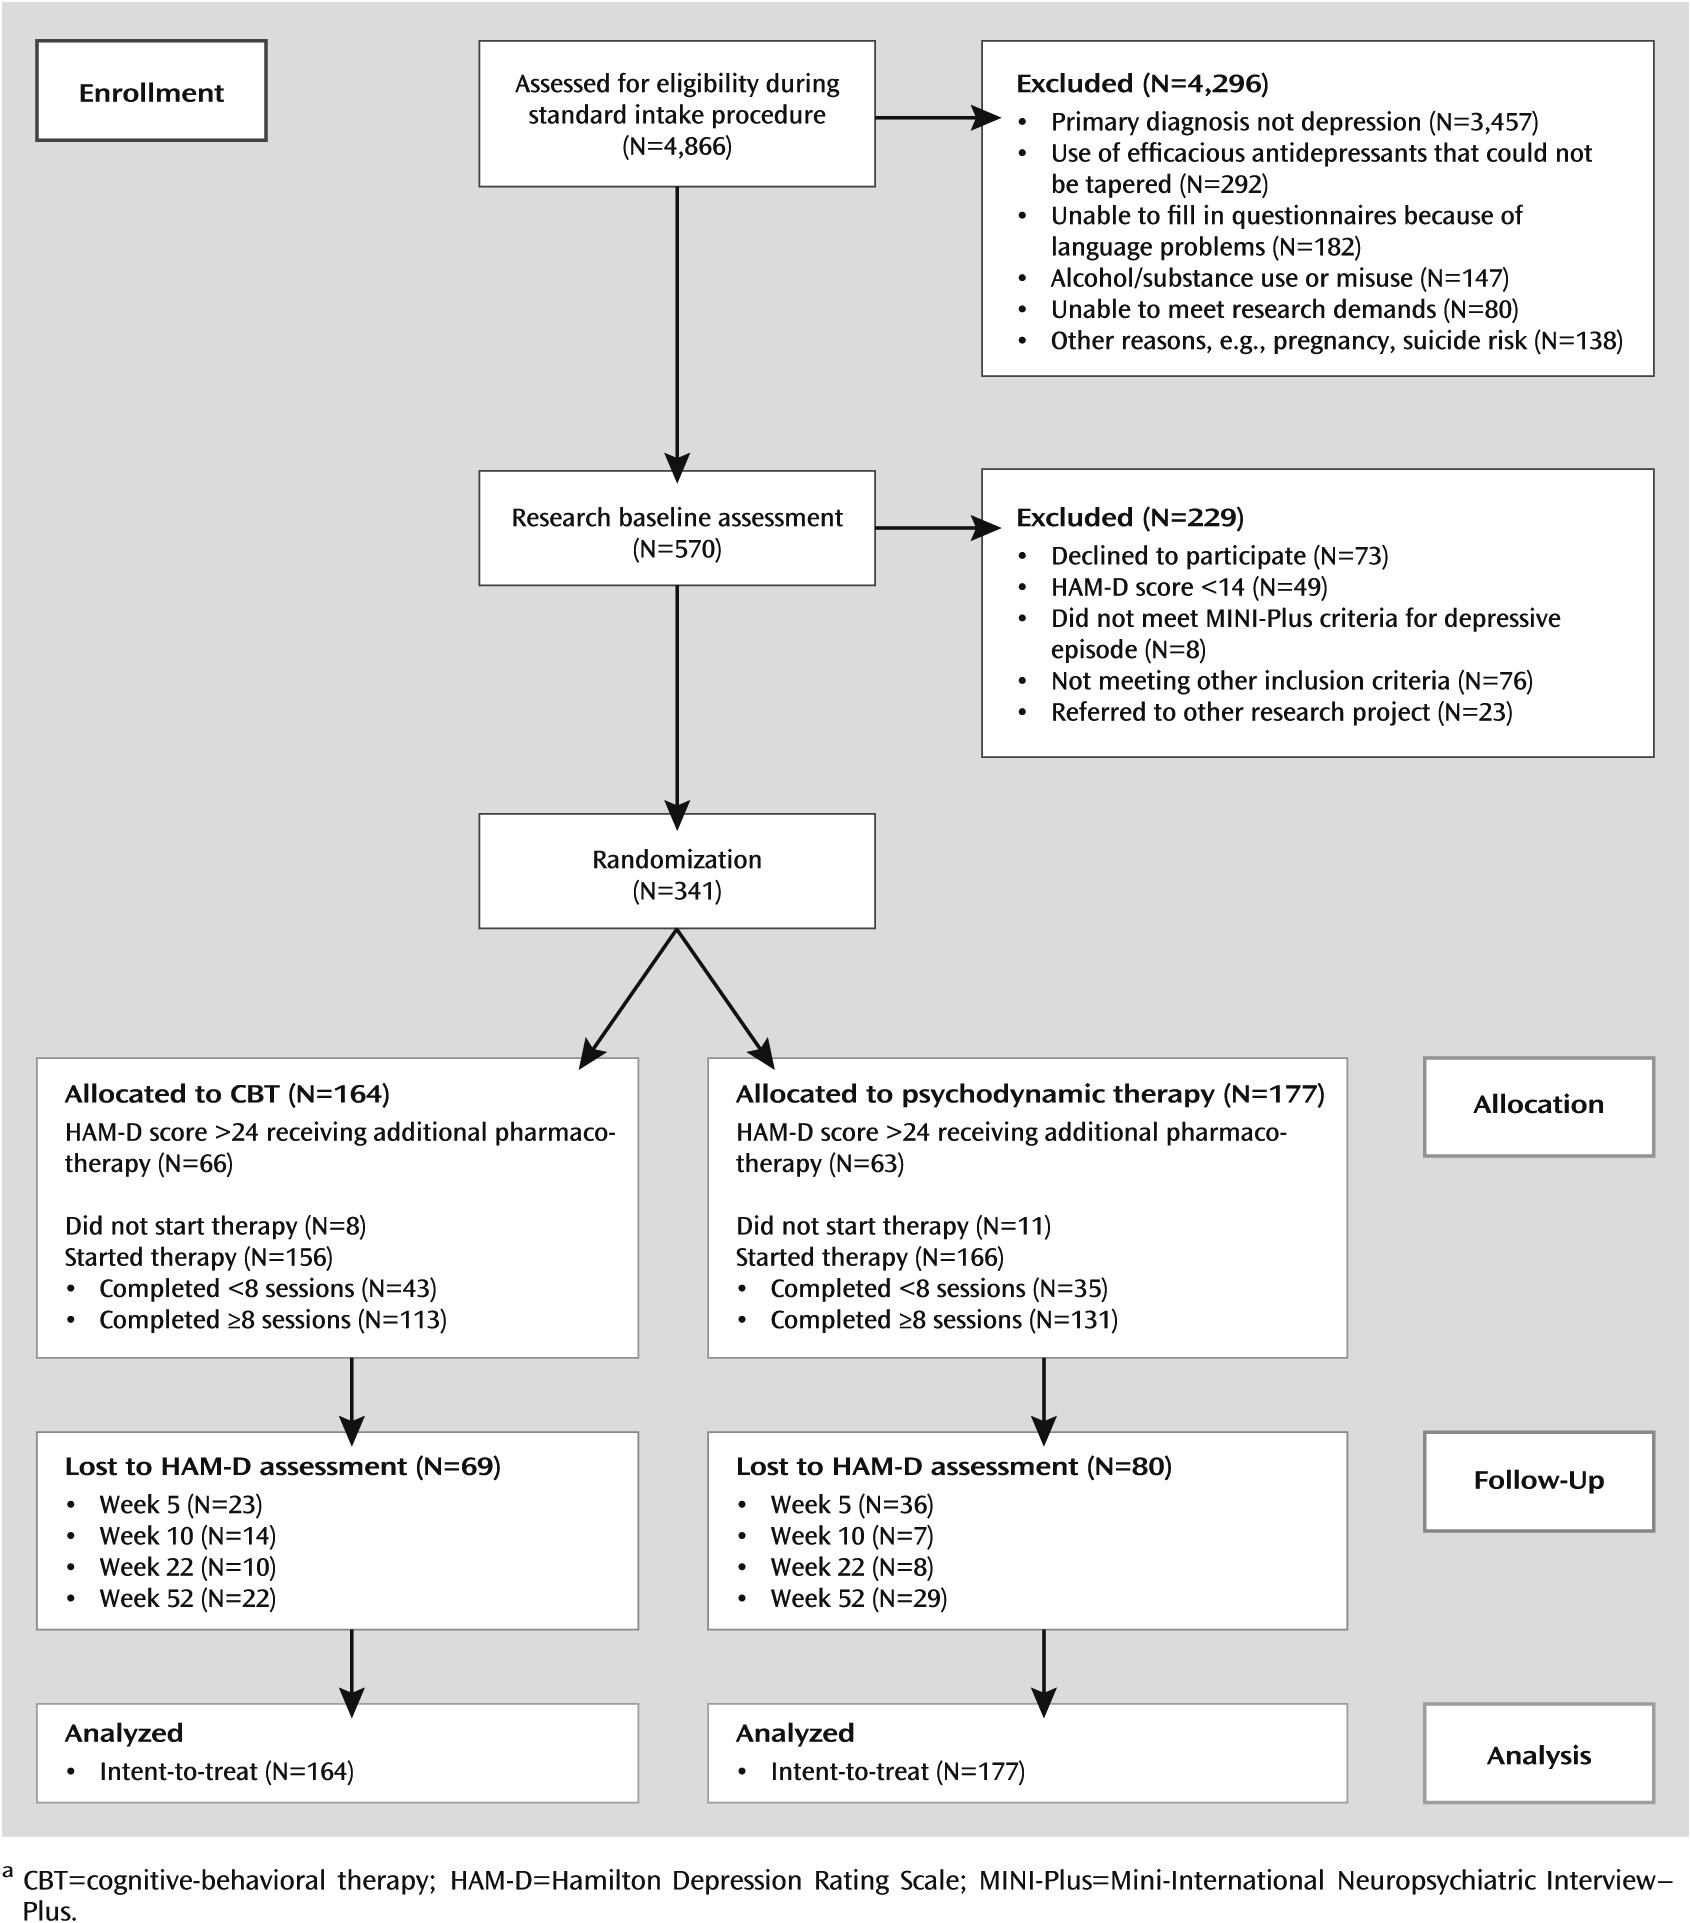
Participants

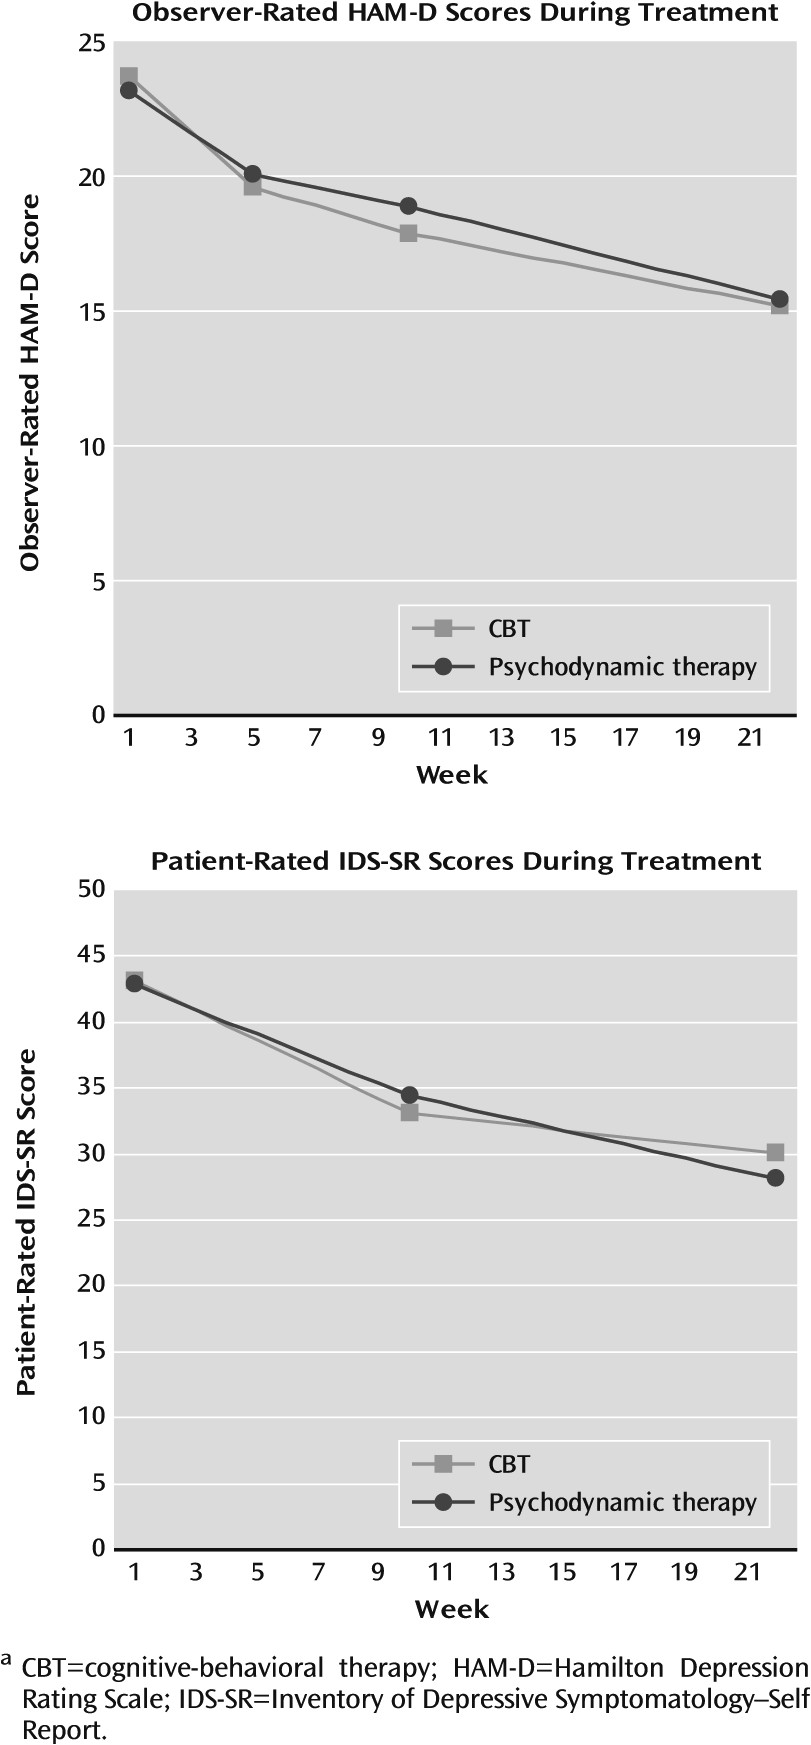
Posttreatment Outcomes
| Time and Model | HAM-D Score | IDS-SR Score | ||||||||
|---|---|---|---|---|---|---|---|---|---|---|
| Remission | Estimated Mean Difference | Effect Size | Estimated Mean Difference | Effect Size | ||||||
| Odds Ratio | 95% CI | Difference | SE | Cohen’s d | 95% CI | Difference | SE | Cohen’s d | 95% CI | |
| Week 0 | ||||||||||
| Model 1 | –0.55 | 0.78 | –0.31 | 1.62 | ||||||
| Model 2 | –0.21 | 0.69 | 0.35 | 1.51 | ||||||
| Model 3 | –0.65 | 0.77 | –0.40 | 1.55 | ||||||
| Model 4 | –0.42 | 0.80 | 0.05 | 1.63 | ||||||
| Model 5 | –0.88 | 0.95 | –1.33 | 1.98 | ||||||
| Model 6 | –0.56 | 0.79 | –0.29 | 1.64 | ||||||
| Week 5 | ||||||||||
| Model 1 | 0.61 | 0.19–1.98 | 0.46 | 0.88 | ||||||
| Model 2 | 0.58 | 0.18–1.87 | 0.79 | 0.79 | ||||||
| Model 3 | 0.52 | 0.17–1.65 | 0.30 | 0.87 | ||||||
| Model 4 | 0.44 | 0.13–1.55 | 0.68 | 0.89 | ||||||
| Model 5 | 0.65 | 0.19–2.25 | 0.11 | 1.03 | ||||||
| Model 6 | 0.62 | 0.19–2.03 | 0.58 | 0.89 | ||||||
| Week 10 | ||||||||||
| Model 1 | 1.26 | 0.58–2.77 | 1.00 | 0.89 | 1.34 | 1.85 | ||||
| Model 2 | 1.22 | 0.56–2.66 | 1.34 | 0.81 | 1.74 | 1.74 | ||||
| Model 3 | 1.13 | 0.50–2.59 | 0.92 | 0.88 | 1.32 | 1.79 | ||||
| Model 4 | 1.11 | 0.49–2.50 | 1.22 | 0.91 | 1.95 | 1.85 | ||||
| Model 5 | 1.35 | 0.56–3.22 | 0.64 | 1.05 | 0.25 | 2.19 | ||||
| Model 6 | 1.31 | 0.60–2.85 | 0.83 | 0.91 | 1.04 | 1.87 | ||||
| Week 22 | ||||||||||
| Model 1 | 0.82 | 0.45–1.50 | 0.24 | 0.90 | 0.02 | –0.24 to 0.27 | –1.94 | 1.92 | –0.08 | –0.38 to 0.22 |
| Model 2 | 0.78 | 0.42–1.43 | 0.64 | 0.81 | 0.05 | –0.21 to 0.31 | –1.60 | 1.82 | –0.07 | –0.37 to 0.23 |
| Model 3 | 0.70 | 0.36–1.38 | 0.14 | 0.89 | 0.01 | –0.25 to 0.27 | –1.92 | 1.88 | –0.08 | –0.38 to 0.22 |
| Model 4 | 0.72 | 0.38–1.35 | 0.36 | 0.91 | 0.03 | –0.23 to 0.28 | –2.04 | 1.93 | –0.08 | –0.38 to 0.22 |
| Model 5 | 0.89 | 0.41–1.93 | –0.12 | 1.05 | –0.01 | –0.26 to 0.25 | –2.99 | 2.26 | –0.10 | –0.40 to 0.20 |
| Model 6 | 0.83 | 0.45–1.53 | 0.31 | 0.91 | 0.02 | –0.24 to 0.28 | –1.96 | 1.94 | –0.08 | –0.38 to 0.23 |

Follow-Up Outcomes
| HAM-D Score | IDS-SR Score | |||||||||
|---|---|---|---|---|---|---|---|---|---|---|
| Remission | Estimated Mean Difference | Effect Size | Estimated Mean Difference | Effect Size | ||||||
| Model | Odds Ratio | 95% CI | Difference | SE | Cohen’s d | 95% CI | Difference | SE | Cohen’s d | 95% CI |
| Model 1 | 0.74 | 0.41–1.34 | 1.94 | 1.01 | 0.14 | –0.14 to 0.42 | 2.99 | 2.22 | 0.12 | –0.23 to 0.48 |
| Model 2 | 0.69 | 0.38–1.27 | 2.36 | 0.93 | 0.18 | –0.10 to 0.47 | 3.49 | 2.14 | 0.15 | –0.21 to 0.51 |
| Model 3 | 0.64 | 0.33–1.26 | 1.82 | 1.00 | 0.13 | –0.15 to 0.42 | 3.37 | 2.17 | 0.14 | –0.22 to 0.50 |
| Model 4 | 0.61 | 0.33–1.14 | 2.20 | 1.02 | 0.16 | –0.13 to 0.44 | 3.16 | 2.23 | 0.13 | –0.23 to 0.49 |
| Model 5 | 0.72 | 0.35–1.47 | 1.62 | 1.15 | 0.10 | –0.18 to 0.38 | 1.94 | 2.52 | 0.07 | –0.29 to 0.43 |
| Model 6 | 0.75 | 0.41–1.37 | 1.95 | 1.02 | 0.14 | –0.15 to 0.43 | 3.16 | 2.26 | 0.13 | –0.23 to 0.49 |
| Model 7 | 0.68 | 0.35–1.33 | 1.74 | 1.09 | 0.12 | –0.17 to 0.41 | 2.68 | 2.31 | 0.11 | –0.26 to 0.47 |
Adverse Events
Discussion
Strengths and Limitations
Conclusions
References
Information & Authors
Information
Published In
History
Authors
Metrics & Citations
Metrics
Citations
Export Citations
If you have the appropriate software installed, you can download article citation data to the citation manager of your choice. Simply select your manager software from the list below and click Download.
For more information or tips please see 'Downloading to a citation manager' in the Help menu.
View Options
View options
PDF/EPUB
View PDF/EPUBGet Access
Login options
Already a subscriber? Access your subscription through your login credentials or your institution for full access to this article.
Personal login Institutional Login Open Athens loginNot a subscriber?
PsychiatryOnline subscription options offer access to the DSM-5-TR® library, books, journals, CME, and patient resources. This all-in-one virtual library provides psychiatrists and mental health professionals with key resources for diagnosis, treatment, research, and professional development.
Need more help? PsychiatryOnline Customer Service may be reached by emailing [email protected] or by calling 800-368-5777 (in the U.S.) or 703-907-7322 (outside the U.S.).

