Full access
Regular Articles
Published Online: 1 January 2012

Getting Past “g”: Testing a New Model of Dementing Processes in Persons Without Dementia

Publication: The Journal of Neuropsychiatry and Clinical Neurosciences

Abstract

The cognitive correlates of functional status are essential to dementia case-finding. The authors have used structural-equation models to explicitly distinguish dementia-relevant variance in cognitive task performance (i.e., δ) from the variance that is unrelated to a dementing process (i.e., g′). Together, g′ and δ comprise Spearman's “g.” Although δ represents only a small fraction of the total variance in cognitive task performance, it is more strongly associated with dementia severity than is g′. In this analysis, the authors test whether δ can predict future cognitive decline in persons clinically without dementia at baseline. These results have implications for the clinical assessment of dementia and suggest that functional status should assume a more important role.
We have recently argued that dementing processes can be resolved to the cognitive correlates of functional status.1 To the extent that some cognitive domains or measures are more strongly associated with functional outcomes than others, they may vary in their salience to dementia case-finding. To explore this hypothesis, we explicitly distinguished dementia-relevant variance in cognitive task performance (i.e., “δ”) from that which is unrelated to a dementing process (i.e., “g”). Together, g′ and δ effectively comprise Spearman's “g” (i.e., “general intelligence”).2
We recently validated δ in the Texas Alzheimer's Research and Care Consortium (TARCC), a well-characterized cohort of Alzheimer disease (AD) cases and control subjects; δ correlated significantly (r=0.91; p<0.001) with dementia severity, as assessed by the Clinical Rating Scale (CDR) sum of boxes;3 g′ correlates weakly (r = –0.17; p<0.001).
However, neuropathology may clearly be present among nondemented persons.4 In the case of β-amyloid, which can be imaged in vivo, neuropathology in nondemented persons appears to increase the risk of near-term conversion to clinical dementia.5,6 If δ truly represents a dementing process, then its variance among nondemented persons may reflect the preclinical stages of such processes. We examine this possibility in the Freedom House Study (FHS), a longitudinal study of “successful” aging.7 Although the FHS cohort was nondemented and noninstitutionalized at its inception, we have previously shown that it subsequently experienced significant longitudinal declines in global cognition, memory, executive function, and functional status.8 The rate of change in executive function was strongly associated with the decline in functional status, suggesting an emergent dementing process.7 Although we cannot determine the cause of these trends in the FHS data-space, we predict that they will be specifically associated with δ, measured at baseline in this nondemented sample.

METHOD

The Air Force Villages' Freedom House Study

We have studied 547 well elderly retirees as part of the Air Force Villages' (AFV) Freedom House Study (FHS). The AFV is a 1,500-bed CCRC in San Antonio, TX, that is open to Air Force officers and their dependents. At baseline, the FHS subjects represented a random sample of AFV residents over the age of 70 years, living at non-institutionalized levels of care. Informed consent was obtained before their evaluations.
A subset of FHS participants (N=187) were administered a formal neuropsychological test battery that included standardized tests of memory, language, and executive cognitive functioning (ECF). This subgroup was slightly older at baseline than the larger FHS cohort (mean age: 79.0 years versus 77.7 years, respectively), but did not differ significantly with regard to gender, education, baseline level of care, or Mini-Mental State Exam (MMSE) scores. Selected demographic and clinical features are presented in Table 1.
TABLE 1. Subject Characteristics, N=187
SD: standard deviation; IADLs: Instrumental Activities of Daily Living; ADLs: Activities of Daily Living.
At baseline, the cohort is cognitively normal for age, relatively high-functioning, and non-institutionalized. The baseline mean and variability about that mean for each cognitive measure is available elsewhere.7,8 We have also demonstrated that there is significant variability with regard to the cohort's longitudinal rates of change in cognitive performance over time.7 These changes are clearly related to concurrent declines in functional status.8 Thus, despite the fact that the cohort was nondemented at baseline, it is demonstrably suffering from a dementing process that is capable of disabling it in time.

Cognitive Battery Used to Construct δ

Verbal Measures

The Controlled Oral Word Association (COWA)9 is a test of oral word-production (verbal fluency). Patients are asked to say as many words beginning with a certain letter of the alphabet as they can.
The California Verbal Learning Task (CVLT)10 assesses learning and memory processes. Patients are asked to learn and recall two 16-item “shopping lists.” Each list comprises 4 words from 4 semantic categories. Learning takes place over five trial presentations. We modeled the summed number of correct words recalled across Learning Trials 1–5.
The Boston Naming Test (BOSTON)11 is a confrontation naming test that requires the subject to verbally name each of 60 line-drawings of objects of increasingly low frequency.
The Weschler Adult Intelligence Scale–Revised (WAIS–R) Similarities (SIM)12 is a test of verbal conceptualization.
The WAIS–R Vocabulary (VOCAB)12 subtest requires the subject to provide definitions of 35 words.

Nonverbal Measures

The WAIS–R Block Design (BLOCK)12 is a constructional test that asks the subject to replicate 4–9 block designs modeled by the examiner and presented on cards.
The WAIS–R Digit Symbol Coding (DSS)12 is a test of psychomotor speed and attentional control; the subject is asked to copy, as quickly as possible, nonsense symbols corresponding to specific numbers presented in a “key” at the top of the page.

Functional Status

Disability and comorbid medical conditions were assessed with the Older Adults Resources Scale (OARS).13 The OARS is a structured clinical interview that provides self-reported information on activities of daily living (ADL), instrumental activities of daily living (IADL), physical and mental health history, healthcare utilization, and current medications.
We combined scores from the OARS, ADL, and IADL scales into a single Functional Status Index (FSI) and reverse-scaled it relative to the OARS, such that higher scores would reflect intact functional performance. Spector and Fleishman14 have shown that such a combined ADL/IADL index better fits functional status data in older adults, providing enhanced range and sensitivity over the original scales. Both ADL and IADL contribute significantly to level of care in the FHS sample, independently of age.15

Cognitive Outcome Measures

CLOX: An Executive Clock-Drawing Task16 is a brief ECF measure based on a clock-drawing task (CDT). It is divided into two parts: CLOX1 is an unprompted task that is sensitive to executive control. CLOX2 is a copied version that is less dependent on executive skills. Each CLOX subtest is scored on a 15-point scale. Lower CLOX scores show impairment.
The Executive Interview (EXIT25)17 provides a standardized clinical ECF assessment. It contains 25 items designed to elicit signs of frontal-system pathology (e.g., imitation, intrusions, disinhibition, environmental dependency, perseveration, and frontal release). EXIT25 scores range from 0 to 50. Higher scores indicate impairment.
The Mattis Dementia Rating Scale: Memory Subscale(DRS:MEM)18 provides a brief assessment of verbal and nonverbal short-term memory. The memory subtest consists of sentence (five-word) recall, design and word recognition, and orientation items.
The MMSE19 is a well-known and widely-used test for screening for cognitive impairment.20 Scores range from 0 to 30. Lower scores reflect cognitive impairment.
The Trail-Making Test, Parts A and B21 provide a measure of conceptualization, psychomotor speed, and attention. Trails B requires the subject to connect consecutively-numbered and -lettered circles, alternating between the two sequences.
The abbreviated Wisconsin Card Test22 is an adaptation of the original, two-deck (128 cards) Wisconsin Card-Sorting Test (WCST).23 The Abbreviated WCST utilizes one deck of 64 cards. The number of “categories correct” (WCAT) was used as an outcome measure.

Statistical Approach

This analysis was performed using AMOS software.24 All observed variables were adjusted for age, gender, and education. Latent variables of interest were constructed from confirmatory factor analyses performed in a structural-equation framework. Residual covariances were explicitly estimated for each observed measure based on modification indices and theoretical justification.

Missing Data

We used Full Information Maximum Likelihood (FIML) methods to address missing data. FIML uses the entire observed data matrix to estimate parameters with missing data. In contrast to listwise or pairwise deletion, FIML yields unbiased parameter estimates, preserves the overall power of the analysis, and is currently the accepted state-of-the-art method for addressing issues of missing data.25,26

Latent Growth Curves

Longitudinal data were submitted to latent-growth-curve (LGC) modeling. In contrast to multiwave autoregressive models, which estimate interindividual rates of change across measurements, LGC models estimate the full trajectory of change across each individual's measurement points.27 The first and second factor-loadings on the latent growth parameter were fixed at 0 and 1, respectively. The last time-point loading was freely estimated from the data. The covariance between intercept and slope was estimated, and residual variances were constrained to be equal across time unless a better model fit was obtained by releasing the constraints.

Fit Indices

The validity of structural models was assessed by two common test statistics. A nonsignificant chi-square value signifies that the data are consistent with the model.28 A root mean-square error of approximation (RMSEA) of 0.05-or-less indicates a close fit to the data, with models below 0.05 considered “good” fit, and up to 0.08 as “acceptable.”29 The Browne Cudeck Criteria (BCC)30 address the issue of parsimony and are useful for comparing two models that are not necessarily nested, with lower BCC values indicating better fit.

RESULTS

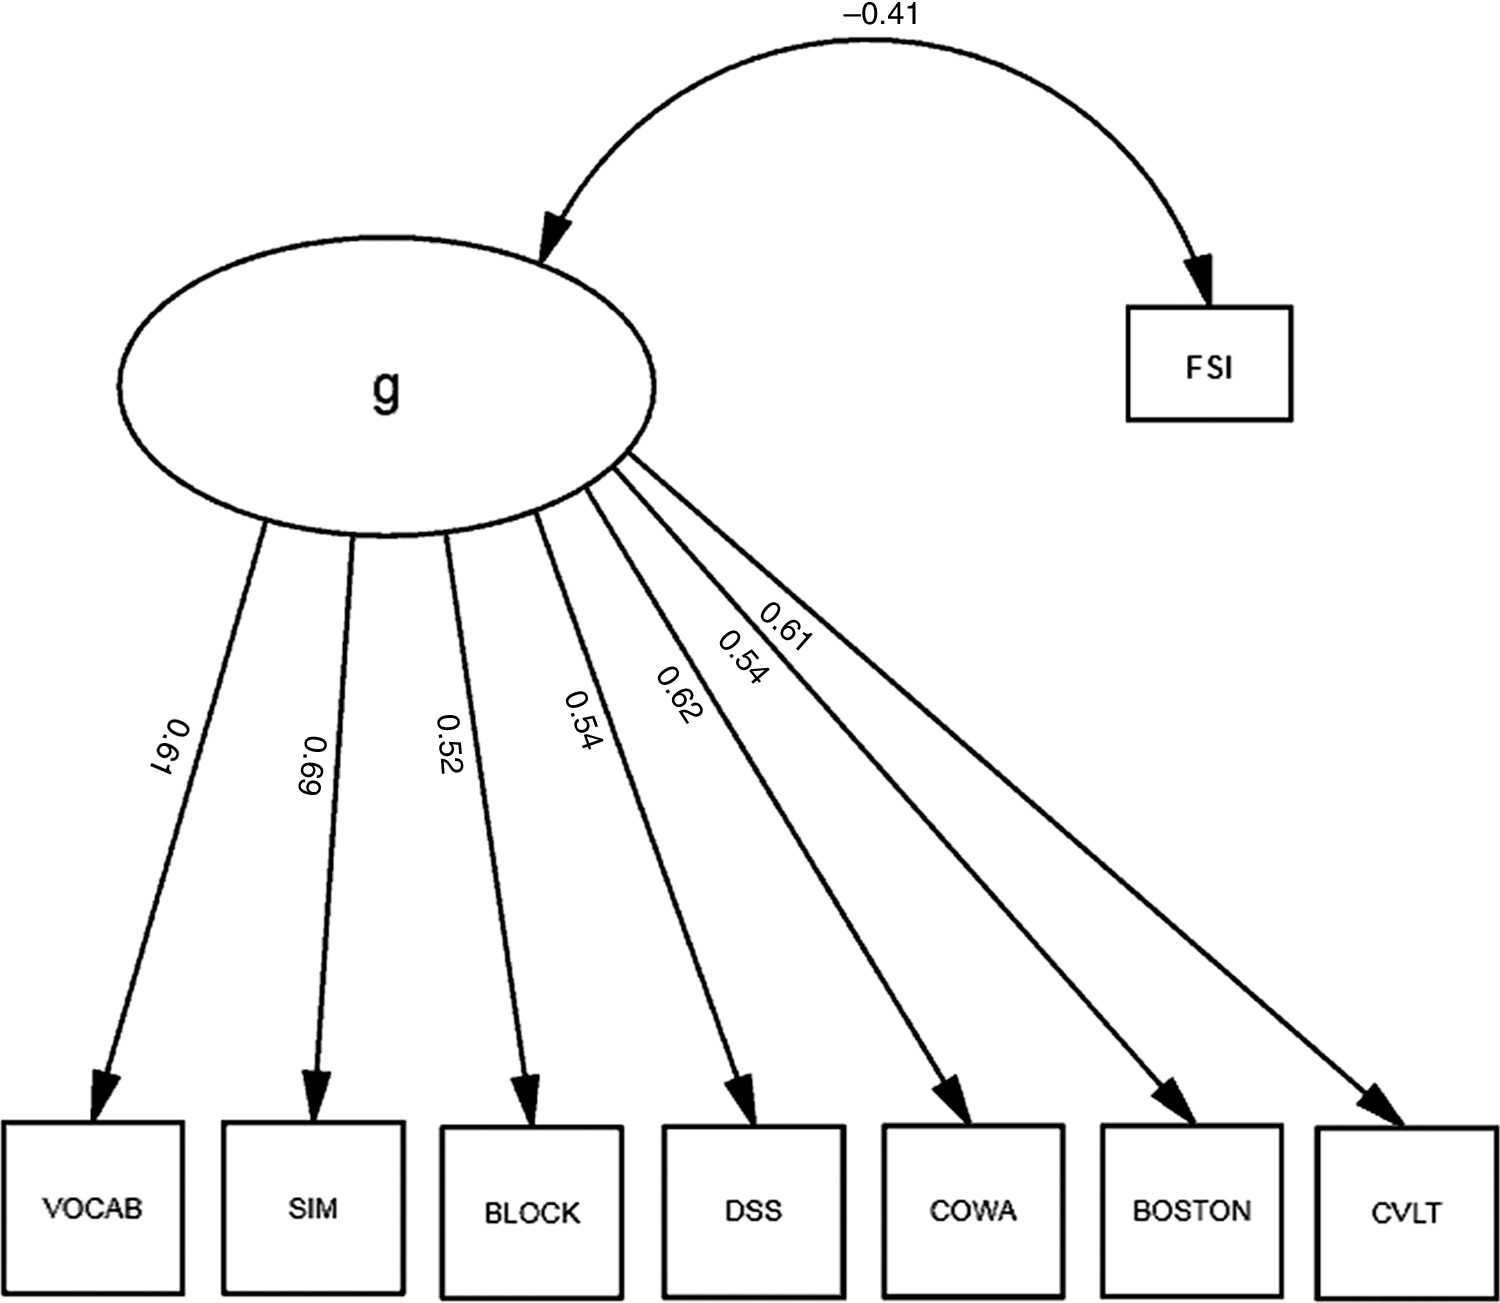
We first built a factor model of a latent variable, “g,” representing the variance shared across the cognitive measures in our battery. Each measure loaded significantly on “g;” “g” was most strongly loaded by WAIS–R SIM (r=0.67), COWA (r=0.62) and VOCAB (r=0.62), and least strongly loaded by WAIS–R BLOCK and DSS (both r=0.50). All loadings were significant (p<0.001).
Next, we correlated our FSI with “g” (Figure 1). “Functional Status” was significantly associated with g (r = –0.41), which explained 16.8% of its variance. Thus, functional status shared a small but significant fraction of the variance in cognitive performance (i.e., “g”); “g” explained 52.3% of the cognitive battery's variance, but the model exhibited marginally-acceptable fit (χ
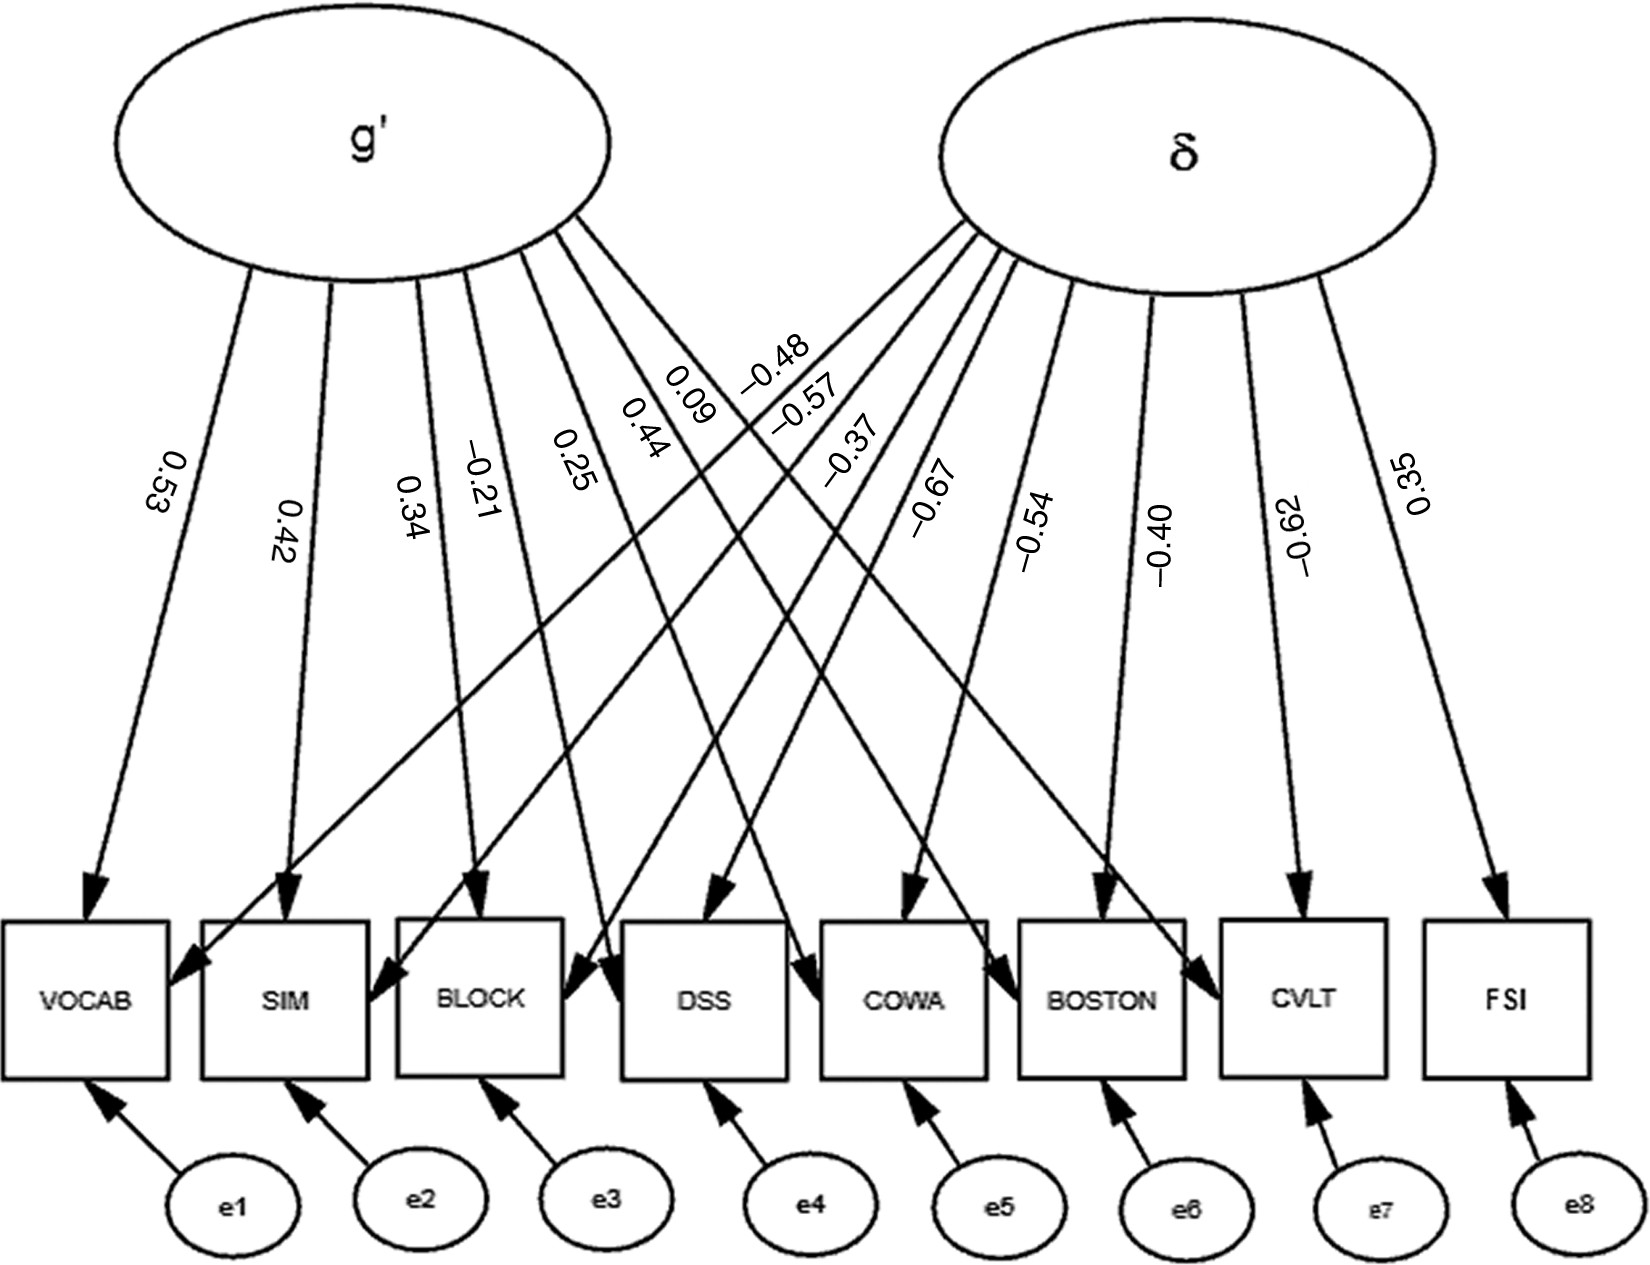
2: F=67.5; df: 18; p<0.001; RMSEA=0.070; BCC=163.38). Moreover, significant correlations among the residuals (data not shown) suggested that a multifactorial model might better fit these data. Therefore, we constructed a second factor, “δ,” representing the shared variance between our FSI and cognitive performance (Figure 2). Unlike the model in Figure 1, this model uses Functional Status as an indicator of a latent variable, rather than its correlate. This effectively parses the shared variance across the cognitive measures (i.e., “g”) into a larger fraction that is not related to functional status (i.e., g′), and a smaller fraction; (i.e., δ; Figure 3). This two-factor model provides better fit to the data than the one-factor model represented in Figure 12: F=32.5; df: 17; p=0.01; RMSEA=0.040; BCC=155.08). δ is significantly related to “Functional Status” (r=0.35) and negatively related to cognitive performance. All loadings on δ are significant. In contrast to g and g′, δ is most strongly loaded by DSS (r = –0.67). WAIS–R BLOCK's association with g′ was attenuated, and the loadings of the CVLT and WAIS–R DSS on g′ are no longer significant after the creation of “δ” (Figure 2).
FIGURE 1. Correlations Between Functional Status and “g”
Scales: WAIS–R Vocabulary; WAIS–R Similarities; Block Design; Digit Symbol; Controlled Oral Word-Association; Boston Naming Test; California Verbal Learning Task; FSI: Functional Status Index.
FIGURE 2. Shared Variance Between the Functional Status Index and Cognitive Performance
Scales: WAIS–R Vocabulary; WAIS–R Similarities; Block Design; Digit Symbol; Controlled Oral Word-Association; Boston Naming Test; California Verbal Learning Task.
FIGURE 3. Explained Variance in Cognitive Performance
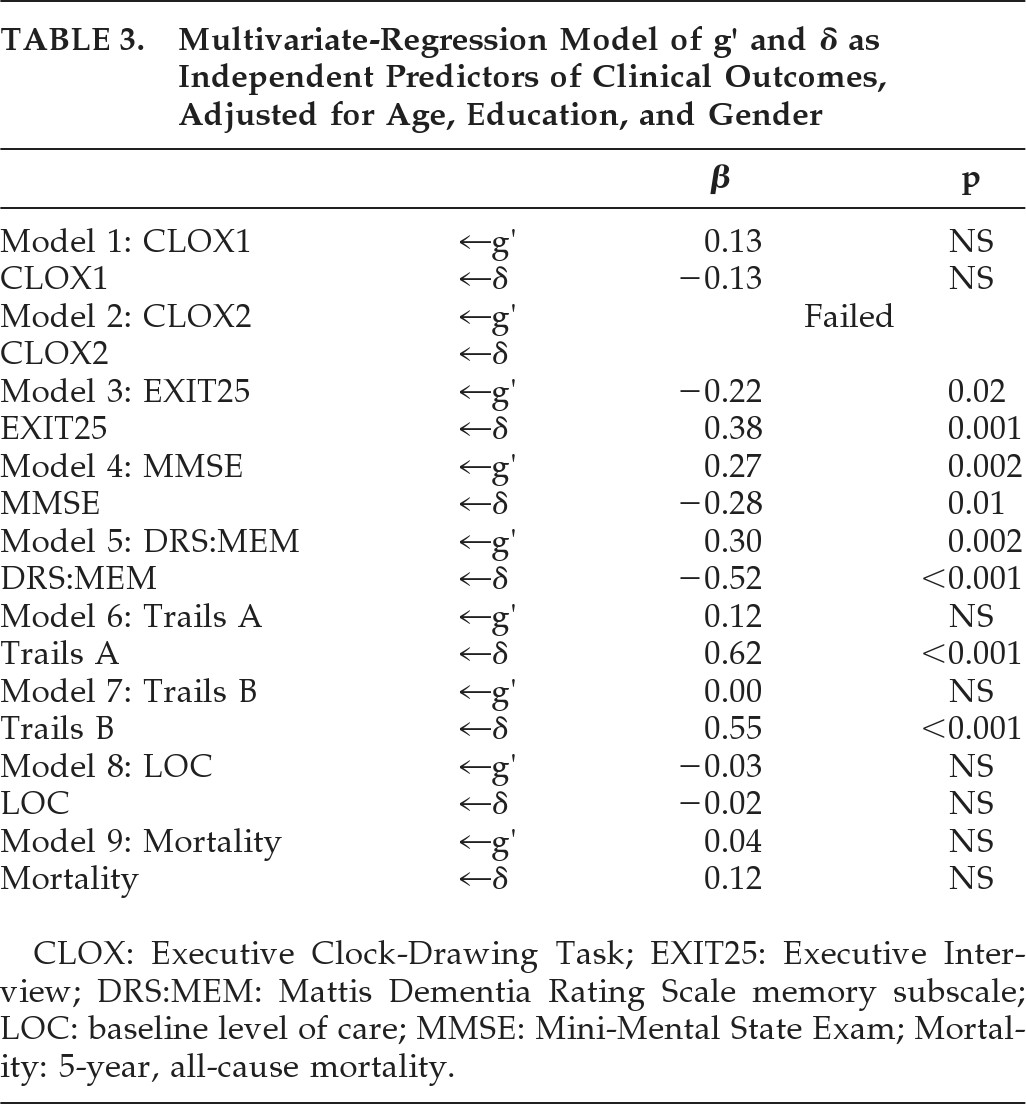
Next, we examined the clinical significance of δ versus g′ in multivariate-regression models of a variety of clinical outcomes. After adjusting for age, education, and gender, g′ and δ were independently, significantly, and moderately associated with DRS:MEM, MMSE, and EXIT25 scores; δ alone was moderately associated with baseline Trails B scores, and strongly associated with Trails A (Table 3). Neither construct was significantly associated with baseline level of care (restricted variability), nor with 5-year, prospective all-cause mortality.
TABLE 2. Raw Variable Means, N=187
a Functional Status: summed, self-reported ADL and IADL scores from the Older Adults Resource Utilization Scale.
SD: standard deviation.
TABLE 3. Multivariate-Regression Model of g′ and δ as Independent Predictors of Clinical Outcomes, Adjusted for Age, Education, and Gender
CLOX: Executive Clock-Drawing Task; EXIT25: Executive Interview; DRS:MEM: Mattis Dementia Rating Scale memory subscale; LOC: baseline level of care; MMSE: Mini-Mental State Exam; Mortality: 5-year, all-cause mortality.
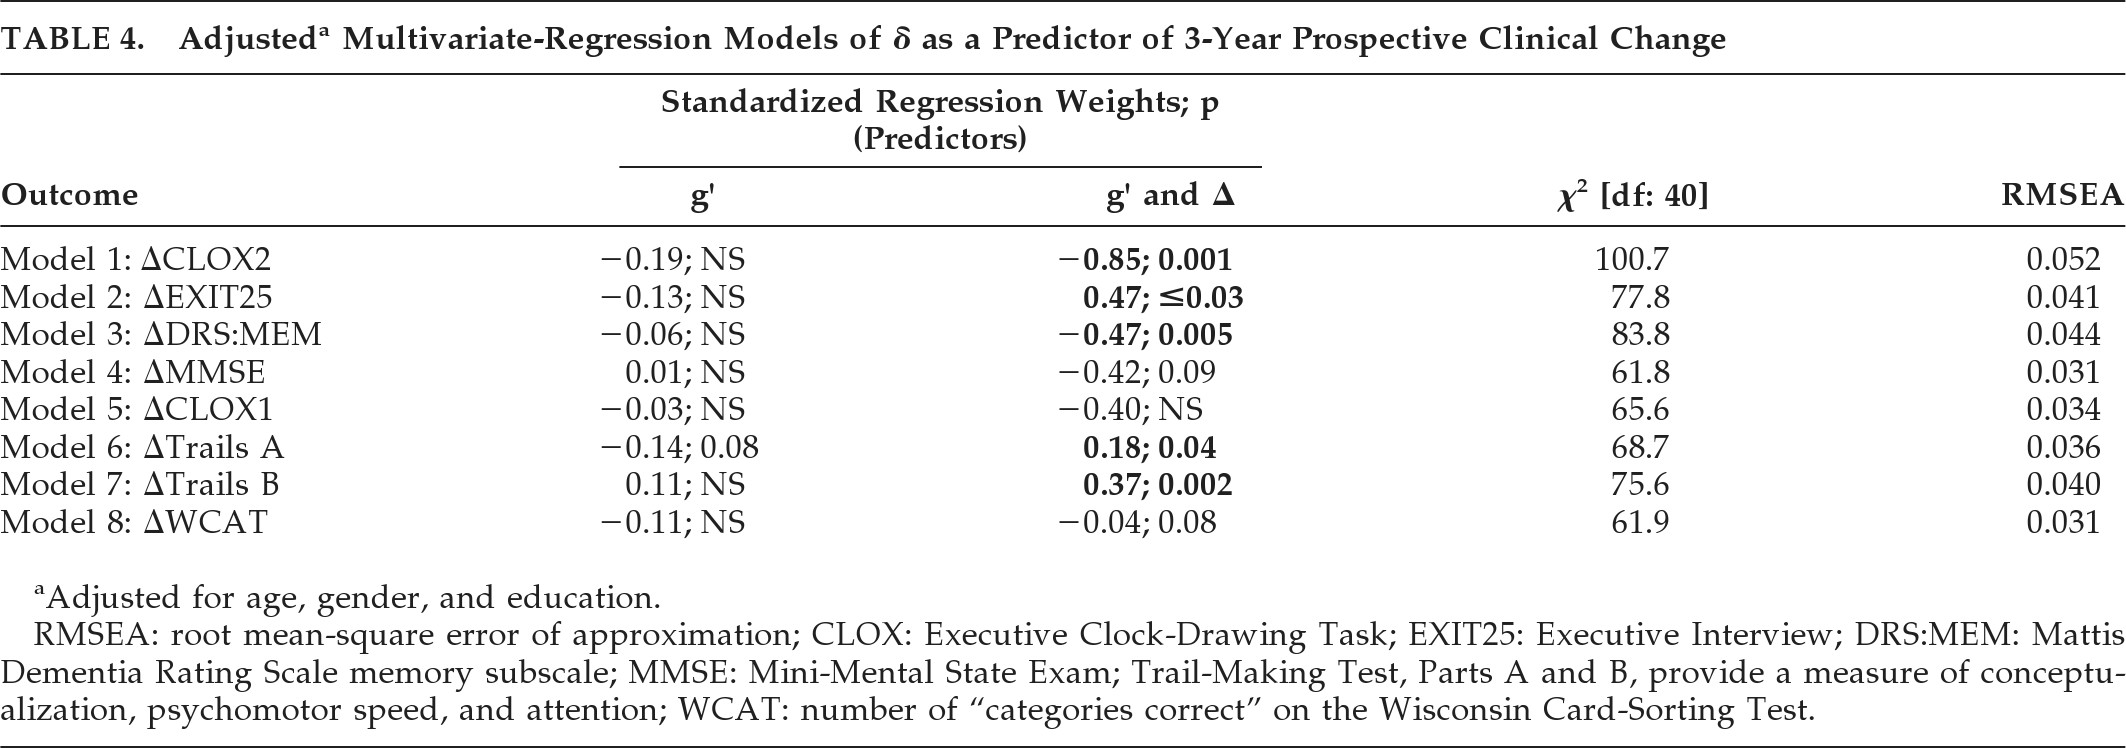
Finally, we examined g′ and δ as independent predictors of 3-year prospective change in cognitive performance, in multivariate-regression models of linear longitudinal change derived from LGC models, adjusted for age, education, and gender (Table 4). All models showed excellent fit (i.e., RMSEA <0.05) except ΔCLOX2, which was acceptable (RMSEA=0.052). Figure 4 presents the ΔEXIT25 model. Once again, δ was most strongly associated with nonverbal measures (DSS; r = –0.75) and g′ was most strongly associated with verbal measures (VOCAB: r=0.62).
TABLE 4. Adjusteda Multivariate-Regression Models of δ as a Predictor of 3-Year Prospective Clinical Change
a
Adjusted for age, gender, and education.
RMSEA: root mean-square error of approximation; CLOX: Executive Clock-Drawing Task; EXIT25: Executive Interview; DRS:MEM: Mattis Dementia Rating Scale memory subscale; MMSE: Mini-Mental State Exam; Trail-Making Test, Parts A and B, provide a measure of conceptualization, psychomotor speed, and attention; WCAT: number of “categories correct” on the Wisconsin Card-Sorting Test.
FIGURE 4. Multivariate-Regression Model of EXIT25 Change, Predictors g′ and δ
Scales: WAIS–R Vocabulary; WAIS–R Similarities; Block Design; Digit Symbol; Controlled Oral Word-Association; Boston Naming Test; California Verbal Learning Task; icept: intercept.
δ was significantly correlated with ΔCLOX2, ΔEXIT25, ΔDRS:MEM, ΔTrails A, and ΔTrails B (Table 4). ΔMMSE showed a trend: g′ was not significantly associated with prospective change in any clinical outcome independently of δ.

DISCUSSION

We recently reconceptualized “dementia” as a disorder affecting the cognitive correlates of functional status. In this article, we provide a formal model of that construct, which parses the variance in measured cognitive performance into three compartments: the shared variance that is relevant to dementia case-finding (i.e., δ); the shared variance that is irrelevant to dementia case-finding because it is not associated with functional outcomes (i.e., g′), and the residual variance that is unique to each specific measure in the battery. Despite the fact that this sample does not have dementia at baseline, previous analyses have demonstrated that it has suffered a longitudinally-evolving cognitive decline that is associated with declines in functional status (i.e., a “dementing process”). These trends are demonstrably associated with δ at baseline. In contrast, g′ has no significant association with longitudinal changes in cognition independently of δ.
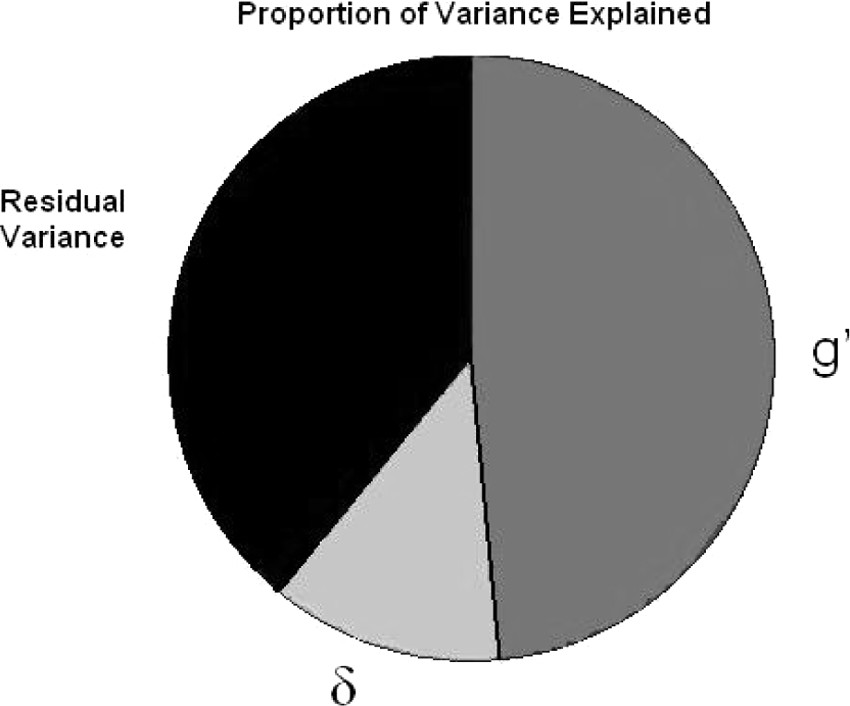
This analysis also reveals how little of the total variance in cognitive performance may actually be relevant to dementia case-finding; δ can be estimated to represent only a small fraction of this sample's total cognitive variance (Figure 3). Nonetheless, δ's variance appears to have more clinical utility than that of g′, and, by definition, g′ has no association with functional status. That so little of the battery's variance is associated with δ may explain why unfiltered cognitive task performance is such a relatively weak predictor of functional outcomes.1
δ is most strongly related to nonverbal measures, whereas g′ is most strongly related to verbal measures. Although it may be tempting to interpret these as reflecting “fluid” (δ) versus “crystalline” (g′) intelligence, respectively, it is important to note that δ differs from these and similar constructs derived from factor analyses of cognitive performance data because functional status as used as an indicator of δ and not its correlate. Thus, δ may correlate with “fluid intelligence,” but it is not its homologue. Since factor analyses suggest a systematic psychometric bias toward measures of memory and verbal abilities, many cognitive batteries may be insensitive to δ, and hence also to functional outcomes and dementia. Thus, for example, Loewenstein et al.31 factor-analyzed an extensive battery of psychometric and functional status measures among 166 patients with AD. Six factors were extracted; however, none of the psychometric measures in Loewenstein et al.'s battery loaded on the factors associated with functional outcomes. Thus, their battery may have failed to detect the essential psychometric correlates of AD dementia, despite the detection of AD-related cognitive changes. We have suggested instead that nonverbal cognitive decline may be most relevant to dementia-case-finding.1 This impression was based in part on studies that report specific associations between nonverbal cognitive functioning and functional outcomes.32,33 Nonverbal performance is strongly associated with δ.
The WAIS–R DSS was most strongly associated with δ and may be relatively useful in dementia assessment. We previously factor-analyzed the FHS psychometric battery, and found that DSS, the EXIT25, and COWA load significantly on a factor indicated also by both ADL and IADL.34 Similarly, Barberger-Gateau et al.35 factor-analyzed a battery composed of both cognitive measures and IADL items. Four factors were extracted. The dominant factor, explaining 30.3% of variance in the data-space, received significant loadings from both cognitive and functional measures. Again, the DSS had the strongest loading (r=0.80). Only this factor was associated with the 4-year cumulative risk of incident dementia in nondemented participants. This and our DSS dominant factor appear homologous to δ.
A potential limitation of this study is that our functional status assessment is relatively primitive and based on subjective ratings. The model might be improved by the use of performance-based functional measures. Pereira et al.36 report an exceptionally strong correlation between the Disability Assessment of Functional Status (DAFS), a performance-based functional assessment, and EXIT25 scores, which are strongly associated here with δ, but not g′. Alternatively, a latent functional-status construct could be derived from the shared variance across several functional-status measures. Such a construct might further reduce the measurement error associated with δ and improve models of its related biomarkers. Also, we note that the residual variance in Figure 3 is substantial and may contain domain-specific cognitive factors. If so, then it is possible that one or more additional cognitive factors would incrementally explain additional variance in functional status, above and beyond that related to δ (i.e., through a significant association with e8 in Figure 2). However, this appears unlikely. In our 2007 review,1 “global cognition” (represented here by g′ and δ) appeared to be more robustly associated with functional outcomes than any domain-specific cognitive capacity, including executive function. Additional analyses should clarify the relative strengths of global versus domain-specific cognitive functioning as predictors of functional outcomes. However, if domain-specific cognitive skills fail to add variance to functional outcomes independently of δ, it will suggest a fundamental limitation in the ability of cognitive measures to describe dementing processes.
Instead, our analysis suggests that the assessment of functional status should assume a larger role in dementia case-finding.37 Such an approach is feasible. Barberger-Gateau et al.38 have demonstrated that, where cognitive assessment is not feasible or unavailable, impairment on any of four IADL items can accurately diagnose dementia in community-dwelling older adults (sensitivity: 0.94; specificity: 0.71).
Unfortunately, neither the dementia literature nor the Mild Cognitive Impairment (MCI) literature has provided cogent guidance regarding the specific functional capacities or functional status measures that should be used to determine the presence of “dementia.” Our model is interesting because it explicitly parses the variance in functional status into dementia-relevant and irrelevant fractions (i.e., e8, in Figure 2), which may represent physical handicap.
δ was independently associated with prospective changes in this initially-nondemented cohort. This suggests the possibility of using δ factor scores to identify the subset of nondemented persons most at risk of near-term conversion to a demented state. This may or may not be synonymous with those recognized as having “MCI” on the basis of baseline cognitive performance, given that 1) the cognitive measures used to make that diagnosis are not necessarily strongly associated with δ; 2) only a fraction of the variance in those relevant measures loads on δ; and 3) IADL, which empirically loads strongly on δ (Royall et al.; unpublished), is seldom used specifically to inform dementia status.
Finally, although we have shown δ to be specifically related to 3-year prospective changes in cognition, it remains a cross-sectional construct. However, there is no reason why we could not reiterate this model over serial observations in order to construct LGC or Growth Mixture Models (GMM) of the temporal change in g′ (Δg′) and δ (Δδ). These may be useful in understanding the natural history of dementing processes or in identifying the biomarkers associated with dementia progression or MCI conversion risk.39 GMM would allow the identification of subgroups within a cohort with differentially-evolving Δδ.
In summary, we have explicitly distinguished dementia-relevant variance in cognitive task performance (i.e., δ) from the variance that is unrelated to a dementing process (i.e., g′). δ represents only a small fraction of the total variance in cognitive task performance, yet it is independently associated with baseline cognition and uniquely associated with longitudinal cognitive change, in contrast to g′. δ is most strongly associated with nonverbal measures, whereas g′ is most strongly associated with verbal tasks. These findings are consistent with previous studies suggesting that nonverbal tasks are more strongly associated with functional outcomes. Our ability to distinguish δ from g′ may improve our ability to model dementing processes among nondemented persons. These results have implications for the clinical assessment of dementia and suggest that functional status should assume a more important role.

References

1.
Royall DR, Lauterbach EC, Kaufer DI, et al.: The cognitive correlates of functional status: a review from the Committee on Research of The American Neuropsychiatric Association. J Neuropsychiatry Clin Neurosci 2007; 19:249–265
2.
Spearman C: General intelligence, objectively determined and measured. Am J Psychol 1904; 15:201–293
3.
Hughes CP, Berg L, Danziger WL, et al.: A new clinical scale for the staging of dementia. Br J Psychiatry 1982; 140:566–572
4.
Davis DG, Schmitt FA, Wekstein DR, et al.: Alzheimer neuropathologic alterations in aged cognitively normal subjects. J Neuropathol Exp Neurol 1999; 58:376–388
5.
Engler H, Forsberg A, Almkvist O, et al.: Two-year follow-up of amyloid deposition in patients with Alzheimer's disease. Brain 2006; 129:2856–2866
6.
Jack CR, Lowe VJ, Weigand SD, et al.: Serial PiB and MRI in normal, mild cognitive impairment, and Alzheimer's disease: implications for sequence of pathological events in Alzheimer's disease. Brain 2009; 132:1355–1365
7.
Royall DR, Palmer R, Chiodo LK, et al.: Executive control mediates memory's association with change in functional status: The Freedom House Study. J Am Geriatr Soc 2005b; 53:11–17
8.
Royall DR, Palmer R, Chiodo LK, et al.: Normal rates of cognitive change in successful aging: The Freedom House Study. J Int Neuropsychological Soc 2005a; 11:899–909
9.
Benton A, Hamsher K: Multilingual Aphasia Examination. Iowa City, IA, AJA Associates; 1989
10.
Delis DC, Kramer JH, Kaplan E, et al.: California Verbal Learning Test: Adult Version Manual. San Antonio, TX, The Psychological Corp., 1987
11.
Kaplan EF, Goodglass H, Weintraub S: The Boston Naming Test, 2nd Edition. Boston, MA, Kaplan & Goodglass; Philadelphia, PA, Lea & Febiger, 1983
12.
Wechsler D: Wechsler Adult Intelligence Scale–Revised. New York, Psychological Corp., 1991
13.
Fillenbaum GG: Validity and reliability of the Multidimensional Functional Assessment Questionnaire, in The OARS Methodology. Duke University Center for the Study of Aging and Human Development. Durham, NC, Duke University, 1978
14.
Spector WD, Fleishman JA: Combining Activities of Daily Living with Instrumental Activities of Daily Living to measure functional disability (abstract). J Gerontol B Psychol Sci Soc Sci 1998; 53:s46–s57
15.
Royall DR, Chiodo LK, Polk MJ: Correlates of disability among elderly retirees with “sub-clinical” cognitive impairment. J Gerontol Med Sci 2000; 55A:M541–M546
16.
Royall DR, Cordes JA, Polk M: CLOX: an executive clock-drawing task. J Neurol Neurosurg Psychiatry 1998; 64:588–594
17.
Royall DR, Mahurin RK, Gray KF: Bedside assessment of executive cognitive impairment: the executive interview (EXIT). J Am Geriatr Soc 1992; 40:1221–1226
18.
Mattis S: Dementia Rating Scale: Professional Manual. Odessa, FL, Psychological Assessment Resources, 1988
19.
Folstein MF, Folstein SE, McHugh PR: Mini-Mental State: a practical method for grading the cognitive state of patients for the clinician. J. Psychiatr Res 1975; 12:198–198
20.
Tombaugh TN, McIntyre NJ: The Mini-Mental State Exam: a comprehensive review. J Am Geriatr Soc 1992; 40:922–935
21.
Reitan RM: Validity of the Trail-Making Test as an indicator of organic brain damage. Percep Mot Skills 1958; 8:271–276
22.
Haaland KY, Vranes LF, Goowdwin JS, et al.: Wisconsin Card-Sorting Test performance in a healthy elderly population. J Gerontol 1987; 42:345–346
23.
Heaton RK, Chelune GJ, Talley JL, et al.: Wisconsin Card-Sorting Test Manual–Revised and Expanded. Odessa, IL, Psychological Assessment Resources, 1993, pp 40–41
24.
Arbuckle JL: Analysis of Moment Structures–AMOS (Computer Program) (Version 7.0). Chicago, IL, SPSS, 2006
25.
Schafer JL, Graham JW: Missing data: our view of the state of the art. Psychol Meth 2002; 7:147–177
26.
Graham JW: Missing-data analysis: making it work in the real world. Ann Rev Psychol 2009; 6:549–576
27.
Willet J, Sayer A: Using covariance structure analysis to detect correlates and predictors of individual change over time. Psychol Bull 1994; 116:363–381
28.
Bollen KA, Long JS: Testing Structural Equation Models. Sage, Thousand Oaks, CA, 1993
29.
Browne M, Cudeck R: Alternative ways of assessing model fit, in Testing Structural Equation Models. Edited by, Bollen KA, Long JS. Sage, Thousand Oaks, CA, 1993, pp 136–162
30.
Browne M, Cudeck R: Single-sample, cross-validation indices for covariance structures. Multivar Behav Res 1989; 24:445–455
31.
Loewenstein DA, Ownby R, Schram L, et al.: An evaluation of the NINCDS-ADRDA neuropsychological criteria for assessment of Alzheimer's disease: a confirmatory factor analysis of single versus multi-factor models. J Clin Exp Neuropsychol 2001; 23:274–284
32.
Artero S, Touchon J, Ritchie K: Disability and mild cognitive impairment: a longitudinal population-based study. Int J Geriatr Psychiatry 2001; 16:1092–1097
33.
Glosser G, Gallo J, Duda N, et al.: Visual perceptual functions predict Instrumental Activities of Daily Living in patients with dementia. Neuropsychiatry Neuropsychol Behav Neurol 2002; 15:198–206
34.
Royall DR, Chiodo LK, Polk M. Executive dyscontrol in normal aging: normative data, factor structure, and clinical correlates, in Current Neurology and Neuroscience Reports, Vol. 3. Edited by, Brust JCM, Fahn S. Current Science, Inc., Philadelphia PA, 2003; 6:487–493
35.
Barberger-Gateau P, Fabrigoule C, Rouch I, et al.: Neuropsychological correlates of self-reported performance in Instrumental Activities of Daily Living and prediction of dementia. J Gerontol B Psychol Sci Soc Sci 1999; 54:P293–P303
36.
Pereira FS, Yassuda MS, Oliveira AM, et al.: Executive dysfunction correlates with impaired functional status in older adults with varying degrees of cognitive impairment. Int Psychogeriatr 2008; 20:1104–1115
37.
Royall DR: Mild cognitive impairment and functional status. J Am Geriatr Soc 2006; 54:163–165
38.
Barberger-Gateau P, Commenges D, Gagnon M, et al.: Instrumental Activities of Daily Living as a screening tool for cognitive impairment and dementia in elderly community-dwellers. J Am Geriatr Soc 1992; 40:1129–1134
39.
Royall DR, Lauterbach EC, Cummings JL, et al.: and the Committee on Research of the American Neuropsychiatric Association: Executive control function: a review of its promise and challenges to clinical research. J Neuropsychiatry Clin Neurosci 2002; 14:377–405

Information & Authors

Information

Published In

Go to The Journal of Neuropsychiatry and Clinical Neurosciences
The Journal of Neuropsychiatry and Clinical Neurosciences
Pages: 37 - 46
PubMed: 22450612

History

Received: 1 April 2011
Accepted: 6 July 2011
Published online: 1 January 2012
Published in print: Winter 2012

Keywords

  1. Aging
  2. Cognition
  3. Dementia
  4. “g,”
  5. Functional Status

Authors

Affiliations

Donald R. Royall, M.D.
From the Departments of Psychiatry (DRR); Medicine (DRR); and Family and Community Medicine (DRR, RFP); the University of Texas Health Science Center, San Antonio, TX; and the South Texas Veterans' Health System Audie L. Murphy Division, GRECC (DRR).
Raymond F. Palmer, Ph.D.
From the Departments of Psychiatry (DRR); Medicine (DRR); and Family and Community Medicine (DRR, RFP); the University of Texas Health Science Center, San Antonio, TX; and the South Texas Veterans' Health System Audie L. Murphy Division, GRECC (DRR).

Notes

Correspondence: Donald R. Royall, M.D.; [email protected] (e-mail).

Metrics & Citations

Metrics

Citations

Export Citations

If you have the appropriate software installed, you can download article citation data to the citation manager of your choice. Simply select your manager software from the list below and click Download.

For more information or tips please see 'Downloading to a citation manager' in the Help menu.

Format
Citation style
Style
Copy to clipboard

There are no citations for this item

View Options

View options

PDF/ePub

View PDF/ePub

Get Access

Login options

Already a subscriber? Access your subscription through your login credentials or your institution for full access to this article.

Personal login Institutional Login Open Athens login
Purchase Options

Purchase this article to access the full text.

PPV Articles - Journal of Neuropsychiatry and Clinical Neurosciences

PPV Articles - Journal of Neuropsychiatry and Clinical Neurosciences

Not a subscriber?

Subscribe Now / Learn More

PsychiatryOnline subscription options offer access to the DSM-5-TR® library, books, journals, CME, and patient resources. This all-in-one virtual library provides psychiatrists and mental health professionals with key resources for diagnosis, treatment, research, and professional development.

Need more help? PsychiatryOnline Customer Service may be reached by emailing [email protected] or by calling 800-368-5777 (in the U.S.) or 703-907-7322 (outside the U.S.).

Media

Figures

Other

Tables

Share

Share

Share article link

Share