Full access
Regular Articles
Published Online: 1 October 2013

The Longitudinal Course of Post-Stroke Apathy Over Five Years

Publication: The Journal of Neuropsychiatry and Clinical Neurosciences

Abstract

Apathy is common after stroke and becomes more prevalent with time, especially in those who show evidence of cognitive and functional decline.

Abstract

The prevalence of apathy is high after stroke, but its subsequent course remains unclear. We sought to determine the longitudinal course and predictors of apathy after stroke. Eligible patients admitted after a stroke and healthy control participants who were rated at least once on the Apathy Evaluation Scale were assessed over 5 years. Rates and levels of apathy in patients rose over 5 years. Significant risk factors for apathy were dementia, interval cerebrovascular events, poor physical functioning, and high depression scores. Apathy is common after stroke and becomes more prevalent with time, especially in those who show evidence of cognitive and functional decline.
While post-stroke depression has received considerable attention in the literature,1 apathy after stroke, in particular, its negative impact on rehabilitation and recovery in stroke patients,24 has been less well examined, despite its clinical significance. Rates of apathy after stroke range from 19% to 50%,3,514 depending on the sample, time of measurement, and method of assessment. Most studies have been cross-sectional. The single longitudinal study of apathy reported that scores peaked 3 months after a stroke, but then abated over 12 months, even when allowing statistically for higher attrition among apathetic patients.5 This contrasts with evidence of increasing rates of apathy in normal elderly people,15 and in those with dementia and with the known high likelihood of dementia after stroke.16 In the Mayo et al. study,5 poor cognitive status, low functional status, and high comorbidity predicted higher apathy. In turn, high apathy had negative effects on physical functioning, participation, health perception, and physical health over the first 12 months after stroke.
We previously reported data from the Sydney Stroke Study3 indicating that apathy was more frequent in stroke patients than in controls. Apathetic stroke patients were older, more functionally dependent, and had lower Mini-Mental State Exam (MMSE)17 scores than those without apathy. We report here the longitudinal course of apathy after stroke over 5 years. Our hypotheses were that apathy would become more pronounced, given the natural history of progression of cerebrovascular disease,18 and that increasing apathy would be associated with worsening cognition, poorer functional status, and dementia onset.

Methods

Subjects

Consecutive eligible patients hospitalized for ischemic stroke (determined by two neurologists), without a history of dementia as determined by retrospective score of <3.3 on the Informant Questionnaire of Cognitive Decline (IQCODE),19 and community-dwelling volunteers without a history of stroke or transient ischemic attack who met entry criteria were asked to participate. Criteria for defining an ischemic stroke, dementia (diagnosed by a consensus panel comprising a neuropsychiatrist, psychogeriatrician, neurologist, and neuropsychologist), and study inclusion and exclusion criteria have been published.3,20 Only patients with ischemic stroke were included in this study. An ischemic stroke was defined as “rapidly developing clinical signs of focal (or global) disturbance of cerebral function, with symptoms lasting 24 hours or longer, with no apparent cause other than of vascular origin” in which a brain CT or MRI scan does not show intracranial hemorrhage.21 Other exclusion criteria for stroke patients and controls were inability to give informed consent, insufficient fluency in English to complete testing, history of dementia or other neurological disease known to affect cognition, alcohol or drug abuse, DSM–IV22 diagnosis of mental retardation, severe aphasia (<3 on the Aphasia Severity Rating Scale of the Boston Diagnostic Aphasia Examination),23 current major psychiatric illness, or lack of an appropriate informant.
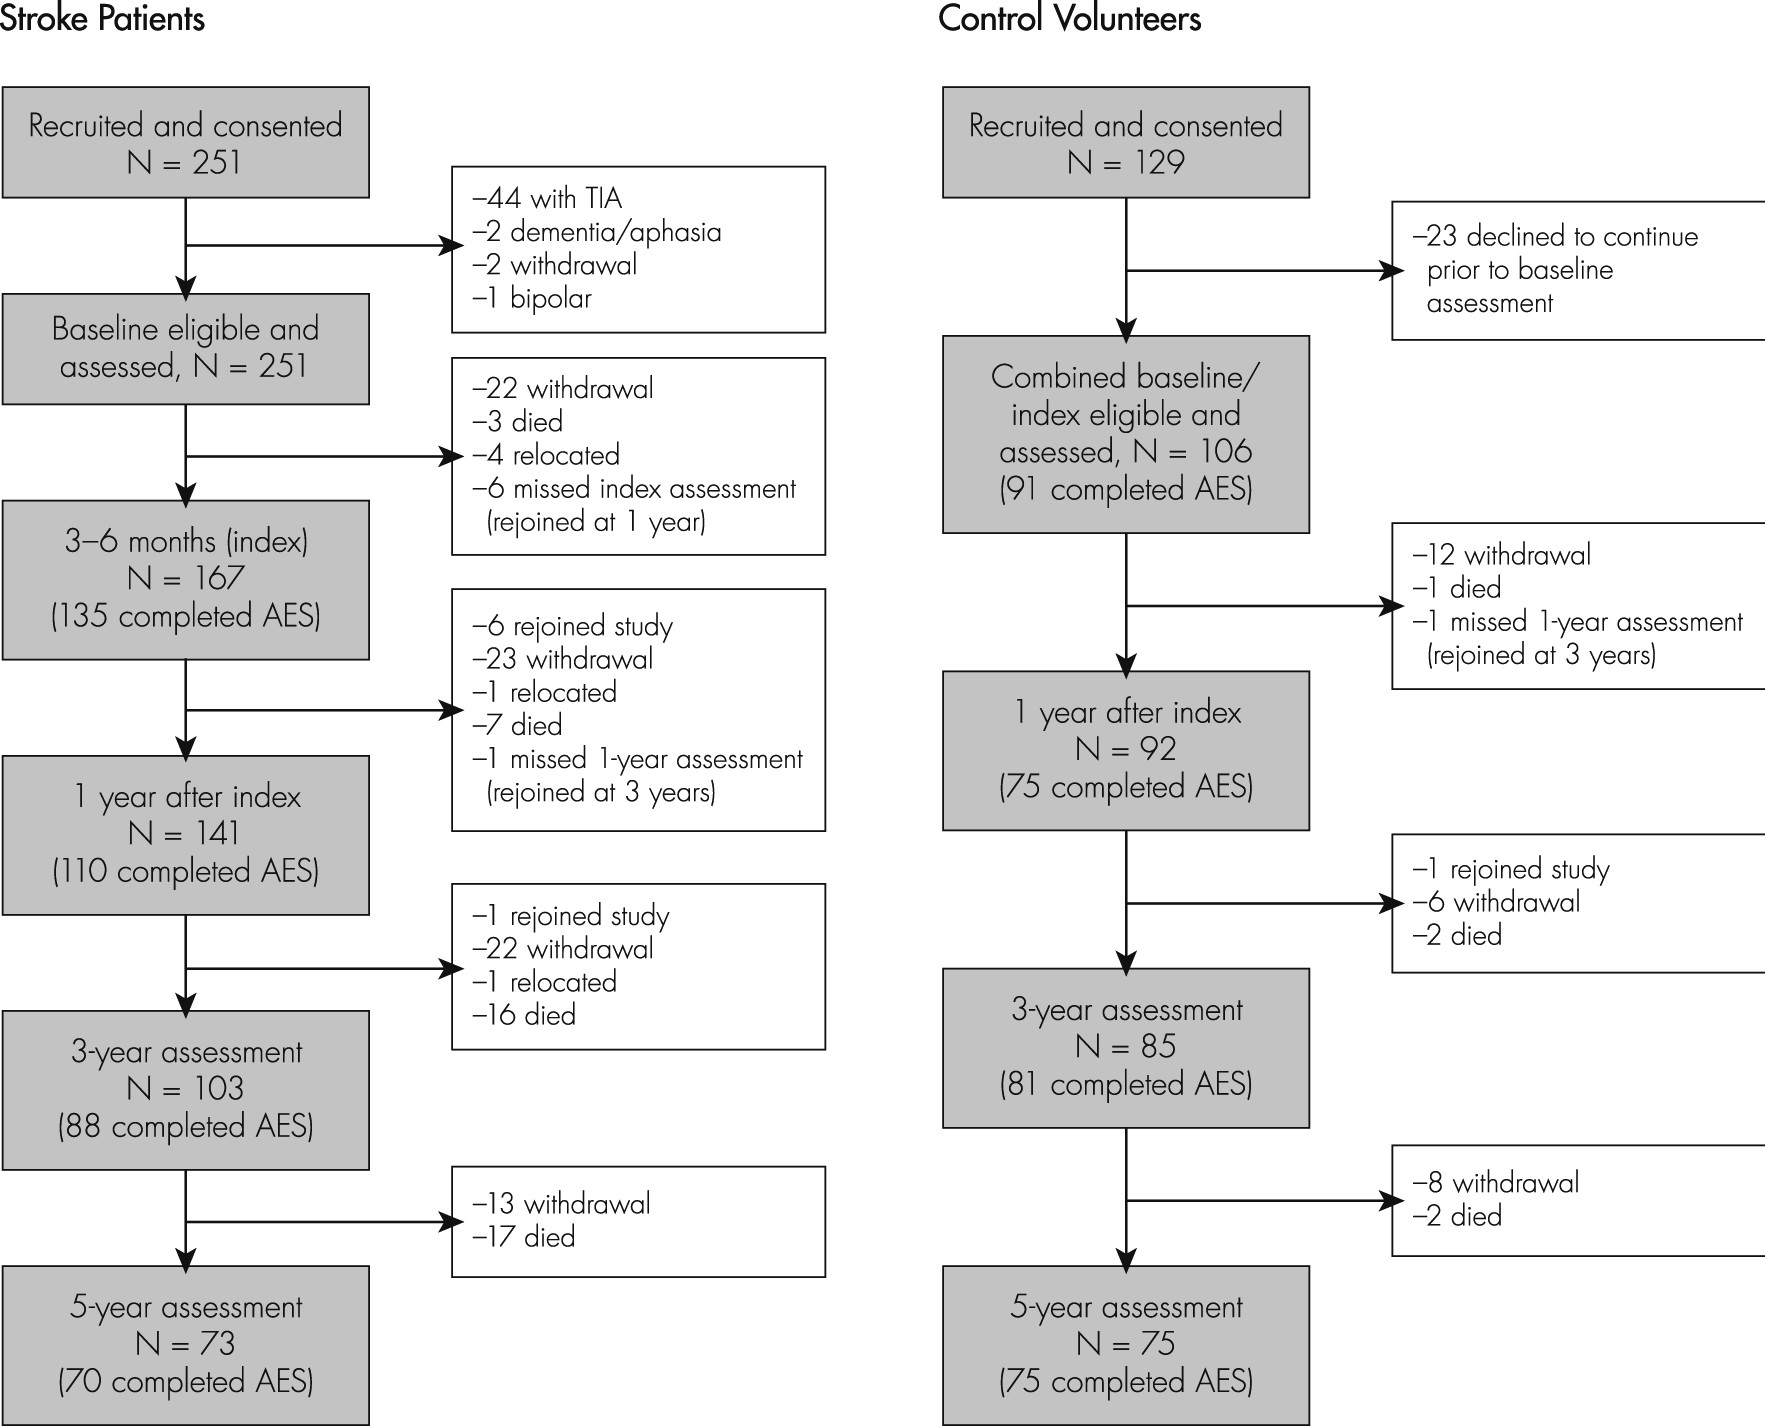
From consecutive admissions over a 38-month period between May 1997 and June 2000 to the inpatient stroke units at Prince of Wales and St. George Hospitals in Sydney, Australia, 251 patients met study criteria and gave consent for entry into the study, but 49 were excluded before baseline assessment (Figure 1). After recruitment in the first week after admission for a stroke (baseline), subjects were reassessed at 3–6 months (index) and then 1, 3, and 5 years later. Of the 202 patients assessed at baseline, 129 subjects were lost to follow-up (80 withdrew; 6 moved out of Sydney; and 43 died). Of the 202 patients, 135 completed the Apathy Evaluation Scale (AES)24,25 at Index, 110 at 1 year, 88 at 3 years, and 70 at 5 years. The 152 patients who completed at least one AES rating comprise the patient sample for this article. Of these 152 patients, 124 (82%) had at least two AES ratings; 82 (54%) had at least three AES ratings; and 45 (30%) had all four AES ratings. Note that follow-ups referred to as 1, 3, and 5 years represent the time after index assessment, which meant approximately 1¼−1½, 3¼–3½, and 5¼–5½ years after baseline admission.
FIGURE 1. Timeline of Sample Attrition of Patients and Control Participants
AES: Apathy Evaluation Scale; TIA: transient ischemic attack.
Control subjects were recruited through advertisement and local community groups. Of the 129 volunteers who met eligibility criteria, 23 declined to continue before the baseline assessment, leaving 106 subjects who were assessed at a combined baseline/index assessment, and at 1, 3, and 5 years after their baseline assessment. Between baseline and the 5-year assessment, 31 subjects were lost to follow-up (Figure 1). Of the 106 control subjects, 101 completed the AES at least once, 91 at index, 75 at 1 year, 81 at 3 years, and 75 at 5 years. The 101 controls who completed at least one AES rating comprise the control sample for this paper. Of the 101 control subjects 88 (87%) had at least two AES rating; 78 (77%) had at least three AES ratings; and 55 (55%) had all four AES ratings.
The study had institutional ethics committee approval, and subjects provided written informed consent upon enrollment after receiving a complete description of the study.

Measures at Baseline Assessment

The baseline assessment for patients and controls included sociodemographic information, neurological and medical history, the European Stroke Scale (ESS),26 and Activities of Daily Living (ADL)27 and Instrumental Activities of Daily Living (IADL).28

Measures at Index and 1-, 3-, and 5-Year Assessments

Clinical Measures

Stroke severity was established with the ESS. Measures of functional ability included ADL and IADL scales. Cerebrovascular risk factors (hypertension, diabetes, hypercholesterolemia, coronary artery disease, peripheral vascular disease, atrial fibrillation, and smoking) and alcohol use were recorded. Patients and informants were questioned about interval cerebrovascular events between baseline and index assessment. Questionnaires about living, marital, and health status were sent out 7–8 years after the baseline assessment. Death records were obtained via the Australian National Death Index up to 10 years after the baseline assessment.

Psychiatric Measures

Apathy was evaluated with the informant-rated version of the AES. When reporting rates, scores on the AES were dichotomized at 36/37, calculated as being two standard deviations (SDs) greater than the mean for the original control subjects at baseline and consistent with other studies.29,30 Depression was measured with the 15-item Geriatric Depression Scale (GDS).31 The GDS was also examined after deleting three items that could be held to measure apathy: “Have you dropped many of your activities and interests?,” “Do you prefer to stay at home rather than going out and doing new things?,” and “No energy.”

Statistical Analyses

Data were analyzed with SAS, Version 9 (SAS Institute, Inc.; Cary, NC) and SPSS, Version 18 (SPSS, Inc.; Chicago, IL). Independent-sample t-tests were used for between-group comparisons on continuous variables. Between-group comparisons on categorical variables were analyzed with chi-square tests with Yates’ Continuity Correction for 2×2 tables and Fisher’s exact test when expected frequencies were lower than 5 in two or more cells. For all analyses, probability levels reported were two-tailed, and levels of significance were set at 0.05.
Restricted maximum-likelihood (REML)-based linear mixed models (PROC MIXED) were used to estimate change of apathy over time and identify significant baseline predictors of apathy, taking into account within-subject correlation (repeated-measures via random-effect specification). Missing data were imputed using multiple imputations (PROC MI). Full details of statistical analyses are provided in Supplementary Methods (online). Briefly, imputations were based on demographic and clinical variables and variables that were associated with the AES and predicted missing-ness (time-varying: dementia, ADL/IADL, GDS, AES).
Main results are given for imputed data and as additional information about the quality of the data imputation; mean AES scores for actual and imputed data are provided in Table 1.
TABLE 1. Clinical Characteristics Over Five Years in Patients and Control Groups and Comparison in Patients With and Without Data Imputation for the AES
 Index1 Year3 Years5 Years
PatientsN=135N=110N=88N=70
 AES32.2 (0.9)33.4 (1.0)36.8 (1.4)37.1 (1.8)
 ADL/IADL11.7 (0.3)11.1 (0.4)10.6 (0.5)11.3 (0.5)
 GDS2.9 (0.2)3.1 (0.3)3.1 (0.3)2.2 (0.3)
 Dementia, %17.9 (3.3)15.7 (3.6)26.7 (4.8)20.6 (4.9)
Without imputation for AESa29.8 (1.5)29.0 (1.3)32.6 (1.7)36.7 (1.7)
With imputation for AESb33.6 (1.0)35.4 (1.2)41.8 (1.7)42.2 (2.5)
ControlsN=91N=75N=81N=75
 AESa24.0 (0.6)26.3 (0.8)26.8 (0.9)29.2 (0.9)
 ADL/IADL13.9 (0.02)13.8 (0.05)13.8 (0.07)13.9 (0.05)
 GDS1.3 (0.2)1.0 (0.2)1.2 (0.2)1.2 (0.2)
 Dementia, %NA1.3 (1.3)1.2 (1.2)0
Values are mean (standard error).
AES: Apathy Evaluation Scale; range: 18–72 (higher score indicates more severe apathy); ADL: Activities of Daily Living, and IADL: Instrumental Activities of Daily Living (IADL), range: 0–14 (higher score indicates better daily activity); GDS: Geriatric Depression Scale, range: 0–15 (higher score indicates more severe depression); NA: not applicable.
a
45 patients who completed the AES at all time-points.
b
107 patients who had at least one AES rating missing and have imputed data for the missing AES rating.
The model for change in apathy over time included the Intercept and Time (measured as a continuous variable in approximate weeks after stroke for patients and weeks after index/baseline assessment for controls). Because of the small sample size, predictors were tested in two stages. The first stage (“univariate model”) included the Intercept, one Baseline/Index or Time-varying predictor, Time, and an interaction between predictor and Time (Table 2, Table 3). The second stage (“multivariate model,” Table 3) included significant predictors from the univariate analyses, Intercept, Time, and two-way interactions between predictors. Nonsignificant interaction terms were removed from models.
TABLE 2. Main Effect of Time and Univariate Predictors of Apathy Over 5 Years After Stroke
PredictorCoefficient (standardized)Standard Error
Time (waves)3.00.5**
Predictor at baseline  
Education, years–1.00.9
Age1.60.9
Gender, female–1.71.9
ADL+IADLa–5.30.9**
ESSb–0.41.1
Dementia12.52.6**
GDSc3.40.9**
GDS minus Items 2, 9, 13d2.41.1*
Interval CVEe11.74.9*
Vascular risk factors, N0.31.0
Time-varying predictor  
Dementia10.41.7**
ADL+IADL–5.30.9**
GDSc3.50.9**
GDS minus Items 2, 9, 13d1.90.5**
a
Lower Activities of Daily Living (ADL) + Instrumental Activities of Daily Living (IADL).
b
European Stroke Scale (ESS).
c
Higher Geriatric Depression Scale (GDS).
d
Higher Geriatric Depression Scale (GDS) minus items 2, 9, 13.
e
Interval cerebrovascular event (CVE) between Baseline and Index. (N.B.: All variables in Table 3 are measured at Index.)
*p <0.05.
**p <0.01.
TABLE 3. Main Effect of Multiple Predictors of Apathy Over 5 Years After Stroke
PredictorCoefficient (standardized)Standard Error
Time1.80.4**
Interval CVE4.13.5
Dementia4.91.8**
ADL+IADLa–5.11.4**
GDSb1.60.8*
GDS minus Items 2, 9, 13c0.80.5
Interval CVE: Interval of cerebrovascular event between Baseline and Index.
a
Lower Activities of Daily Living (ADL) + Instrumental Activities of Daily Living (IADL), time-varying.
b
Higher Geriatric Depression Scale (GDS), time-varying.
c
Results when the 15-item Geriatric Depression Scale (GDS) is replaced with the GDS minus items 2, 9, and 13 (time-varying) in the multivariate model.
*p <0.05.
**p <0.01.
In order to test the trajectories reported by Mayo et al.5 and to identify distinctive patterns of individuals with similar trajectories of apathy over the 5 years after stroke, group-based trajectory modeling32 was used and implemented by SAS Proc Traj.33 Homogeneous latent-trajectory classes were identified, based on this semi-parametric mixed-modeling strategy.34 The censored normal (CNORM) trajectory model is specified to model the conditional distribution of the psychometric scale (Apathy score) data. Trajectory models were fitted on the basis of linear or quadratic trajectories for 3 to 5 groups. The Bayesian Information Criterion (BIC), Akaike Information Criterion (AIC) per subject (smaller in absolute value is better), and the distinctiveness of the trajectories were used to determine the optimal solution for apathy trajectory groups.

Results

The Sample

At baseline, control and stroke patient groups were similar in age and sex ratio, but controls had completed more years of education (Supplementary Table S1). Of 202 stroke patients recruited at baseline, there were no significant differences between the age and sex of the 152 included and 50 excluded patients. Those included had completed more years of education (Supplementary Table S2).

Sample Attrition and Predictors of Missing Data

When missing-ness was tested as a binary outcome variable using logistic regression, more disabled patients were more likely to have missing data AES at 5 years. Of 152 patients in this sample, 70 had AES data at the 5-year assessment. Univariate logistic regression was used to analyze predictors of missing AES data at 5 years. Apathy at index was not a significant predictor (odds ratio [OR]: 1.54; 95% confidence interval [CI]: 0.70–3.37), but Apathy at 1 and 3 years predicted missing AES data at 5 years (OR: 4.53, 95% CI: 1.94–10.57; OR: 5.59, 95% CI: 2.11–14.83, respectively). Dementia at Index, 1, and 3 years (OR: 6.27, 95% CI: 2.04–19.28; OR: 17.68, 95% CI: 3.90 to −80.23; and OR: 4.57, 95% CI: 1.71–12.22, respectively) and lower ADL/IADL scores at Index, 1, and 3 years (OR: 0.72, 95% CI: 0.61 to −0.86; OR: 0.74, 95% CI: 0.64–0.85; and OR: 0.83, 95% CI: 0.75–0.93, respectively) also predicted missing AES data at 5 years. Other significant predictors of missing AES data at 5 years were higher GDS scores at Index, 1-year, and 3-year assessments (OR: 1.18, 95% CI: 1.03–1.36; OR: 1.18, 95% CI: 1.03–1.36; and OR: 1.25, 95% CI: 1.06–1.47, respectively).
Of the 101 control participants, 75 had AES data at the 5-year assessment. Univariate logistic regression was used to analyze predictors of missing AES data at 5 years. Contrary to the systematic attrition in patients, missing 5 year AES data in controls were not predicted by physical or cognitive disability. This indicates that AES levels over time and AES slopes are not comparable between the two groups.

Demographic and Clinical Characteristics

At Index assessment, patients’ mean age was 72.1 (SD: 8.88) years; they had completed 10.2 (SD: 2.75) years of education; 57.9% (88/152) were men. Apathetic patients were older, had lower ADL/IADL scores, and were more likely to have dementia than those without apathy (Supplementary Table S3).
At Index, controls were age 71.1 (SD: 6.1) years and had completed 11.8 years of education; 48.5% (49/101) were men. Four controls (4.4%) were classified as apathetic (4/91). Apathetic control subjects were similar to those without apathy at Index regarding age, education, ADL/IADL scores, and gender ratio (t[89]=1.39, NS; t[89]=0.19, NS; t[88] = −0.49, NS; OR: 2.67, 95% CI: 0.26–26.72, respectively).

Apathy Scores and Rates in Patients and Controls in the Not-Imputed Data

In the observed sample data, mean Apathy scores in the Patient sample increased from 32.2 (SD: 10.27) at Index assessment to 33.4 (SD: 10.23) at 1 year, 36.8 (SD: 14.04) at 3 years, and 37.1 (SD: 10.82) at 5 years. This occurred despite greater attrition of patients with more apathy. Similarly, rates of apathy steadily rose from 26.7% (36/135) at Index assessment, 33.6% (37/110) at 1 year, 34.1% (30/88) at 3 years, to 38.6% (27/70) at 5 years.
In the 45 Completers (patients who completed all AES ratings), mean AES scores were similar at Index (29.8; SD: 10.2) and 1 year (29.0; SD: 8.4), but increased to 32.6 (SD: 11.7) at 3 years, and 36.7 (SD: 11.5) at 5 years. However, these scores likely represent the least disabled group among the patients and are therefore not representative of the total sample.
Among the 101 control subjects, observed AES scores increased from a sample mean of 24.0 (SD: 6.08) at Index to 26.3 (SD: 6.90) at 1 year, 26.8 (SD: 7.92) at 3 years, and 29.2 (SD: 7.73) at 5 years. Rates of Apathy in control subjects rose from 4.4% (4/91) at index to 8.0% (6/75) at 1 year, 9.9% (8/81) at 3 years, and 16.0% (12/75) at 5 years.
When using linear mixed models in the observed (not imputed) data to compare AES levels in patients and controls, there were significant differences in AES scores (estimate: 7.47 [standard error {SE}: 1.10], p <0.0001), as well as change in AES over time (estimate: 0.01 [SE: 0.01], p=0.007), between the two groups. Patients had higher AES scores, on average, across the visits, and greater increase over time, as compared with the control group.

Progression and Predictors of Apathy in the Imputed Data

Linear mixed models based on the imputed data were used to describe the progression and predictors of apathy over time. AES scores in patients increased significantly over 5 years (parameter estimates with multiple imputation — intercept: 41.10 [SE:3.44], 95% CI: 34.12–48.08; df:36, p <0.0001; slope: 0.02 [SE: 0.004], 95% CI: 0.01–0.03, df: 62, t=4.35, p <0.0001). These results were consistent with parameters estimated without multiple imputation (intercept: 31.79 [SE: 0.83], t[151]=38.22, p <0.0001; slope: 0.03 [SE: 0.004], t[124]=7.80, p <0.0001).

Predictors at Index Assessment (3–6 months after baseline recruitment)

Using univariate linear mixed models for index variables, lower ADL/IADL score, dementia, higher GDS, and interval cerebrovascular events (between Baseline and Index) were associated with higher AES scores over time (Table 2).

Time-Varying Predictors

The variables dementia, ADL/IADL, and GDS were additionally measured as time-varying variables across four time-points. Using univariate linear mixed models for time-varying predictors lower ADL/IADL scores, development of dementia and higher GDS scores were associated with higher AES scores over time (Table 3).

Multivariate Models

When significant univariate time-varying (dementia, ADL/IADL, GDS) and index predictors (interval CVA) were combined into a multivariate model, dementia, ADL/IADL, and GDS, but not interval CVA, remained significant predictors.
Linear mixed-effect modeling was also applied to the control group. The result of the univariate and multivariate models are summarized in the data supplement (Tables S4, S5). Gender and ADL/IADL were significant predictors for apathy in the control group.

Group-Based Trajectory Analysis

We tested three- to five-group models in linear and quadratic trajectories. The four-group model with linear trajectory was superior to three- and five-group models, based on consideration of both BIC (−1,458.04) and AIC (−1,439.89), as well as good representation of substantively distinct trajectories; hence, the optimal solution to data on Apathy score after stroke. The four-group model indicated three groups showing stable trajectories of Apathy over time, at distinct levels: Low Apathy (48%), Minor Apathy (29%), and High Apathy (12%); and one group showing a linear increase (11%), that is, a Worsening group.

Discussion

In this, the longest longitudinal study of apathy after stroke, rates of apathy in patients increased steadily over 5 years, from 26.7% to 38.6%; levels rose modestly, from 32.23 to 37.14, on the AES scale. These figures are likely to be underestimates, as there was higher attrition rates in those with apathy, consistent with the experience of Mayo et al.,5 who reported that 478 out of an initial sample of 678 patients (65%) completed follow-up assessments through the first year. As expected, our patients had higher AES levels at Index and a steeper slope than community-based, dementia- and stroke-free control subjects, who themselves had increasing levels of apathy,15 a finding recently confirmed in a larger population study.34 Our findings differ from those from Mayo and colleagues, who reported an overall peak at 3 months after stroke and described several possible trajectories over the next 12 months. Reasons for these differences are discussed below.
Increasing apathy was mainly associated in univariate analyses with factors reflecting more brain pathology, such as worsening functional abilities, interval cerebrovascular events, and dementia diagnoses. When combined into multivariate analysis, the variables associated with apathy reflected cognitive and physical decline (dementia diagnosis and poorer ADL/IADL scores) and depression (as measured with the GDS). The relationship between apathy and depression is complex. Although measurement artifact could be a factor, with items such as lack of interest loading on both Apathy and Depression scales, we consider this unlikely, as the association between apathy and depression remained significant even when we removed these items from the GDS.
Increasing vascular pathology is the most likely cause of increasing apathy. In our previous report, we argued that cumulative vascular pathology might underpin both apathy and depression after stroke, since their overlap increases with longitudinal follow-up and increasing vascular pathology.35 This has been further supported by a community-based study of 3,534 older community-dwellers in The Netherlands who were free of dementia.36 The study found independent associations of stroke, other cardiovascular disease, and cardiovascular risk factors with symptoms of apathy; and, in an exploratory analysis of a subsample of 1,889 participants free of stroke and other cardiovascular disease, associations between apathy and systolic blood pressure, Body Mass Index, type 2 diabetes mellitus, and C-reactive protein.36 Inflammation may also play a role, but others have not found an association between apathy and inflammation, based on measurement of C-reactive protein.36
There are both consistencies and inconsistencies between our study and that of Mayo et al.5 Both studies identified Low, Minor, and High groups with stable trajectories, and a Worsening group based on their optimal trajectory models. Mayo’s study, however, also identified a linear Decreasing (i.e., improving) group, which we did not detect in our three-, four-, or five-group models. A five-group model was considered the optimal solution in Mayo’s study, whereas a four-group model showed best fit to our apathy data, when the same model fitting criteria (BIC, AIC) were applied. The variation might be partially due to the different time-frames of investigations and range of scores on AES. Mayo’s study focused on the apathy change over the first year after stroke and used six items, with scores ranging from 0–12, whereas our study was based on data of apathy change over 5 years, and used full AES, with scores ranging from 18–72.

Limitations

Limitations are the high rate of attrition (significantly through dementia and death) and missing data, with the resulting modest number of subjects and data not missing at random. We tried to account for these limitations by using a large number of imputations (N=20–1,000) and several significant predictors of attrition. Complete case analysis would possibly result in even higher bias; but even in the 45 patients who completed all AES ratings and who probably represent the least disabled patients, AES levels and rates increased over 5 years. Attrition is a major hazard in apathy studies, where motivation is lacking, which may explain the lack of published long-term studies. Thus, our findings are conservative, and rates and levels may be higher, especially given the link between apathy and mortality. Second, and importantly, the statistical analysis does not allow conclusions about causal relationships of the associated factors. Third, we note that use of a hospital-based sample cannot be generalized to community, non-admitted patients with stroke. Fourth, although we did not perform clinical interviews to diagnose cases of apathy, the AES has been validated against clinical diagnosis. Finally, we did not analyze the emotional/ affective, cognitive, and behavioral components of apathy or their associated pathology, which have been linked, respectively, to pathology in orbital–medial prefrontal cortex and related limbic regions within the basal ganglia (e.g., ventral striatum, ventral pallidum), dorsolateral prefrontal cortex, and the related subregions (associative territory) within the basal ganglia (e.g., dorsal caudate nucleus) and the associative and limbic territories of the internal portion of the globus pallidus.37

Implications

Implications for clinicians are the importance of recognizing apathy as a major and common aftermath of stroke, which is associated with poor outcomes for the patient. Its occurrence is likely to be associated with dementia and failing functional abilities.12 Apathy can be readily overlooked because it places few obvious demands on professional caregivers, even though it is burdensome for family caregivers living with the person with apathy; it is associated with disability, and could hamper rehabilitation and reintegration. Importantly, apathy after stroke is more likely to worsen, rather than peak and then improve, yet its management has been little studied. As regards treatment, the statistically significant but modest benefits of some pharmacological strategies for apathy in people with dementia (see review38) need to be weighed against possible adverse effects. Greater benefit may result from nonpharmacological strategies for treating apathy, such as use of therapeutic activities in patients with dementia.39 It is not known whether these findings from studies of people with dementia and apathy are generalizable to post-stroke apathy, and future studies should investigate this.
We conclude that apathy after stroke is common and, contrary to a previous report, becomes more so with time, as cognition and function further decline. Given its reported association with poorer recovery, preventive and management strategies should be investigated.
Footnotes

All authors contributed to the conception and design, or analysis and interpretation of the data, drafting of the article or revising it critically for important intellectual content, and gave their final approval of the version to be published. Megan Heffernan assisted with manuscript preparation.
Disclosures: Over the past 2 years, Dr Brodaty has been a consultant, Advisory Board member, sponsored speaker, and investigator for Pfizer Australia; he has been a speaker, an Advisory Board member for, and received research funding from Janssen Cilag Australia; has been an Advisory Board member, sponsored speaker, and investigator for Lundbeck; an Advisory Board member, sponsored speaker, and investigator for Novartis; has received research funding from Eisai, has been a consultant for Merck and Baxter, was an investigator for Lilly and Sanofi, and was an investigator on grants from National Health and Medical Research Council, Australia.
Over the past 2 years, Dr. Sachdev has received an honorarium from Eli Lilly for one lecture; was a sponsored speaker for Pfizer and Astra Zeneca, an expert witness for medico-legal cases, and was an investigator on grants from the National Health and Medical Research Council Australia.

Supplementary Material

Supplementary Material (283_ds001.pdf)

References

1.
Hackett ML, Yapa C, Parag V, et al.: Frequency of depression after stroke: a systematic review of observational studies. Stroke 2005; 36:1330–1340
2.
Zawacki TM, Grace J, Paul R, et al.: Behavioral problems as predictors of functional abilities of vascular dementia patients. J Neuropsychiatry Clin Neurosci 2002; 14:296–302
3.
Brodaty H, Sachdev PS, Withall A, et al.: Frequency and clinical, neuropsychological, and neuroimaging correlates of apathy following stroke: The Sydney Stroke Study. Psychol Med 2005; 35:1707–1716
4.
Santa N, Sugimori H, Kusuda K, et al.: Apathy and functional recovery following first-ever stroke. Int J Rehabil Res 2008; 31:321–326
5.
Mayo NE, Fellows LK, Scott SC, et al.: A longitudinal view of apathy and its impact after stroke. Stroke 2009; 40:3299–3307
6.
Starkstein SE, Fedoroff JP, Price TR, et al.: Apathy following cerebrovascular lesions. Stroke 1993; 24:1625–1630
7.
Okada K, Kobayashi S, Yamagata S, et al.: Post-stroke apathy and regional cerebral blood flow. Stroke 1997; 28:2437–2441
8.
Angelelli P, Paolucci S, Bivona U, et al.: Development of neuropsychiatric symptoms in post-stroke patients: a cross-sectional study. Acta Psychiatr Scand 2004; 110:55–63
9.
Yamagata S, Yamaguchi S, Kobayashi S: Impaired novelty-processing in apathy after subcortical stroke. Stroke 2004; 35:1935–1940
10.
Carota A, Berney A, Aybek S, et al.: A prospective study of predictors of post-stroke depression. Neurology 2005; 64:428–433
11.
Glodzik-Sobanska L, Slowik A, Kieltyka A, et al.: Reduced prefrontal N-acetylaspartate in stroke patients with apathy. J Neurol Sci 2005; 238:19–24
12.
Hama S, Yamashita H, Shigenobu M, et al.: Depression or apathy and functional recovery after stroke. Int J Geriatr Psychiatry 2007; 22:1046–1051
13.
Ferro JM, Caeiro L, Santos C: Post-stroke emotional and behavior impairment: a narrative review. Cerebrovasc Dis 2009; 27(Suppl 1):197–203
14.
Onoda K, Kuroda Y, Yamamoto Y, et al.: Post-stroke apathy and hypoperfusion in basal ganglia: SPECT study. Cerebrovasc Dis 2011; 31:6–11
15.
Brodaty H, Altendorf A, Withall A, et al.: Do people become more apathetic as they grow older? a longitudinal study in healthy individuals. Int Psychogeriatr 2010; 22:426–436
16.
Pohjasvaara T, Erkinjuntti T, Vataja R, et al.: Dementia three months after stroke: baseline frequency and effect of different definitions of dementia in the Helsinki Stroke Aging Memory Study (SAM) cohort. Stroke 1997; 28:785–792
17.
Folstein MF, Folstein SE, McHugh PR: “Mini-Mental State:” a practical method for grading the cognitive state of patients for the clinician. J Psychiatr Res 1975; 12:189–198
18.
Sachdev PS, Wen W, Chen X, et al.: Progression of white-matter hyperintensities in elderly individuals over 3 years. Neurology 2007; 68:214–222
19.
Jorm AF: A short form of the Informant Questionnaire on Cognitive Decline in the Elderly (IQCODE): development and cross-validation. Psychol Med 1994; 24:145–153
20.
Sachdev PS, Brodaty H, Valenzuela MJ, et al.: The neuropsychological profile of vascular cognitive impairment in stroke and TIA patients. Neurology 2004; 62:912–919
21.
Kunitz SC, Gross CR, Heyman A, et al.: The pilot Stroke Data Bank: definition, design, and data. Stroke 1984; 15:740–746
22.
American Psychiatric Association: Diagnostic and Statistical Manual of Mental Disorders (DSM-IV-TR). Washington, DC, American Psychiatric Association, 2000
23.
Goodglass H, Kaplan E: The Assessment of Aphasia and Related Disorders. Philadelphia, PA, Lea & Febiger, 1983
24.
Marin RS: Apathy: a neuropsychiatric syndrome. J Neuropsychiatry Clin Neurosci 1991; 3:243–254
25.
Marin RS, Biedrzycki RC, Firinciogullari S: Reliability and validity of the Apathy Evaluation Scale. Psychiatry Res 1991; 38:143–162
26.
Hantson L, De Weerdt W, De Keyser J, et al.: The European Stroke Scale. Stroke 1994; 25:2215–2219
27.
Katz S, Akpom CA: A measure of primary sociobiological functions. Int J Health Serv 1976; 6:493–508
28.
Lawton MP, Brody EM: Assessment of older people: self-maintaining and instrumental activities of daily living. Gerontologist 1969; 9:179–186
29.
Kant R, Duffy JD, Pivovarnik A: Prevalence of apathy following head injury. Brain Inj 1998; 12:87–92
30.
Andersson S, Krogstad JM, Finset A: Apathy and depressed mood in acquired brain damage: relationship to lesion localization and psychophysiological reactivity. Psychol Med 1999; 29:447–456
31.
Sheikh JI, Yesavage JA: Geriatric Depression Scale (GDS): recent evidence and development of a shorter version, in Clinical Gerontology: A Guide to Assessment and Intervention. Edited by, Brink TL. New York, The Haworth Press, Inc., 1986, p, pp 165–173
32.
Clogg C: Latent class models, in Handbook of Statistical Modeling for the Social and Behavioral Sciences. Edited by Arminger G, Clogg AC, Sobel ME. New York, Plenum, 1995
33.
Jones BL, Nagin DS, Roeder K: A SAS Procedure Based on Mixture Models for Estimating Developmental Trajectories. Sociol Methods Res 2001; 29:374–393
34.
Ligthart SA, Richard E, Fransen NL, et al.: Association of vascular factors with apathy in community-dwelling elderly individuals. Arch Gen Psychiatry 2012; 69:636–642
35.
Withall A, Brodaty H, Altendorf A, et al.: A longitudinal study examining the independence of apathy and depression after stroke: the Sydney Stroke Study. Int Psychogeriatr 2011; 23:264–273
36.
Maas DW, van der Mast RC, de Craen AJM: Increased C-reactive protein is not associated with apathy: The Leiden 85-Plus Study. Int J Geriatr Psychiatry 2009; 24:1177–1184
37.
Levy R, Dubois B: Apathy and the functional anatomy of the prefrontal cortex-basal ganglia circuits. Cereb Cortex 2006; 16:916–928
38.
Berman K, Brodaty H, Seeher K, et al.: Pharmacological treatment of apathy in dementia: a systematic review. Am J Geriatr Psychiatry 2012; 20:104–122
39.
Brodaty H, Burns K: Nonpharmacological management of apathy in dementia: a systematic review. Am J Geriatr Psychiatry 2012; 20:549–564; 10.1097/JGP.1090b1013e31822be31242

Information & Authors

Information

Published In

Go to The Journal of Neuropsychiatry and Clinical Neurosciences
The Journal of Neuropsychiatry and Clinical Neurosciences
Pages: 283 - 291
PubMed: 24247855

History

Received: 3 April 2012
Revision received: 16 August 2012
Accepted: 1 October 2012
Published online: 1 October 2013
Published in print: Fall 2013

Authors

Details

Henry Brodaty, M.D., D.Sc.
From the Centre for Healthy Brain Ageing, School of Psychiatry, Faculty of Medicine, University of New South Wales, Sydney NSW 2052, Australia (HB, PSS); Dementia Collaborative Research Centre, School of Psychiatry, Faculty of Medicine, University of New South Wales, Sydney NSW 2052, Australia (HB, ZL); School of Community Health, University of New South Wales, Sydney, NSW, 2052 Australia (AW); Neuropsychiatric Institute, Prince of Wales Hospital, Barker Street, Randwick NSW 2031, Australia (PSS).
Zhixin Liu, Ph.D.
From the Centre for Healthy Brain Ageing, School of Psychiatry, Faculty of Medicine, University of New South Wales, Sydney NSW 2052, Australia (HB, PSS); Dementia Collaborative Research Centre, School of Psychiatry, Faculty of Medicine, University of New South Wales, Sydney NSW 2052, Australia (HB, ZL); School of Community Health, University of New South Wales, Sydney, NSW, 2052 Australia (AW); Neuropsychiatric Institute, Prince of Wales Hospital, Barker Street, Randwick NSW 2031, Australia (PSS).
Adrienne Withall, Ph.D.
From the Centre for Healthy Brain Ageing, School of Psychiatry, Faculty of Medicine, University of New South Wales, Sydney NSW 2052, Australia (HB, PSS); Dementia Collaborative Research Centre, School of Psychiatry, Faculty of Medicine, University of New South Wales, Sydney NSW 2052, Australia (HB, ZL); School of Community Health, University of New South Wales, Sydney, NSW, 2052 Australia (AW); Neuropsychiatric Institute, Prince of Wales Hospital, Barker Street, Randwick NSW 2031, Australia (PSS).
Perminder S. Sachdev, M.D., Ph.D.
From the Centre for Healthy Brain Ageing, School of Psychiatry, Faculty of Medicine, University of New South Wales, Sydney NSW 2052, Australia (HB, PSS); Dementia Collaborative Research Centre, School of Psychiatry, Faculty of Medicine, University of New South Wales, Sydney NSW 2052, Australia (HB, ZL); School of Community Health, University of New South Wales, Sydney, NSW, 2052 Australia (AW); Neuropsychiatric Institute, Prince of Wales Hospital, Barker Street, Randwick NSW 2031, Australia (PSS).

Notes

Send correspondence to Henry Brodaty M.D., D.Sc., Dementia Collaborative Research Centre, The University of New South Wales, Sydney, Australia; e-mail: [email protected]

Funding Information

This study was performed with grants from the National Health and Medical Research Council of Australia (970922, 222842).

Metrics & Citations

Metrics

Citations

Export Citations

If you have the appropriate software installed, you can download article citation data to the citation manager of your choice. Simply select your manager software from the list below and click Download.

For more information or tips please see 'Downloading to a citation manager' in the Help menu.

Format
Citation style
Style
Copy to clipboard

View Options

View options

PDF/EPUB

View PDF/EPUB

Login options

Already a subscriber? Access your subscription through your login credentials or your institution for full access to this article.

Personal login Institutional Login Open Athens login
Purchase Options

Purchase this article to access the full text.

PPV Articles - Journal of Neuropsychiatry and Clinical Neurosciences

PPV Articles - Journal of Neuropsychiatry and Clinical Neurosciences

Not a subscriber?

Subscribe Now / Learn More

PsychiatryOnline subscription options offer access to the DSM-5-TR® library, books, journals, CME, and patient resources. This all-in-one virtual library provides psychiatrists and mental health professionals with key resources for diagnosis, treatment, research, and professional development.

Need more help? PsychiatryOnline Customer Service may be reached by emailing [email protected] or by calling 800-368-5777 (in the U.S.) or 703-907-7322 (outside the U.S.).

Media

Figures

Other

Tables

Share

Share

Share article link

Share