Major depressive disorder (MDD) is the most prevalent cause of suicide and is the fourth most common disability in both genders and all ages, according to a 2001 World Health Organization
1 report. The lifetime prevalence of MDD in youth is approximately 15%−20%, which is similar to adult prevalence figures.
2Existing evidence suggests abnormalities in the frontal-subcortical circuitry in MDD.
3,4 Computed axial tomography and magnetic resonance imaging (MRI) are sensitive, noninvasive methods used to assess the living brain, including the cortical and subcortical areas. Diffusion tensor imaging (DTI) is a novel MRI technique that helps detect white matter microstructural changes that are not otherwise visible on routine MRI or computed tomography scans.
5 Fractional anisotropy (FA), a measure of DTI, indicates the principal direction of water diffusion along the white fiber tracts.
6 Two methods to analyze DTI data include the fully automatic, faster, whole-brain voxel-based analysis (VBA) and the manually drawn region-of-interest (ROI) method. Although it is more sensitive to abnormalities in small structures, the ROI method lacks a valid protocol.
7Olvet et al.
8 used an ROI approach and recently reported that FA values in the dorsomedial prefrontal cortex were lower in MDD patients who had attempted suicide, findings that were confirmed with tract-based spatial statistics. Li et al.
9 found no correlation between lowered FA values in the prefrontal cortex with depression severity and illness course using an ROI method. In another study by Wang et al.,
10 higher mean FA values in the left superior longitudinal fasciculus in medication-naïve MDD patients did not correlate with the severity of depression or illness duration using tract-based spatial statistics. The main limitation of tract-based spatial statistics is that it does not enable the study of white matter tracts of the entire brain. VBAs detected abnormal FA values in the fronto-occipital fasciculus and corpus callosum in two groups (aged 18–29 years and 30–45 years) of patients with first-episode untreated MDD.
11 In a low-field (1.5T) VBA, Ota et al.
12 studied 21 patients with depression and 24 patients with MDD with atypical features and found low FA values in the corpus callosum, the inferior fronto-occipital fasciculus, and the left superior longitudinal fasciculus.
In this study, we used manually drawn ROI analysis and VBA using DTI 3T MRI scanning to explore microstructural white matter abnormalities implicated in the pathophysiology of MDD in young adults. In this group of medication-naïve patients with first-episode MDD, we hypothesized that 1) FA values (a quantifiable measure on DTI) would detect white matter changes in the frontal-subcortical regions, complemented by both ROI and VBA methods; and 2) these DTI results would correlate with the severity of depressive symptoms.
Methods
Subjects
Subjects were recruited with a diagnosis of MDD from the Psychiatry Outpatient Department of the University College of Medical Sciences and Guru Teg Bahadur Hospital, which is a tertiary care teaching hospital in Delhi, India. We also recruited healthy controls from Delhi who were willing to participate in the study. Healthy controls were matched for age with study group participants. All participants were right-handed and provided written informed consent after receiving a detailed explanation of the study. A patient information sheet in both Hindi and English was provided to all of the study subjects. The University College of Medical Sciences Institutional Ethical Committee approved this study. Fifteen subjects, aged 18–45 years (seven men and eight women), who had a diagnosis of first-episode, treatment-naïve MDD based on DSM-IV criteria provided written informed consent and were included. Exclusion criteria were past/present history of chronic medical conditions or other psychiatric disorder comorbidity on axis I and/or axis II, family history of psychiatric disorder in first-degree relatives, neurological conditions (e.g., dementia, stroke, head injury, seizures, or loss of consciousness), Mini-Mental State Examination score <24, substance abuse or dependence, and any metal devices or gravidity in situ. Healthy right-handed controls (six men and nine women) were recruited through advertisements providing information about the study. A detailed medical examination, including psychiatric history and routine and special investigations with appropriate referrals to other specialties wherever necessary, was carried out in our tertiary care, multispecialty, teaching, government-run hospital, which provides free services. All healthy controls were screened using the 12-item General Health Questionnaire, and those with a score >2 were excluded. The 17-item Hamilton Depression Rating Scale was administered to all participants. Healthy controls were matched for age on an individual basis with study participants.
Clinical Measures
A detailed psychiatric examination including history was performed for all patients to diagnose MDD, and information was noted in a semistructured interview. The Structured Clinical Interview for DSM-IV was administered by experienced psychiatrists. The severity of depressive symptoms was rated using the 17-item Hamilton Depression Rating Scale.
MRI Protocol
Brain MRI examinations were performed at the Institute of Human Behavior and Allied Sciences Imaging Centre, using a 3T MRI scanner. Ear plugs were given to all study subjects to reduce noise disturbance incurred during MRI scanning. Images were obtained using T1-weighted fluid-attenuated inversion recovery with T2-weighted fast-spin echo scanning. Sagittal, coronal, fluid-attenuated inversion recovery, and diffusion axial images were obtained using a twin-gradient, 16-channel high-density 3T system with a zoom gradient coil. DTI scans were acquired with a 65-direction encoding DTI sequence (b=1000 s/mm3) and an axial acquisition without diffusion weighting (b=0). Scan parameters included repetition time (6000 ms), echo time (78 ms), and number of excitations (N=1). The total time spent on each study protocol was approximately 40 minutes. Provisional MRI reporting of all images of patients and controls was performed by an independent radiologist (not involved in DTI processing). The two psychiatrists were only aware of the case/control status of the data sets, which was kept anonymous for further DTI postprocessing.
ROI Analyses
ROI analysis was carried out using an Advantage Workstation 4.4 (GE Medical Systems) and FuncTool software (version 4.5.3; GE Medical Systems) for data analysis. DTI data were processed, and eddy current distortion was corrected using FuncTool software. FA maps were generated using DTI data.
13 Previous studies have shown that the frontal-subcortical circuit is involved in mood regulation.
3,4 Different regions of the brain (e.g., the bilateral hippocampus, genu and splenium of the corpus callosum, thalamus, lentiform nucleus, fornix, superior longitudinal fasciculus, prefrontal cortex, inferior parietal region, and cingulate cortex) were selected based on previously reported evidence on the pathophysiology of depression.
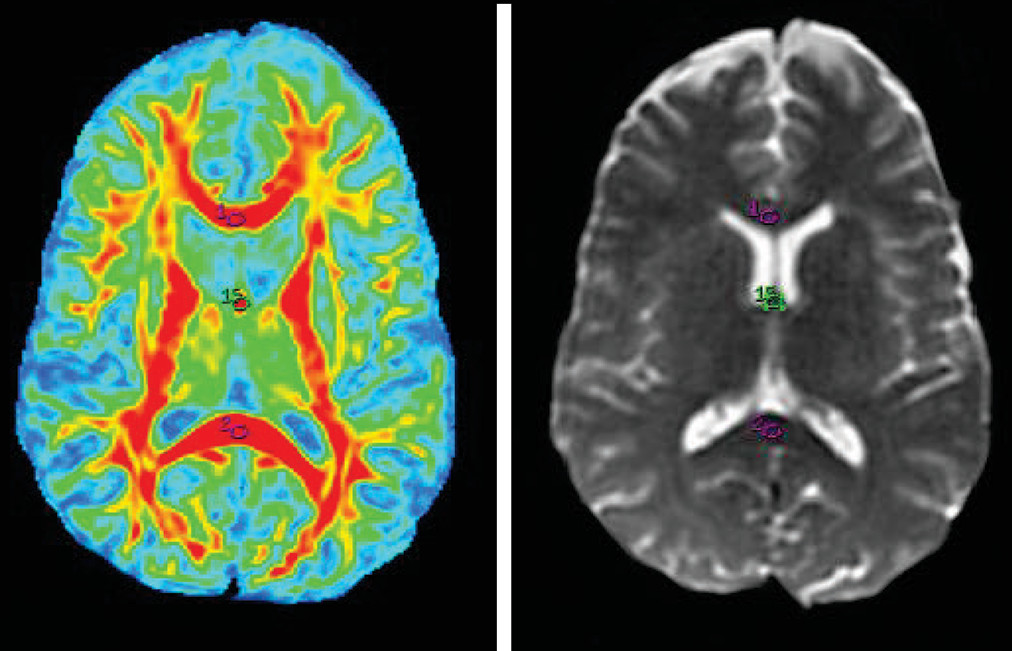
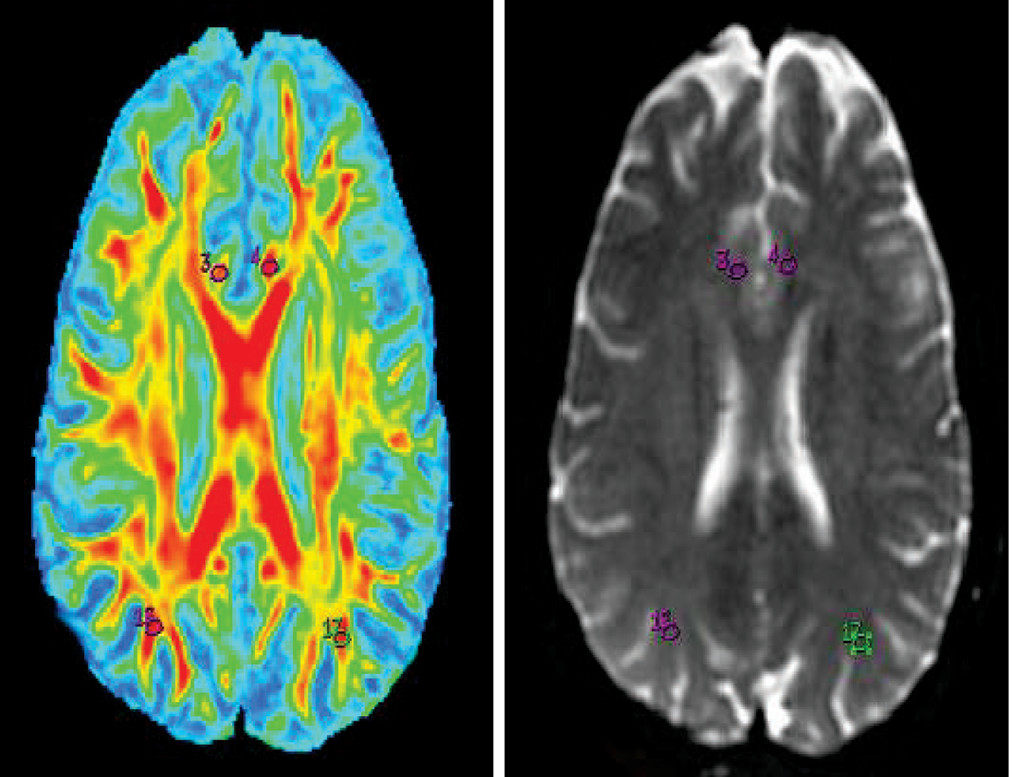
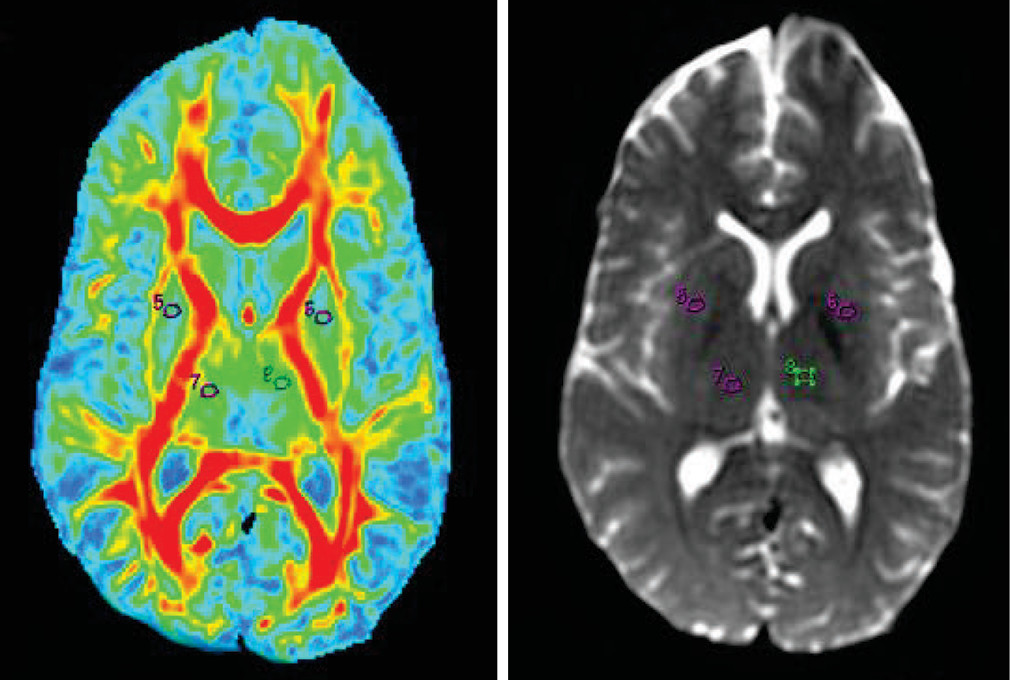
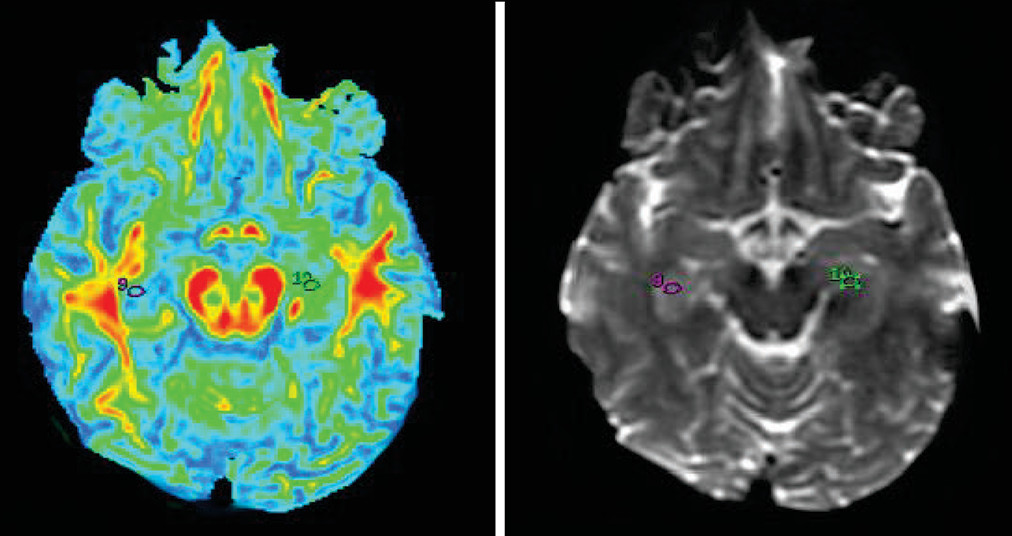
14–17 Oval ROIs were drawn by a neuroradiologist (with >10 years of experience), with a size of 26.4 mm
3 on b=0 maps. The same ROI was placed on the FA map by a neuroradiologist and verified by a senior radiologist (with >20 years of experience), as shown in
Figures 1–
5.The FA values in each ROI were measured by a single observer who was also a neuroradiologist. Each region was measured two times to obtain the highest FA values. Intraobserver reliabilities for DTI-measured values for different brain regions were assessed using intraclass coefficients.
VBAs
Diffusion tensor images were processed using FSL 4.1.9 (
www.fmrib.ox.ac.uk/fsl) installed on a Ubuntu 12.04 operating system (
www.ubuntu.com). The diffusion data set was prealigned for head motion and corrected for eddy currents. The brain extraction was then performed on the b=0 images to obtain the brain-extracted image and the binary brain mask. The FA images were obtained using the dtifit option from the FDT tool in FSL 4.1.9. The resulting FA images were processed to remove brain-edge artifacts and zero end slices in FSL 4.1.9. Nonlinear registration was then performed to align all of the FA data to the FMRIB58_FA template. These registrations were transformed into a 1×1×1 mm
3 standard space. The final output images were well aligned with the MNI152 image. Statistical analysis was then carried out using SPM8 (Wellcome Trust Centre for Neuroimaging,
www.fil.ion.ucl.ac.uk/spm/), running on MATLAB version 7.1 R2012a (MathWorks Inc., Natick, MA). The analysis was done using a two-sample t test between patients and controls. Voxels with a threshold of p<0.001 (uncorrected) with an extended threshold of 30 voxels were considered significant for statistical parametric mapping.
Statistical Analysis
Independent-samples t tests and chi-square tests were used to compare demographic data; Hamilton Depression Rating Scale scores for MDD patients and healthy controls were compared using SPSS 17.0 software. Two-sample t tests were performed in a voxel-by-voxel manner with SPM8. We tested the correlation between the FA values and Hamilton Depression Rating Scale scores using Spearman’s rho correlation.
Results
This study included 15 patients with MDD (mean age=30.14 years; age range=18–40 years) and 15 healthy controls (mean age=29.13 years; range=23–40). No significant differences were found between the study subjects (seven men and eight women) and healthy controls (six men and nine women) (p=0.71, chi-square statistics= 0.13).
The mean number of years of education was 13.13 for the MDD group and 15.27 for the healthy control group. The mean duration of illness was 10.4 months for the patient group, and the mean Hamilton Depression Rating Scale score was 19.47. There were no significant differences in age and education in the MDD group compared with the healthy controls. One patient and two controls whose gross MRI reports showed abnormalities in the form of calcification, hyperintensities, and ventricular dilatation were excluded from the study.
ROI analysis found that MDD patients exhibited lower FA values compared with healthy controls (
Table 1). The MDD group showed significantly lower FA values (p<0.05) in the following regions: left superior longitudinal fasciculus (p=0.04), right lentiform (p=0.03), right hippocampus (p=0.01), and left inferior parietal (p=0.001). Trends were shown in the left prefrontal cortex (p=0.10), left lentiform (p=0.05), and right cingulated cortex (p=0.08), although these were not significant. Intraclass correlation coefficients were as follows: right superior longitudinal fasciculus (0.96), left superior longitudinal fasciculus (0.96), right lentiform (0.97), left lentiform (0.99), right thalamus (0.96), left thalamus (0.99), right prefrontal (0.99), left prefrontal (0.99), fornix (0.99), right hippocampus (0.99), left hippocampus (0.99), right cingulate cortex (0.99), left cingulate cortex (0.99), genu (0.86), splenium (0.98), left inferior parietal region (0.99), and right inferior parietal region (0.944).
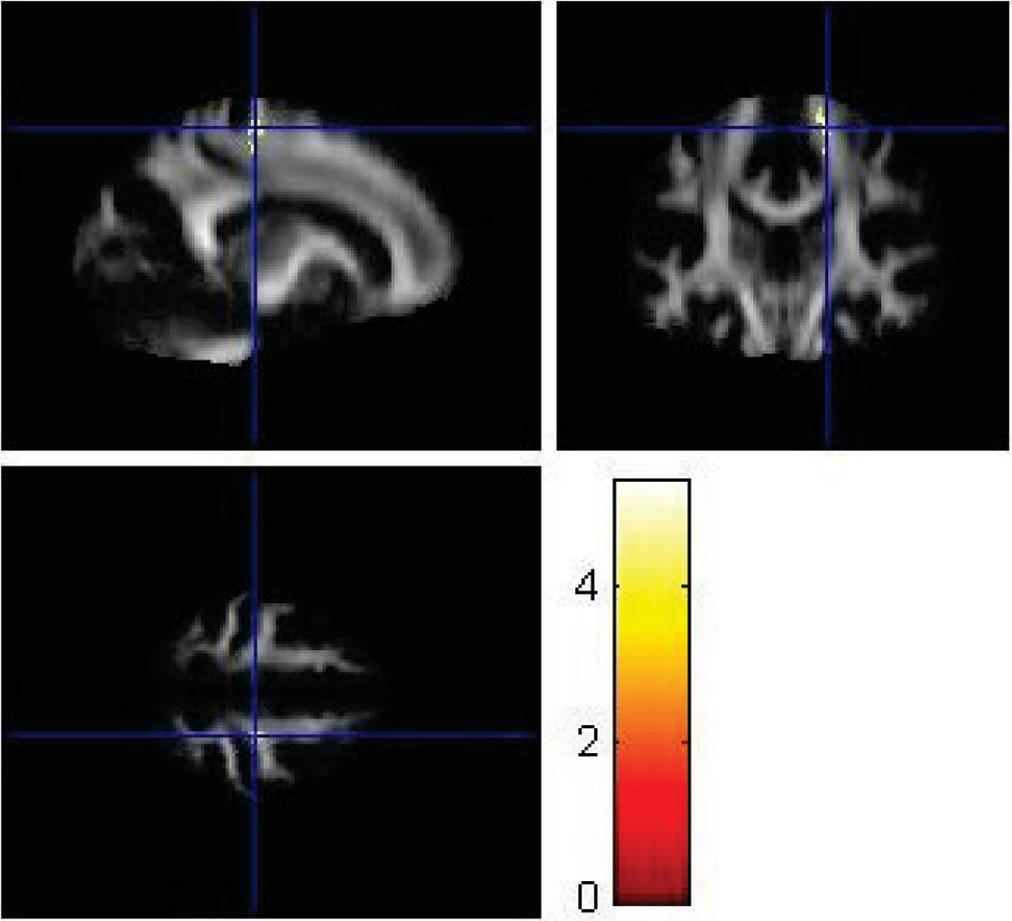
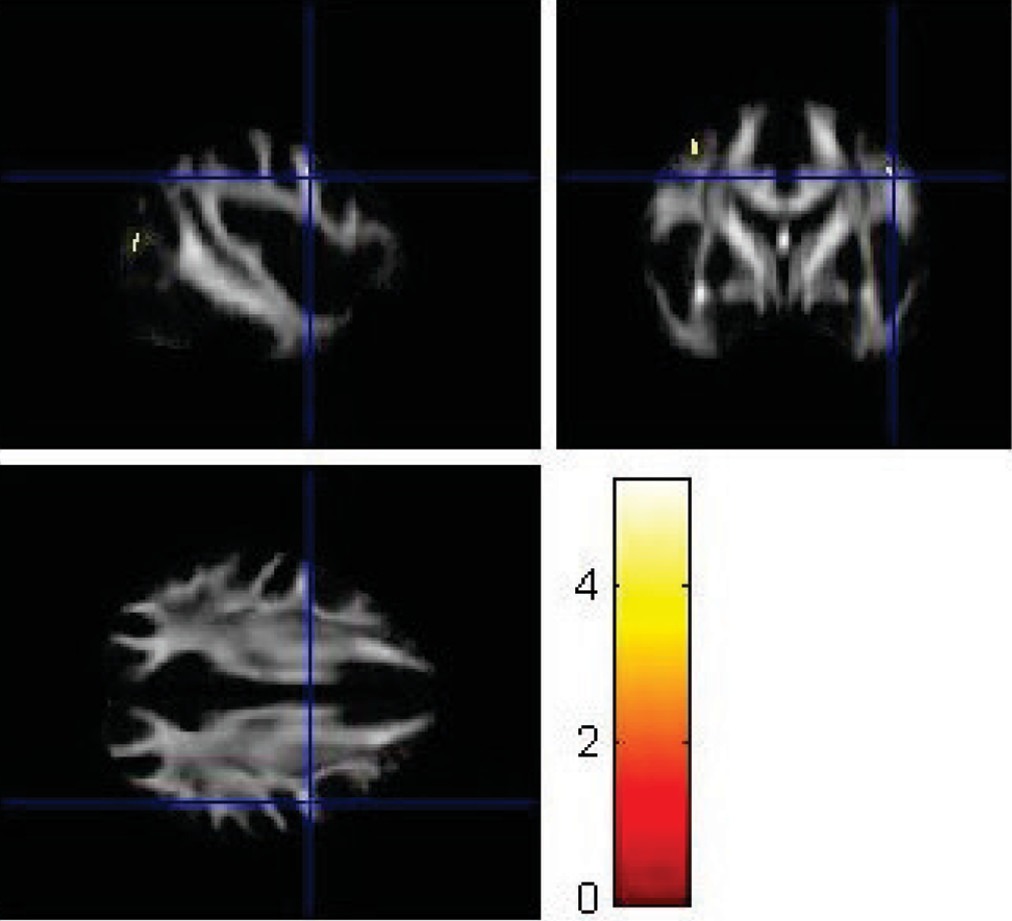
VBA using SPM8 replicated some findings of the ROI method. Using VBA, the MDD group showed significantly lower FA values (p<0.001) in the left superior longitudinal fasciculus (
Figure 6), left parieto-occipital region (
Figure 7), and left prefrontal cortex compared with healthy controls (
Figure 8). The corresponding MNI coordinates, cluster sizes, t scores, and z scores are shown in
Table 2.
There was no correlation between mean FA values and severity of depression as rated by Hamilton Depression Rating Scale scores in MDD patients using Spearman’s rho correlation.
Discussion
To our knowledge, this is the first preliminary study from India using both a manually curetted ROI method and VBA in a 3T MRI system to explore white matter abnormalities in first-episode, treatment-naïve MDD patients. Results from this pilot study indicate lower FA values in the left superior longitudinal fasciculus and left parieto-occipital region by both the ROI placement using FuncTool and VBA using SPM8 in treatment-naïve MDD patients compared with healthy controls. The left prefrontal cortex showed lowered FA in VBA, although this was not replicated by the ROI placement technique.
The findings of lowered FA values in the left superior longitudinal fasciculus by both VBA and ROI placement are strongly supported by previous studies by Cole et al.
18 and Zou et al.
19 However, contrasting findings of higher mean FA values were reported by Wang et al.,
10 who used tract-based spatial statistics in first-episode, treatment-naïve MDD patients.
Prefrontal cortex white matter abnormalities were reported in MDD patients in a recent study by Zuo et al.
20 The left parieto-occipital region demonstrated significantly lower FA values, consistent with a study by Wu et al.
21 in single-episode, treatment-naïve MDD patients. Trends toward significance were seen in the lowered FA values in the right cingulate cortex, although not for the fornix, using the ROI method in MDD patients compared with healthy controls. Korgaonkar et al.
22 highlighted the importance of significant alterations in FA values in the cingulated cortex and fornix as predictors of treatment remission in MDD, a finding partly supported by our work. A recent study by Guo et al.
23 did not find any correlation in mean FA values and depression severity scores, which is consistent with our findings.
Our study reported additional findings of significantly lower FA values in the right hippocampus by manually curetted ROI analysis in MDD patients compared with healthy controls. Previous research by Frodl et al.
24 and Malykhin et al.
25 reported that a reduction in the volume of the hippocampus was associated with MDD.
Although our sample size was small, both the VBA and the ROI methods were complementary in suggesting the involvement of different brain regions in the pathophysiology of depression. The subjects were not matched for gender, study years, and socioeconomic status; however, our results were still consistent with previous studies
26–30 suggesting the involvement of frontolimbic areas. In a recent study by Hayakawa et al.
31 in 810 community-dwelling adults, only female participants had lower FA values in white matter regions, including the anterior cingulum, which correlated with the epidemiologic depression scale score. Korgaonkar et al.
22 examined the treatment response to antidepressants in a mixed sample of 102 patients with MDD. In a recent meta-analysis of DTI studies in MDD, Liao et al.
27 also summarized results from 11 studies in a mixed sample, which was gender matched with controls, as was done in our study.
Because this study was cross sectional with a small sample size, our findings may not be generalizable to all populations. Further studies with increased sample sizes that include male and female patients (perhaps in a cohort setting) are needed.
The previously described methodology for ROI placements using FuncTool by Moon et al.
32 utilized the highest FA values. The highest FA values were noted in our study because the ROI markings of the subcortical areas measured were quite small and the signal-to-noise effect could be minimized. A limitation of our study was that correction for multiple comparisons for different brain regions was not carried out because it would have reduced the power of the study, given the small sample size. Previous studies, such as those by Ma et al.
33 and Li et al.,
9 also did not make these corrections because of the risk for type II error. However, our study was unique in carrying out DTI analysis of white matter abnormalities by both VBA and the manually drawn ROI method.
Our VBA results may not correspond with the results of ROI analysis, as was also reported in a previous study on schizophrenia by Giuliani et al.
34Conclusions
Our study and previous studies provide evidence that white matter microstructural changes are present in the white matter tract of the frontolimbic area. These changes result in some sort of disruption in the conduction pathways in cortical and subcortical areas and may have a role in the pathophysiology of depression in treatment-naïve patients. This is significant because it contributes to further understanding of MDD and may even become a marker for MDD patients by aiding in diagnosis and helping researchers develop therapeutics aimed at preventing such changes from occurring. This would help to considerably reduce morbidity due to MDD. Furthermore, both methods of analysis may complement each other in highlighting several areas in the brain showing disruption of white fiber tracts in MDD patients compared with healthy controls.
Acknowledgments
The authors thank Rajat Kumar (Department of Instrumentation and Control Engineering, Bharati Vidyapeeth College of Engineering, New Delhi, India).
