Delirium is a clinical syndrome characterized by an acute, fluctuating, and reversible change in awareness and cognition (
1,
2) occurring as a result of an underlying medical condition or a side effect of treatment. An independent predictor of mortality in critically ill children, delirium is associated with morbidity in survivors, including prolonged length of hospital stay (
3,
4). Research suggests that over 40,000 children (
5) in the United States are affected by delirium each year.
Despite research into the epidemiology and outcomes, very little is known about the underlying neurophysiology of pediatric delirium (
6). Since the 1940s, EEG’s high sensitivity and reliable change in response to clinical symptoms of delirium have been reported (
6–
8), with slowing of background activity (alpha) and increase in slow-wave activity (delta-theta) specifically noted. Techniques that precisely quantify EEG components (quantitative EEG), with comparison to routine EEG studies (
8), have been employed to investigate this association in studies relating EEG to clinical measures of delirium and cognition in the elderly (
6,
9,
10), postoperative patients (
11,
12), and those in the intensive care unit (ICU) (
13). Intriguingly, a recent study of posttraumatic confusional state in adults, which bears an overlap of symptoms with medical delirium (
14), found that a specific quantitative measure of EEG—higher posterior delta-to-alpha ratios (DAR) over the parietal occipital regions—was significantly associated with confusion severity and predictive of long-term cognitive dysfunction (
15). The underlying mechanism proposed for these regionally selective changes emphasized the high metabolic demand of the posterior medial complex (PMC) (
16), linking its functional role in organization of autobiographical information to confusional symptoms. Withdrawal of afferent excitatory input to the PMC is anticipated to result in broad disfacilitation of these neocortical neurons (
17), resulting in an elevation of low frequency power altering the alpha delta ratio. We hypothesized that the clinical symptoms of pediatric delirium would similarly relate to higher DAR, with a posterior dominance, and could be a reflection of cerebral dysfunction due to functional deafferentation. Our objectives in this pilot study were to characterize the relationship between the clinical diagnosis of delirium and its neurophysiologic EEG correlates among children to allow for subsequent prospective studies using EEG biomarkers for delirium diagnosis, response to treatment, and recovery.
Methods
This pilot study (with both retrospective and prospective data) was performed in a tertiary care urban academic medical center, where all children are screened prospectively for delirium throughout their stay using the Cornell Assessment of Pediatric Delirium (CAPD) (
18). Children are scored on the CAPD twice each day by a nurse; each CAPD reflects the child’s delirium status in the preceding 12 hours. This provides longitudinal data on delirium status throughout the pediatric ICU (PICU) stay. The CAPD score can range from 0–32. The operational definition of delirium for this study (consistent with the pediatric delirium literature) was a score of nine or higher on the CAPD.
This study took place in two phases. In phase 1, we reviewed the electronic medical records of all participants of a different 2014 study. These patients had been clinically diagnosed with delirium during their stay and had an EEG performed in the PICU over a 6-month period in 2014. For these data sets, we were restricted to segments of EEG that were pre-clipped because the entire record was not saved. We visually reviewed the EEG and video clips stored in the institutional EEG database to ensure at least 1 minute of eyes-closed continuous segments.
In phase 2, we prospectively enrolled patients who were admitted to the PICU over a 9-month period between July 2017 and March 2018. By prospectively gaining informed consent, we were able to capture the entire EEG record to select eyes-closed segments. Importantly, both phase 1 (retrospective) and phase 2 (prospective) data sets were treated similarly with regard to the EEG data analysis. Inclusion criteria were age 0–18 years, EEG performed for clinical purposes (or neurological monitoring in case of neurological symptoms), and parent or guardian available to provide informed consent.
Data extracted from the electronic medical record included patient demographic data (see Table S1 in the online supplement), admission diagnosis, and serial CAPD measurements. EEG data were recorded from 19 scalp electrodes placed individually according to the International 10–20 system using the Natus Xltek system (version 8.5, Natus, Middleton, Wisc.). The signals were sampled at either 512 (Connex headbox) or 1,024 (Epilepsy Monitoring Unit headbox) samples per second and filtered from DC to 100 Hz. As all EEGs were performed for clinical purposes, they were read by a consulting staff epileptologist within 24 hours of EEG completion. However, quantitative analyses did not occur until after the patient was discharged.
The 24-hour day was divided into six 4-hour blocks starting from 00:00 (or when EEG study began). For each 4-hour block, eyes-closed resting-state epochs were clipped after careful visual inspection by R.G., who was blinded to the patient’s diagnosis and clinical history. Spectral analyses were independently verified by both R.G. and S.S. (S.S. was also blinded to the patient’s diagnosis and clinical history). We relied on eyes-closed segments because of the paucity of consistent eyes-open segments within and across the cohort. Depth of sedation in each PICU patient is recorded hourly using the Richmond Agitation Sedation Scale (RASS). A score of −4 or −5 is consistent with deep sedation (
19). Time periods of sedation were excluded from clipping. EEG segments from periods of deep sedation and unknown cognitive status (i.e., if RASS scores were not recorded) were excluded from analyses. Each segment was further epoched into 3-second subsegments; subsegments with significant artifacts from line noise, eye blink, or muscle activity were visually identified and removed from further analysis. EEG signals were next converted to the Hjorth Laplacian montage to improve source localization (
20). Power spectral density for each channel was calculated using Thomson’s multitaper method (
21,
22), as implemented by mtspectrumc in the Chronux MatLab toolbox (MathWorks, Natick, Mass.) (
23,
24). Using one multitaper, a frequency resolution of 0.66 Hz (3-second segment) was obtained. Briefly, the power spectral density is a well-established method to derive the power present in the EEG signal at each frequency (
24).
To derive the DAR, the average difference of log spectral power within the frequencies of 1–4 Hz (delta) and 8–12 Hz (alpha) was obtained for each scalp channel. We chose a set alpha band to allow for standardization across the subjects. The averages of specific channels were then grouped as follows: global: F3, Fz, F4, C3, Cz, C4, P3, Pz, P4, O1, O2, T3, T4, T5, T6; occipital: O1, O2; parietal: P3, P4, Pz; temporal: T3, T4, T5, T6; and fronto-central: F3, F4, F7, F8, Fz, Fp1, Fp2, Fpz, C3, C4, Cz. We focused on the delta-alpha band power ratio to facilitate comparisons with existing literature. Spectral analysis of EEG was performed using the Chronux (
24) and EEGLab (
25) toolboxes and in-house software written in MatLab.
DARs were correlated with the real-time monitoring for delirium that took place using the CAPD scores. As the DAR could vary substantially within an individual over a 12-hour time period (but not all individuals had equally spaced multiple segments), and because our hypothesis was that high DAR would relate to delirium, we chose the maximum DAR within a 12-hour block (from 6 a.m. to 6 p.m. or 6 p.m. to 6 a.m.). These DAR values were paired with the CAPD score obtained at the end of the 12-hour period (6 p.m. or 6 a.m.); the linear relationship of DAR and CAPD values was then assessed using Pearson’s correlation coefficient. To account for within-patient correlation, linear mixed-effects models were constructed with a random intercept for each patient. The maximal DAR value was then compared between delirious and nondelirious time periods with independent two-sample t tests. This excluded periods of deep sedation and unknown cognitive status. Again, to account for within-patient correlation, logistic mixed-effects models were constructed with a random intercept for each patient. All analyses were performed for each localized brain region: frontal, parietal, occipital, temporal, and global. The above analyses were conducted for all subjects. We subsequently ran all analyses within phase 1 and phase 2 cohorts separately (see the online supplement). All p values were two-sided with statistical significance evaluated at the 0.05 alpha level.
Statistical analyses were performed in R version 3.5.3 (Vienna, Austria). The local institutional review board provided approval for this minimal risk observational study.
Results
Our sample comprised 23 children (61% male) who had an EEG performed for clinical purposes during their stay in the PICU. Our sample was distributed in age as follows: 43% (N=10): 0–2 years old, 17% (N=4): 2–5 years old, 26% (N=6): 5–13 years old, and 13% (N=3): 13–18 years old. The primary admitting diagnosis category was as follows: 74% (N=17): neurologic disorder, 17% (N=4): respiratory insufficiency/failure, 9% (N=2): cardiac condition. The neurological disorders in the study sample were heterogeneous (see Table S1 in the online supplement). The average PICU length of stay for patients was 10.7 (9.4) days. Thirty-nine percent (N=9) of patients were mechanically ventilated for at least 1 day during their EEG. All patients received at least one class of medication that could have affected their EEG: anticholinergics (N=19), antiepileptics (N=17), benzodiazepines (N=14), narcotics (N=10), steroids (N=9), dexmedetomidine (N=8), propofol (N=8), antipsychotics (N=4), vasopressors (N=4), and/or ketamine (N=3). There was a median of two CAPD assessments per patient. Seventy-three percent (N=17) of the patients had a delirium diagnosis at some point in their PICU stay. For a detailed breakdown of phase 1 and phase 2, see Table S1 in the online supplement.
The overall EEG session length was highly variable between patients, ranging from 8 hours to 8 days (mean duration in days 2.23 [SD=2.02]). As EEG was ordered at the discretion of the treating physician, the session length was dependent on clinician needs/recommendation. Seventy-two 12-hour EEG periods (across the 23 patients) with accompanying CAPD scores were assessed. Each period was divided into 4-hour blocks, resulting in anywhere from zero (some blocks were too noisy) to three eyes-closed resting-state epoch segments from each 4-hour block. These eyes-closed resting-state epochs ranged from 2 to 21 minutes. Clipped segments overall ranged from 1 minute to 30 minutes, with a median duration of 6 minutes. Of the 72 CAPD scores, 38 (53%) identified cases of delirious episodes, and the remaining episodes were identified as nondelirious.
Mean DARs in the 12-hour periods with diagnosed delirium were significantly higher than DARs in the 12-hour periods without delirium with a decrease in alpha and increase in delta wave activity; this was true across all brain regions. Mixed-effects logistic regressions showed that higher DARs in the parietal, occipital, and temporal regions resulted in greater odds of diagnosed delirium; however, confidence intervals were wide. Results for the frontal and global regions were marginally significant (p<0.10). (
Table 1). We repeated the analyses for each cohort separately; within both phase 1 and phase 2 cohorts (see the
online supplement), mean DARs in the 12-hour periods with diagnosed delirium were higher than DARs in the 12-hour periods without delirium; however, significance of these trends only existed within the phase 2 cohort (across all brain regions). Within each cohort, mixed-effects logistic regressions showed greater odds of diagnosed delirium with higher DARs across all brain regions, but these relationships were not significant (see Table S2 in the
online supplement).
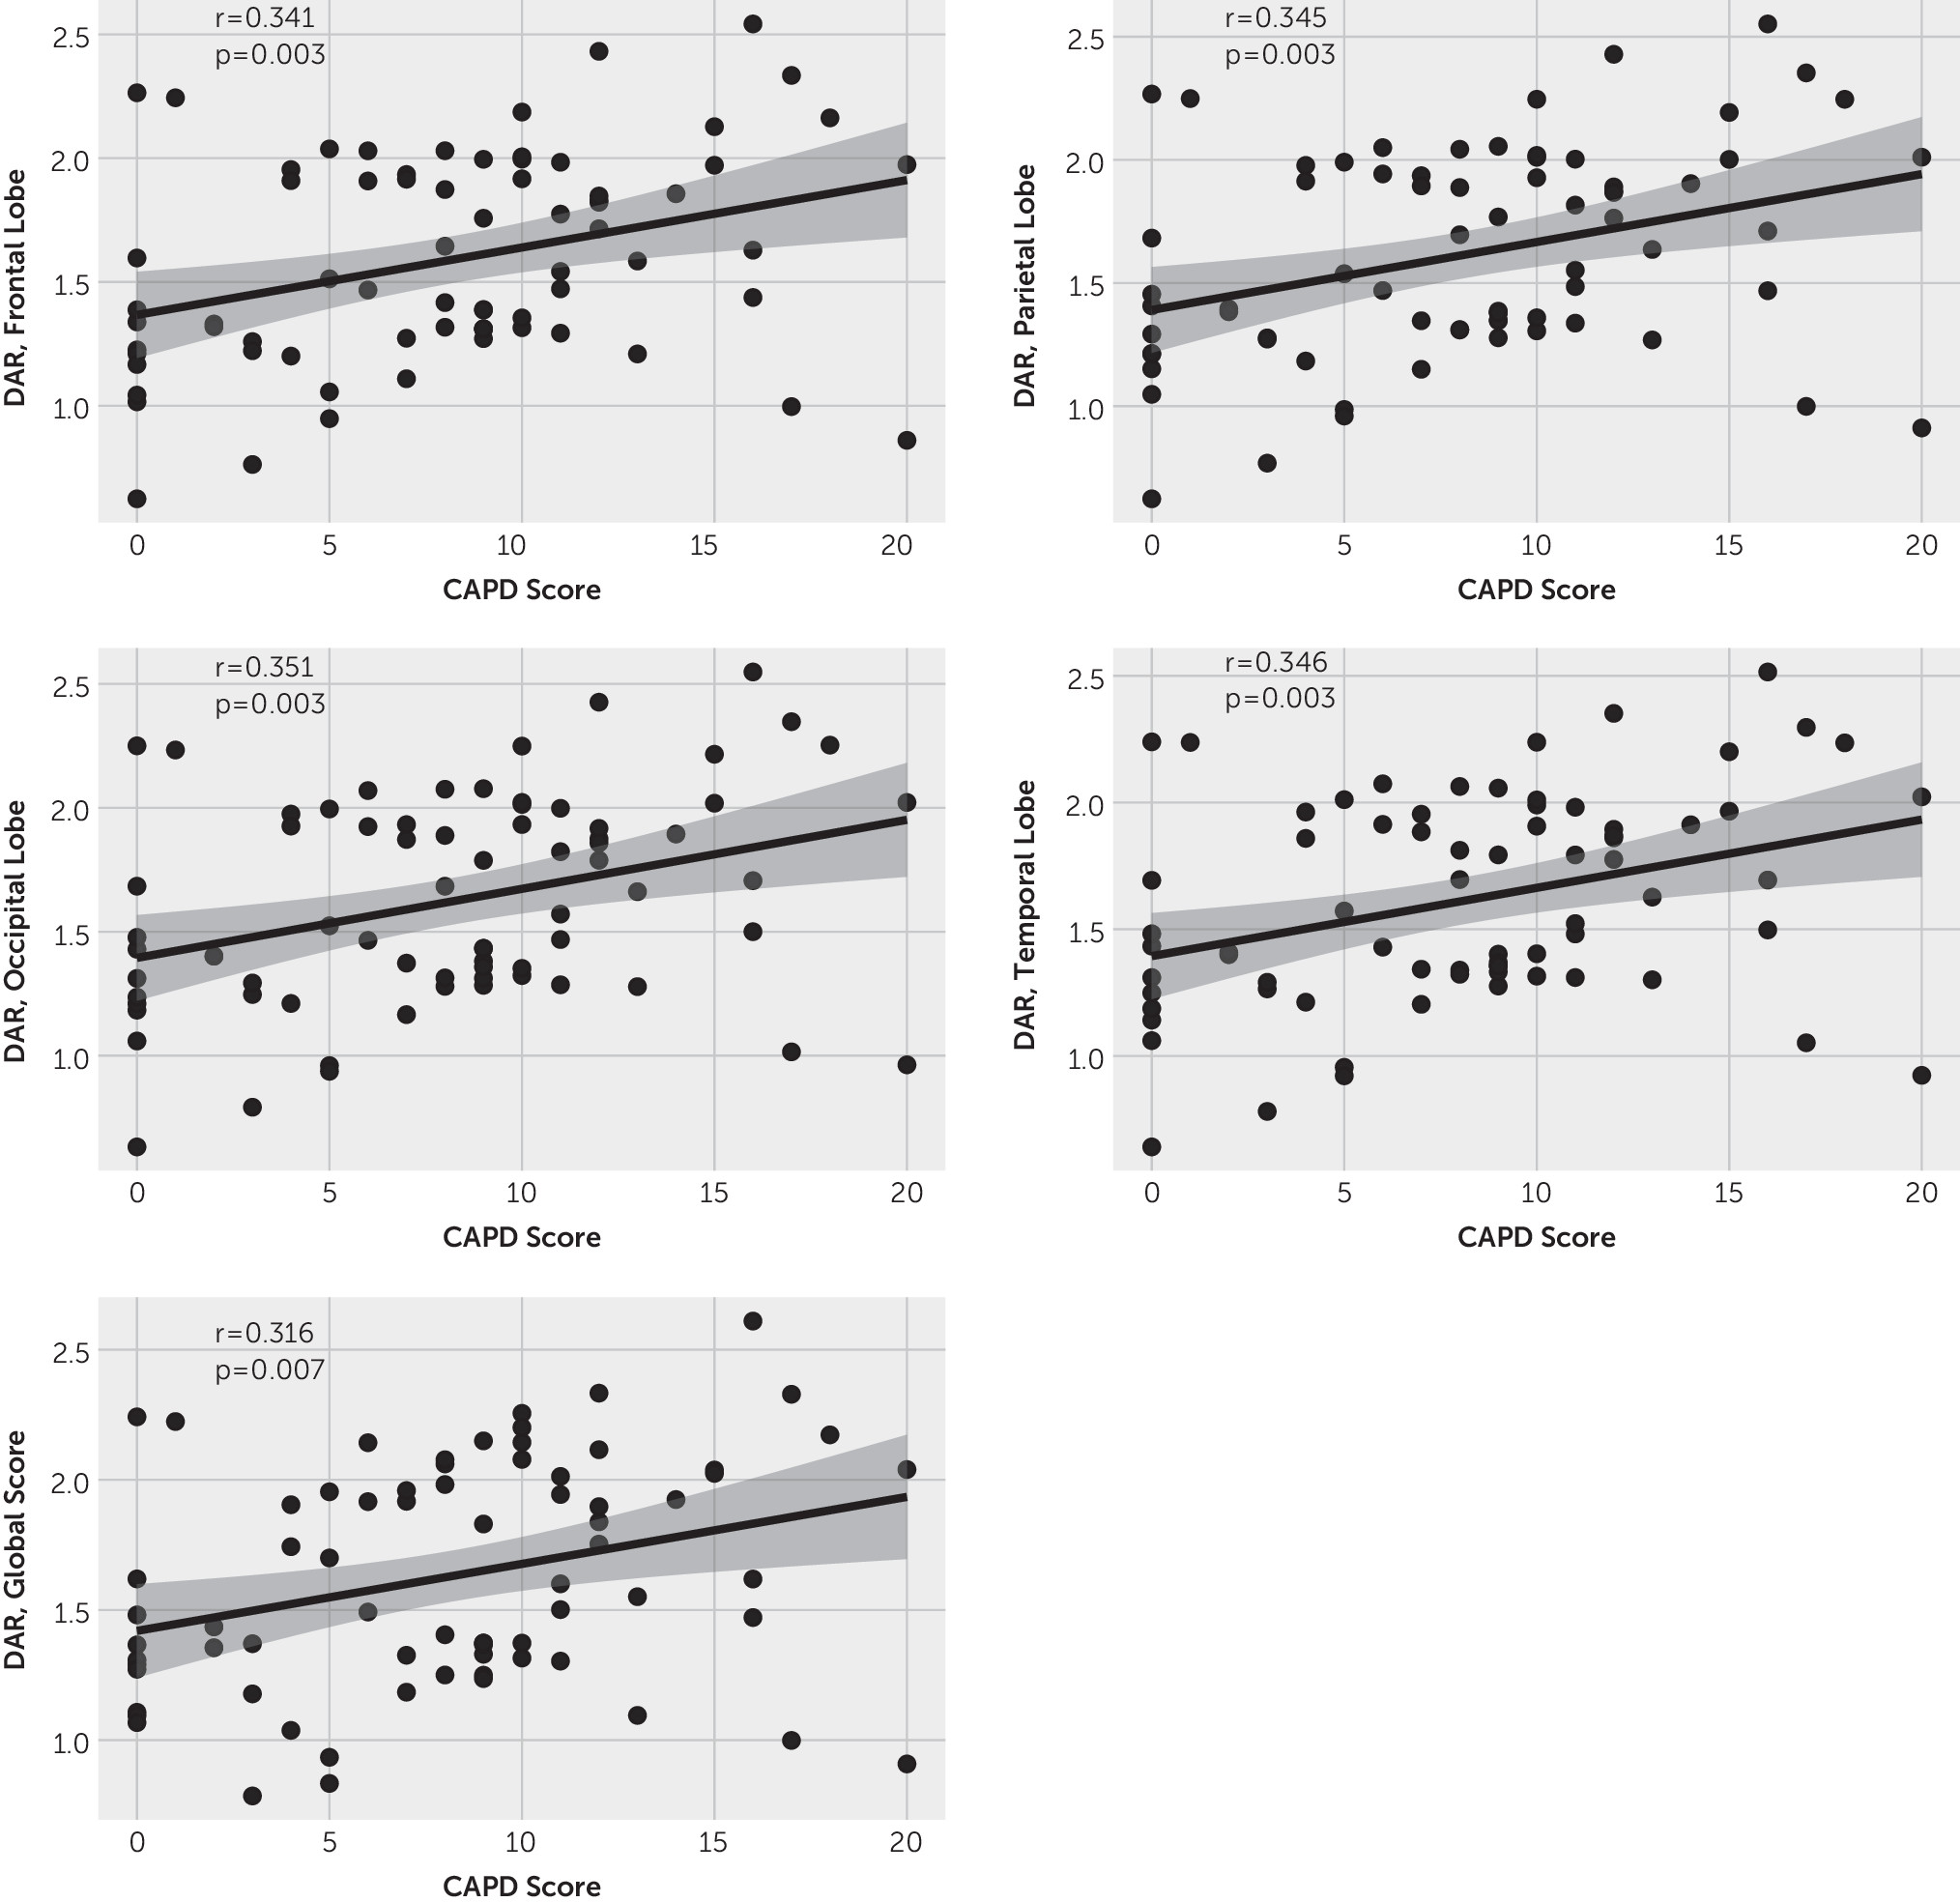
We also related DARs with the CAPD values (i.e., delirium scores) and noted a weak but positive correlation within each brain region, implying that the DAR may reflect delirium severity, with higher DARs trending with worsening delirium (
Figure 1). When accounting for within-subject correlation using linear mixed-effects modeling, there was a trend toward a positive relationship across all brain regions, although significance was not achieved (frontal: 2.33, p<0.2; parietal: 2.51, p<0.2; occipital: 2.65, p<0.1; temporal: 2.65, p<0.2; global: 1.79, p<0.3). In subsequent analyses, these results remained similar within the phase 2 cohort (see the
online supplement). Within the phase 1 cohort, no significant correlations were found between DAR and CAPD values (see Figure S1 in the
online supplement) and linear mixed-effects models demonstrated no significance.
Discussion
In this study, we have shown that an increased DAR is associated with delirium in critically ill children, which is consistent with results from other delirium studies of the adult population (
9,
15).
Delirium reflects acute brain dysregulation caused by serious medical illness. The etiology of delirium is typically multifactorial. One of the most compelling unifying hypotheses regarding delirium development in children involves the effect of systemic illness on central nervous system function (
26). The stress of critical illness, with associated inflammation, hypoxia, hypotension, and microthromboses, may lead to altered neuronal function, manifested in the behavioral symptoms used to diagnose delirium. EEG has long been employed to assess typical and atypical thalamocortical dynamics (
27). Our findings of increased delta and reduced alpha activity (increased DAR) can reflect either structural or functional deafferentation across corticocortical and thalamocortical connections. Increased delta activity has been correlated with alterations in the thalamus or mesencephalic reticular formation (
28), damage to cholinergic systems (
29,
30), or global white matter deafferentation (
28,
31,
32). It can also be generated through the functional downregulation of neocortical neurons (
17), as observed in the intact brain during microsleep intrusion within wakefulness (
33) or during general anesthesia (
34). Reduction of functional afferentation in the form of decreased excitatory neurotransmission results in disfacilitation (“neurons are hyperpolarized due to the temporal absence of excitatory synaptic activity”) of neurons producing delta activity, as seen in sleep (
35). Reduced alpha activity has been generally correlated with gray matter lesions (
31) and interpreted as evidence of reduced cortical excitability (
36).
A mix of structural and functional deafferentation, especially over the energy demanding posterior medial complex (
37), has been proposed to underlie posttraumatic confusional state, which shares clinical symptomology with delirium (
15). In the absence of structural deafferentation (e.g., following traumatic brain injury), an increased DAR can be conceptualized as a reflection of cerebral dysfunction caused by functional deafferentation across corticocortical and thalamocortical connections (
15), which might affect the functional activity of neurons and their firing activity.
Importantly, while our results hint at a possible posterior localization for the DAR findings, it has wide confidence limits. This lack of a significant localization of the DAR results to a specific scalp region, as has been shown before with the posterior regions (
15), may be due to the small heterogenous sample or could reflect a more generalized dysfunction in the pediatric brain. Our findings are thus hypothesis-generating and may provide direction for future research into the pathoetiology of pediatric delirium.
This study has some notable limitations. We used a convenience sample of patients who required EEG for clinical purposes, resulting in a relatively high representation of children with suspected neurologic issues (see Table S1 in the
online supplement). We included a sample comprising children chosen for delirium status (retrospective cohort), potentially limiting generalizability to the general PICU population. Although we see consistent trends within each specific cohort (phase 1 and phase 2), the small sample size hampered our statistical power. There was great heterogeneity in the duration and quality of the EEGs obtained as a result of differences in clinical recommendations. In addition (although this is one of the larger pediatric delirium studies using EEG), we are constrained by small sample size, limiting our power for statistical analyses, especially for relating findings to specific etiologies. There is also heterogeneity in age, cohorts, medications, and clinical status, possibly influencing the robustness of the results (
Figure 1). Additionally, in order to conduct quantitative EEG analyses, all analyses are conducted uniformly across the cohort without any subject specific considerations. Comparison of the disordered EEG patterns to a healthy pediatric population was also not possible in this pilot study. Ideally, a prospective study would enroll a homogeneous cohort of children at risk for delirium, obtain EEGs under controlled circumstances, and continue EEG recordings through resolution of delirium. Importantly, the issues identified in this study are not easily surmountable in an ICU population; therefore our results, despite the heterogeneity, are a positive step toward future studies.
Conclusions
In this pediatric cohort, a delirium diagnosis was accompanied by a higher mean DAR on EEG. Identification of an association between this generalizable EEG marker and delirious behavior provides an intriguing clue to the cerebral metabolic failure that may play a part in triggering pediatric delirium. Future studies will be needed to further elucidate the neurophysiological dysfunction underlying delirium in order to facilitate design of therapeutic interventions, and track response to treatment.
Acknowledgments
Supported by the NIH National Center for Advancing Translational Science (award UL1TR002384) and the Clinical Translational Science Center at Weill Cornell Medical College (grant UL1-TR000457-06).
The authors thank Batsheva Gutwirth for her help enrolling patients in this study. Her untimely death is mourned by all who knew her, and her commitment to her patients will forever be remembered.


