Abstract

Objective

Valid quality indicators are needed to monitor and encourage identification and management of mental health and substance use conditions (behavioral conditions). Because behavioral conditions are frequently underidentified, quality indicators often evaluate the proportion of patients who screen positive for a condition who also have appropriate follow-up care documented. However, these “positive-screen–based” quality indicators of follow-up for behavioral conditions could be biased by differences in the denominator due to differential screening quality (“denominator bias”) and could reward identification of fewer patients with the behavioral conditions of interest. This study evaluated denominator bias in the performance of Veterans Health Administration (VHA) networks on a quality indicator of follow-up for alcohol misuse that used the number of patients with positive alcohol screens as the denominator.

Methods

Two quality indicators of follow-up for alcohol misuse—a positive-screen–based quality indicator and a population-based quality indicator—were compared among 21 VHA networks by review of 219,119 medical records.

Results

Results for the two quality indicators were inconsistent. For example, two networks performed similarly on the quality indicators (64.7% and 65.4% follow-up) even though one network identified and documented follow-up for almost twice as many patients (5,411 and 2,899 per 100,000 eligible, respectively). Networks that performed better on the positive-screen–based quality indicator identified fewer patients with alcohol misuse than networks that performed better on the population-based quality indicator (mean 4.1% versus 7.4%, respectively).

Conclusions

A positive-screen–based quality indicator of follow-up for alcohol misuse preferentially rewarded networks that identified fewer patients with alcohol misuse.
Over a quarter of the U.S. population has a mental health or a substance use condition (“behavioral condition”) (1), but these conditions often remain unrecognized and untreated (25). Identifying and offering evidence-based care to patients with behavioral conditions is therefore a major quality improvement priority for U.S. health care (2,6).
Improving the quality of behavioral health care requires valid quality indicators to measure and encourage identification and evidence-based follow-up of common behavioral conditions (2,610). One commonly used approach to measuring and improving the quality of behavioral care is to evaluate follow-up care provided to patients who screen positive on validated questionnaires (9,11,12). We refer to these types of quality indicators of follow-up for behavioral conditions as “positive-screen–based” quality indicators.
One theoretic limitation of positive-screen–based quality indicators is that they might preferentially reward systems that identify fewer patients through screening. Table 1 shows how bias due to variation in the sensitivity of screening programs across health systems could undermine the validity of positive-screen–based quality indicators. Three hypothetical systems (A–C) with identical patient populations and identical true prevalence rates of a behavioral condition are modeled. Compared with systems B and C, system A has a more sensitive screening program, resulting in a twofold higher prevalence of positive screens (10% versus 5%). Therefore, although systems A and B have identical performance on a positive-screen–based quality indicator (50% of patients with positive screens have appropriate follow-up), system A identifies and offers follow-up to twice as many patients with the condition (5,000 versus 2,500). Comparison of systems A and C demonstrates how A, with a more sensitive screening program, could perform worse on a positive-screen–based quality indicator (50% versus 80%) despite identifying and offering follow-up care to more patients with the condition (5,000 versus 4,000).
Table 1 Example of denominator bias in quality indicators of follow-up care for a behavioral condition among three hypothetical health systemsa
  Behavioral conditionFollow-up for patients screening positive
Health systemPatientsN of patientsaScreening prevalence (%)aN with positive screenaOffered follow-up (%)bN of patientsAs proportion of patients in the health system (%)c
A100,00013,0001010,000505,0005.0
B100,00013,00055,000502,5002.5
C100,00013,00055,000804,0004.0
a
Assumes three identical health care systems, each with 100,000 identical patients, 13% of whom have a behavioral condition, and variable prevalence of positive screens (“screening prevalence”; 5% and 10%) and variable proportions of patients with appropriate follow-up (50% and 80%) among those with positive screens.
b
The proportion of patients with positive screens who are offered appropriate follow-up: “positive-screen-based” quality indicator
c
The proportion of all patients in a health care system who are offered appropriate follow-up: “population-based” quality indicator
One strategy to improve the validity of positive-screen–based quality indicators and avoid bias due to differing denominators (“denominator bias”) is to require use of a specific validated screening questionnaire and threshold to standardize the denominator (13). This strategy is used by the Veterans Health Administration (VHA) for alcohol misuse as well as for depression and posttraumatic stress disorder (PTSD) (11,14). However, recent research has demonstrated that despite use of a uniform screening questionnaire and threshold for a positive screen, the sensitivity of alcohol screening programs may vary across VHA networks (15), likely because of differences in how screening is implemented in practice, such as with nonverbatim interviews versus with questionnaires completed on paper (16). Variation in the sensitivity of screening programs could undermine the validity of positive-screen–based quality indicators, but this has not been previously evaluated.
This study used VHA quality improvement data to determine whether variability in the prevalence of positive screens for alcohol misuse undermined the validity of a positive-screen–based quality indicator of follow-up for alcohol misuse (that is, with denominator bias). If denominator bias existed in the VHA despite high rates of screening with a uniform screening questionnaire and threshold, it would suggest that positive-screen–based quality indicators might unintentionally systematically reward health systems that identified fewer patients with alcohol misuse due to poorer-quality alcohol-screening programs. If this were true, positive-screen–based quality indicators for other behavioral conditions would need to be similarly evaluated.

Methods

Overview

Two quality indicators of follow-up for alcohol misuse were evaluated in a sample of patients from each VHA network. Both quality indicators were based on the same medical record reviews. The numerators of the two quality indicators were the same, but the denominators differed. The numerator was all patients in each network who screened positive for alcohol misuse and had documentation of follow-up for alcohol misuse in their medical records. The denominator of the positive-screen–based quality indicator included all patients who screened positive for alcohol misuse on VHA’s specified screen in a VHA clinic. The denominator of the population-based quality indicator included all outpatients eligible for screening. First, each VHA network was evaluated and its performance ranked on the two quality indicators. Second, convergent validity of the two quality indicators was assessed by calculating the difference in each network’s ranks on the two indicators. Third, denominator bias was evaluated by testing whether differences in rank were associated with the network prevalence of documented positive alcohol screens. This study received approval and waivers of informed consent and HIPAA authorization from the VA Puget Sound Health Care System Institutional Review Board.

Data sources and sample

The external peer review program (EPRP) of the VHA Office of Analytics and Business Intelligence (OABI) conducts monthly standardized manual medical record reviews of stratified random samples of VHA outpatients at all 139 facilities of the 21 VHA networks. EPRP has assessed follow-up for alcohol misuse since 2006 (11), and EPRP data have high reliability (17).
This study’s sample included outpatients eligible for alcohol screening whose records were reviewed by EPRP from October 2007 (when follow-up for alcohol misuse was first required) through March 2010. Patients seen in VHA clinics, including primary care and specialty medical, surgical, and mental health clinics, were eligible for screening except for a small proportion (.003%) with cognitive impairment or receiving hospice care (18). Each network is estimated to have provided care for 134,000–458,000 patients in 2008–2009. Because EPRP reviewed far fewer records (N=219,119 medical records), this study used data from 30 months to provide adequate sample sizes for network-level analyses (the level of accountability for VHA performance measures) (11).

Measures

Alcohol screening from EPRP medical record reviews.

Since 2006, use of the Alcohol Use Disorders Identification Test–Consumption (AUDIT-C), a validated screening questionnaire (18), has been required for annual screening for alcohol misuse among VHA patients (19). However, networks use variable approaches to implement AUDIT-C screening (such as in-person interviews or paper questionnaires), which may account for differences in the quality of screening across networks (15). AUDIT-C scores ≥5 were considered positive screens, consistent with the VHA’s quality indicator for follow-up for alcohol misuse (11).

Follow-up for alcohol misuse from EPRP medical record reviews.

Patients who screened positive for alcohol misuse were considered to have been offered appropriate follow-up for the purposes of this study if EPRP abstractors found any documented alcohol-related advice or feedback, referral to addiction treatment, or discussion of referral within 30 days after a positive alcohol screen (11).

Covariates.

Patients’ age, gender, and race were obtained from VHA’s National Patient Care databases. An independent facility-level survey measure of the prevalence of alcohol misuse (AUDIT-C score ≥5) was estimated from patient surveys based on the state where each facility was located. The source of the patient surveys was the VHA’s Survey of Healthcare Experiences of Patients (SHEP) for fiscal years 2007–2008 (20). The SHEP was mailed monthly by OABI to a random sample of established outpatients who had made a recent visit (N=1,228–30,605 patients per state; response rate 54.5%).

Analyses

Descriptive network statistics.

For each network, EPRP medical record review data were used to estimate the proportion of patients with documented screening for alcohol misuse and the proportion of screened patients with positive screens (“screening prevalence of alcohol misuse”).

Network performance on the two quality indicators.

Two quality indicators were calculated for each VHA network with patient-level data from medical record reviews. The definition of a network’s positive-screen–based quality indicator of follow-up for alcohol misuse was the number of patients with positive alcohol screens and appropriate follow-up documented in their medical records divided by all patients in the network with positive alcohol screens.
A population-based quality indicator of follow-up for alcohol misuse was selected as the comparator for the positive-screen–based quality indicator because a population-based measure is not biased by the definition of its denominator or by how screening is implemented clinically. The definition of a network’s population-based quality indicator of follow-up for alcohol misuse was the number of patients with positive alcohol screens and appropriate follow-up documented in their medical records divided by all patients in the network who were eligible for alcohol screening.
Both quality indicators were expressed as percentages; the population-based quality indicator was also expressed as the number of patients who had alcohol misuse identified and appropriate follow-up documented in the medical record per 100,000 eligible, to reflect the clinical implications of observed differences. Each network’s relative performance (rank) on each quality indicator was then determined (10), with 1 indicating best performance.

Assessment of convergent validity.

Each network’s difference in ranks on the two measures was calculated. In the absence of gold standards for quality indicators, convergent validity provides one indication of validity (21).

Assessment of denominator bias.

To evaluate whether networks that performed better on the positive-screen–based quality indicator were potentially biased by a lower screening prevalence of alcohol misuse documented in the medical record, networks were divided into six groups based on each network’s difference in ranks on the two unadjusted quality indicators. Logistic regression was then used to estimate the adjusted screening prevalence of alcohol misuse across the six groups. Estimates were adjusted for demographic characteristics and the independent survey measure of alcohol misuse at each facility so that differences in the documented prevalence of positive alcohol screens across networks would not be biased by differences in patient demographic characteristics or differences in regional drinking patterns. Differences across groups were tested with postestimation Wald tests.

Sensitivity analyses: adjusted quality indicators.

Main analyses used unadjusted quality indicators (22). Because differences in network performance on the quality indicators could reflect differences in demographic characteristics (2326) or differences in the true prevalence of alcohol misuse across networks, sensitivity analyses adjusted the two quality indicators for demographic characteristics and the independent facility-level survey measure of the prevalence of alcohol misuse, to determine if adjustment meaningfully altered findings.
Analyses were conducted in Stata 11 (27).

Results

Network screening characteristics

Rates of documented alcohol screening with the AUDIT-C were high (95.9%−98.7% of eligible outpatients across networks). The screening prevalence of alcohol misuse varied twofold (4.6%−9.3%) (Table 2). [Details about alcohol screening, including AUDIT-C screening prevalence, are provided online in appendix A of the data supplement to this article.]
Table 2 Variation in the screening prevalence of alcohol misuse and follow-up for alcohol misuse based on two types of quality indicators across the 21 VHA networks
   Quality indicator of follow-up for alcohol misuse
 Screening prevalence of alcohol misuseaPositive screen basedbPopulation basedc
Networkd%95% CI%95% CI%95% CIN per 100,000 screened
C4.64.1–5.064.759.7–69.72.92.5–3.32,899
S4.84.2–5.363.056.9–69.22.92.5–3.42,940
B4.94.5–5.270.867.2–74.33.43.1–3.73,390
G5.55.0–5.954.250.0–58.32.92.5–3.22,863
L5.55.1–5.949.645.9–53.42.72.4–2.92,654
P6.05.6–6.456.753.4–59.93.33.0–3.63,311
U6.56.1–6.959.055.6–62.43.83.4–4.13,774
M6.66.2–7.063.260.1–66.34.13.8–4.54,123
I6.86.2–7.351.647.6–55.53.43.0–3.73,362
O6.96.4–7.453.349.5–57.03.63.3–4.03,614
N7.06.4–7.765.761.2–70.14.54.0–5.04,528
F7.16.6–7.662.559.0–65.94.33.9–4.74,329
T7.26.7–7.748.344.7–51.93.43.0–3.73,354
J7.36.8–7.855.351.9–58.64.03.6–4.33,981
K7.46.9–8.058.154.3–62.04.23.8–4.64,195
H7.56.9–8.069.565.8–73.25.14.6–5.65,104
E7.87.3–8.355.552.2–58.84.23.9–4.64,222
A7.97.3–8.446.342.7–49.93.63.2–3.93,562
R8.47.8–9.065.461.7–69.05.44.9–5.95,411
D9.18.6–9.648.445.3–51.44.33.9–4.74,299
Q9.38.8–9.954.851.7–57.95.04.6–5.45,033
a
The proportion of patients who screened positive (≥5 points) for alcohol misuse on the Alcohol Use Disorders Identification Test–Consumption (AUDIT-C) questionnaire based on Veterans Health Administration (VHA) external peer review program (EPRP) medical record reviews
b
The proportion of patients who screen positive for alcohol misuse (AUDIT-C score ≥5) who had documented follow-up according to EPRP medical record reviews
c
The proportion and number per 100,000 of patients eligible for screening who had alcohol misuse identified (AUDIT-C score ≥5) and follow-up documented according to EPRP medical record reviews
d
Networks are labeled A–U in nonalphabetic order consistent with a previous report (15) and are ordered on the basis of the prevalence of positive screens for alcohol misuse.

Network performance on the two quality indicators

The positive-screen–based quality indicator of follow-up for alcohol misuse demonstrated marked variability across the networks: 46.3%−70.8% of patients who screened positive for alcohol misuse had appropriate follow-up documented in their medical records. The population-based quality indicator demonstrated that 2.7%−5.4% of patients eligible for screening had alcohol misuse identified and appropriate follow-up documented in their medical records (Table 2).

Convergent validity of the two quality indicators

Network performance on the two quality indicators was often inconsistent. For example, networks A and B had markedly different performance on the positive-screen–based quality indicator (46.3% and 70.8%, respectively) but identified and documented follow-up for alcohol misuse in similar proportions of patients: 3.6% and 3.4%, respectively, on the population-based quality indicator (Table 2). Conversely, networks G, P, J, E, and Q had similar performance on the positive-screen–based quality indicator (54.2%−56.7%), but very different performance on the population-based quality indicator (2.9%−5.0%). Networks C, N, and R also had similar positive-screen–based quality indicators (64.7%−65.7%) despite having population-based quality indicators that ranged from 2.9% to 5.4%. Furthermore, these inconsistencies translated into large differences in the absolute number of patients with alcohol misuse identified and appropriately managed. For example, networks C and R, with similar performance on the positive-screen–based quality indicator, differed by 2,512 patients for whom alcohol misuse was identified and follow-up offered (2,899 versus 5,411) per 100,000 eligible for screening.
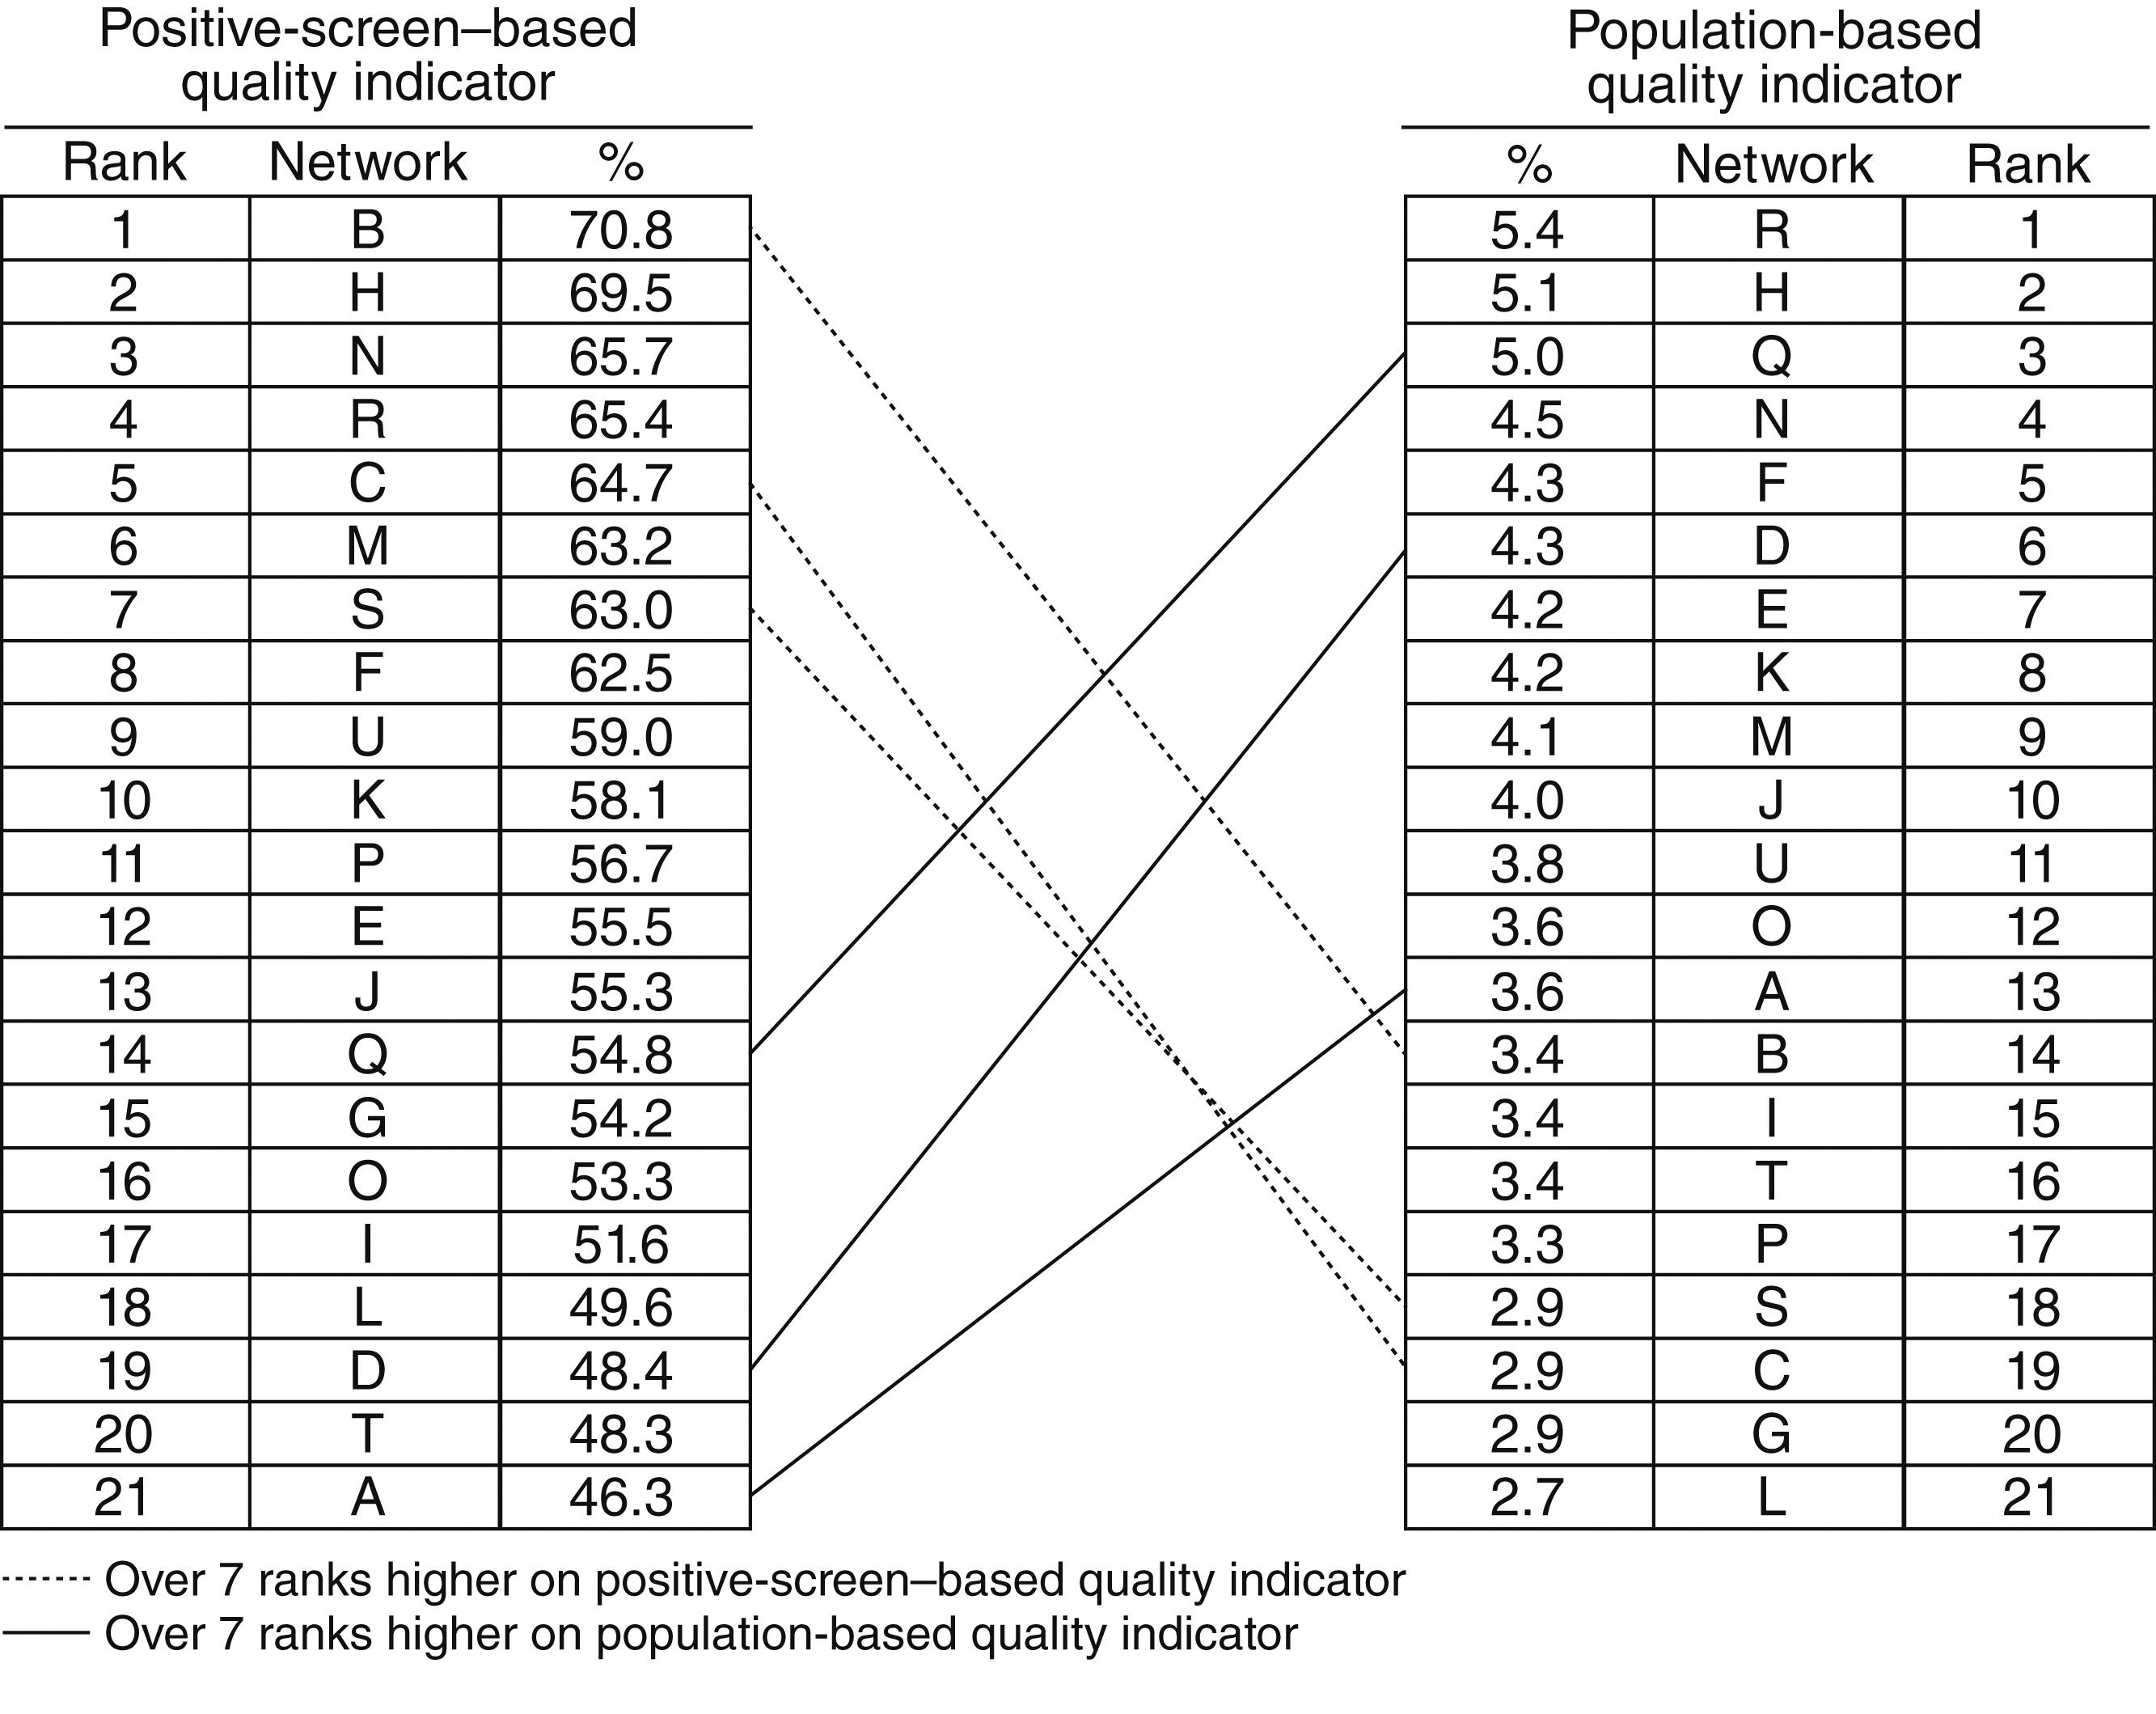
Differences in each network’s ranks on the two quality indicators ranged from 14 to −13 (Figure 1). Six of the 21 networks differed by more than seven ranks (lines between indicators in Figure 1).
Figure 1 Comparison of VHA network ranks on two quality indicators of follow-up for alcohol misusea
aLower-numbered ranks reflect higher Veterans Health Administration (VHA) network performance, with 1 indicating the highest performance.

Assessment of denominator bias

The mean adjusted screening prevalence of alcohol misuse based on medical record reviews differed significantly across the six groups of networks based on differences in ranks on the two (unadjusted) quality indicators (Table 3). Networks that ranked more than seven ranks higher on the positive-screen–based quality indicator had a lower screening prevalence of alcohol misuse compared with networks that ranked more than seven ranks higher on the population-based quality indicator (4.1% versus 7.4%) (Table 3).
Table 3 Association between differences in VHA network rank on two quality indicators of follow-up for alcohol misuse and the adjusted screening prevalence of alcohol misuse
 Perform better on positive-screen–based quality indicator (←)Perform better on population-based quality indicator (→)
Item14 to 11 ranksa6 to 5 ranksa3 to 0 ranksa–2 to –3 ranksa–4 to –5 ranksa–8 to –13 ranksa
Mean screening prevalence of alcohol misuse (%)b4.14.85.46.15.97.4
95% CI3.6–4.54.4–5.25.0–5.85.5–6.75.3–6.56.8–8.1
NetworksB, C, SP, GH, L, M, N, UF, I, J, K, RE, O, TA, D, Q
a
Difference in Veterans Health Administration (VHA) network ranks on unadjusted quality indicator of follow-up for alcohol misuse. Positive values of differences in rank indicate higher performance on the positive-screen–based quality indicator; negative values indicate higher performance on the population-based quality indicator.
b
Proportion of patients who screened positive (≥5 points) for alcohol misuse on the Alcohol Use Disorders Identification Test–Consumption questionnaire based on medical record reviews and adjusted for age, gender, race, and an independent survey measure of the facility prevalence of alcohol misuse.

Sensitivity analyses

Adjustment of the two quality indicators did not meaningfully change any findings. [Details are provided in the online data supplement in appendices B–D.]

Discussion

This study demonstrated important limitations of quality indicators of follow-up care for alcohol misuse that use the number of patients with positive alcohol screens as the denominator. One limitation is that network performance on the positive-screen–based quality indicator did not reflect the proportion of patients who had alcohol misuse identified and appropriate follow-up documented. Moreover, the magnitude of the observed inconsistencies was clinically meaningful. For example, two networks performed almost identically on the positive-screen–based quality indicator (64.7% and 65.4%) even though one identified and offered appropriate follow-up for alcohol misuse to almost twice as many patients (5,411 versus 2,899) per 100,000 eligible for screening. Given that some VHA networks screen more than 450,000 patients a year, two networks with comparable sizes and performance on a positive-screen–based quality indicator could differ by more than 11,000 patients identified and offered care for alcohol misuse each year. Moreover, results suggest that the positive-screen–based quality indicator was biased by insensitive screening programs: the better that networks performed on the positive-screen–based quality indicator compared with the population-based quality indicator, the lower their screening prevalence of alcohol misuse (that is, the less likely they were to identify alcohol misuse by screening).
Alcohol screening and brief counseling interventions have been deemed the third highest prevention priority for U.S. adults (28,29) among practices recommended by the U.S. Preventive Services Task Force (30). Positive-screen–based quality indicators of follow-up for alcohol misuse have been put forth by the Joint Commission (JC) (9), as well as by the National Business Coalition on Health (NBCH) to increase alcohol screening and follow-up (12). Our results demonstrate potential problems with these quality indicators. In addition, whereas the VHA has required use of a common alcohol screening questionnaire and threshold to standardize the denominator of its positive-screen–based quality indicator, JC and NBCH have not specified standard alcohol screening questionnaires or thresholds (9,12). Allowing health care systems to use different screens will likely result in even greater variability in the prevalence of positive screens for alcohol misuse, which could further bias positive-screen–based quality indicators (2326).
These findings also call into question other quality indicators for behavioral health care. Positive-screen–based quality indicators are increasingly used for depression and other behavioral conditions (31,32). These measures, developed from clinical guidelines and expert opinion (13), are often paired with measures to encourage behavioral screening because underidentification is one of the greatest barriers to high-quality behavioral health care (2). However, no previous study to our knowledge has evaluated whether positive-screen–based quality indicators for follow-up on behavioral conditions preferentially reward health systems that identify fewer patients with the condition of interest, despite known limitations of other quality indicators based on clinical guidelines (3335). Furthermore, this bias could affect “diagnosis-based” behavioral quality indicators that use the number of patients with diagnosed behavioral conditions as the denominator (35), such as the Healthcare Effectiveness Data and Information Set alcohol or other drug measures used by the National Committee for Quality Assurance (NCQA) (36).
This study suggests that alternatives to positive-screen–based quality indicators for behavioral health conditions are needed. The American Medical Association Physician Consortium for Performance Improvement has proposed a population-based quality indicator, similar to that used in this study (37), which encourages identification as well as appropriate follow-up of alcohol misuse. However, population-based quality indicators can seem counterintuitive to clinicians because follow-up is evaluated for all patients regardless of their need (that is, among patients with positive or negative screens). Further, population-based quality indicators could be biased because of differences in clinical samples. Therefore, although adjustment did not meaningfully change results in this study, population-based quality indicators may need to be case-mix adjusted. Moreover, all measures that rely on provider documentation for the numerator could be biased by electronic medical records that encourage identical documentation of follow-up regardless of care provided.
Patient report of appropriate care for alcohol misuse on surveys that include standardized alcohol screening is likely to be the optimal quality indicator for follow-up of alcohol misuse (38). Mailed patient surveys are used to assess smoking cessation counseling, and Medicare is planning to use surveys to assess other preventive counseling (39). Alcohol-related advice is a key component of evidence-based brief alcohol counseling (40), and the VHA has screened for alcohol misuse and measured receipt of alcohol-related advice on patient surveys since 2004 (41). This survey administers the AUDIT-C in a standard fashion and then asks about alcohol-related advice. Standardized screening on a mailed survey avoids differences in screening methods across systems, and patient survey measures are not biased by variability in provider documentation (38).
This study had several limitations. First, both quality indicators relied on medical record reviews of clinical documentation of appropriate follow-up; there was no external gold standard for alcohol-related discussions. The quality of documented alcohol-related discussions is unknown, especially when documentation of follow-up is rewarded, as in the VHA since 2007 (11). In addition, this study compared performance at the network level and used data from a 30-month period to improve the precision of estimates (42), obscuring possible variability across facilities and time. Further research is needed to explore other factors that bias quality measurement, particularly the severity of identified alcohol misuse and the prevalence of identified alcohol use disorders (2326). Finally, the generalizability of these findings from the VHA to other health systems is unknown. However, other health systems are increasingly implementing screening with the AUDIT-C (11,13,18,41,4346), and incentives for electronic health records (4750) and Medicare reimbursement for annual alcohol screening (51) will likely increase implementation and monitoring of alcohol screening and follow-up.
Nevertheless, these findings regarding first-generation quality indicators of follow-up care for alcohol misuse can inform development of evidence-based second-generation measures. Whereas several national organizations have developed quality indicators for follow-up of alcohol misuse (9,12,37), others—such as the National Quality Forum and NCQA—have not, in part because of a lack of information on the optimal approach to measuring the quality of appropriate follow-up care. This study evaluated the convergent validity between positive-screen–based and population-based quality indicators, an essential step in improving quality measurement for behavioral conditions (21). Findings suggest that positive-screen–based quality indicators systematically favor health systems with insensitive alcohol screening programs, undermining efforts to improve identification of alcohol misuse. Other positive-screen–based quality indicators for behavioral conditions may have similar limitations. Because underrecognition of behavioral conditions is a critical barrier to high-quality care (2), positive-screen–based quality indicators for other behavioral conditions should be evaluated in future research.

Conclusions

Valid measures of the quality of care will be essential for improving the recognition of and follow-up care for common behavioral conditions, such as alcohol misuse (2,6). This study suggests that positive-screen–based quality indicators derived from medical record reviews of provider documentation—like those used by VHA and JC—should be avoided. Positive-screen–based quality indicators bias measurement, favoring systems with screening programs that identify fewer patients with alcohol misuse (denominator bias) even when a uniform screen and screening threshold are used across all systems.

Acknowledgments and disclosures

This study was supported by the Substance Use Disorders Quality Enhancement Research Initiative SUB98-000 from VA Health Services Research and Development, by grant NIAAA R21 AA020894-01A1 from the National Institute on Alcohol Abuse and Alcoholism, and by the Group Health Research Institute. Funders had no role in the conduct or reporting of research. Data were provided via a data use agreement with the VA OABI (formerly the VA Office of Quality and Performance), which had no role in design or analyses but reviewed the manuscript before submission to ensure accurate use and reporting of data.
Dr. Bradley owns stocks in four pharmaceutical companies, Abbvie, Johnson and Johnson, Pfizer, and Proctor and Gamble. The other authors report no competing interests.

Supplementary Material

Supplemental Material (1018_ds001.pdf)

References

1.
Kessler RC, Chiu WT, Demler O, et al.: Prevalence, severity, and comorbidity of 12-month DSM-IV disorders in the National Comorbidity Survey Replication. Archives of General Psychiatry 62:617–627, 2005
2.
Institute of Medicine: Improving the Quality of Health Care for Mental and Substance-Use Conditions: Quality Chasm Series. Washington, DC, National Academies Press, 2006
3.
Table B22: State Estimates of Substance Use From the 2007–2008 National Surveys on Drug Use and Health. Rockville, Md, Substance Abuse and Mental Health Services Administration. Available at www.oas.samhsa.gov/2k8state/AppB.htm#TabB-9. Accessed Oct 3, 2011
4.
Demyttenaere K, Bruffaerts R, Posada-Villa J, et al.: Prevalence, severity, and unmet need for treatment of mental disorders in the World Health Organization World Mental Health Surveys. JAMA 291:2581–2590, 2004
5.
McGlynn EA, Asch SM, Adams JL, et al.: The quality of health care delivered to adults in the United States. New England Journal of Medicine 348:2635–2645, 2003
6.
Pincus HA, Spaeth-Rublee B, Watkins KE: Analysis and commentary: the case for measuring quality in mental health and substance abuse care. Health Affairs 30:730–736, 2011
7.
Chassin MR, Loeb JM, Schmaltz SP, et al.: Accountability measures—using measurement to promote quality improvement. New England Journal of Medicine 363:683–688, 2010
8.
Kilbourne AM, Greenwald DE, Hermann RC, et al.: Financial incentives and accountability for integrated medical care in Department of Veterans Affairs mental health programs. Psychiatric Services 61:38–44, 2010
9.
Tobacco and Alcohol Measures. Washington, DC, Joint Commission, Jan 21, 2011. Available at www.jointcommission.org/assets/1/6/HIQR_Release_Notes_1.1.13_v.4.2.pdf
10.
Humphreys K, McLellan AT: A policy-oriented review of strategies for improving the outcomes of services for substance use disorder patients. Addiction 106:2058–2066, 2011
11.
Lapham GT, Achtmeyer CE, Williams EC, et al.: Increased documented brief alcohol interventions with a performance measure and electronic decision support. Medical Care 50:179–187, 2012
12.
About eValue8. Washington, DC, National Business Coalition on Health, 2009. Available at evalue8.org/eValue8. Accessed Oct 3, 2011
13.
Bradley KA, Williams EC, Achtmeyer CE, et al.: Measuring performance of brief alcohol counseling in medical settings: a review of the options and lessons from the Veterans Affairs (VA) health care system. Substance Abuse 28:133–149, 2007
14.
Oslin DW, Ross J, Sayers S, et al.: Screening, assessment, and management of depression in VA primary care clinics. Journal of General Internal Medicine 21:46–50, 2006
15.
Bradley KA, Lapham GT, Hawkins EJ, et al.: Quality concerns with routine alcohol screening in VA clinical settings. Journal of General Internal Medicine 26:299–306, 2011
16.
Williams EC, Achtmeyer CE, Grossbard JR, et al: Barriers and Facilitators to Implementing Alcohol Screening With a Clinical Reminder in the VA: A Qualitative Study. Atlanta, Research Society on Alcoholism, 2011
17.
Jha AK, Perlin JB, Kizer KW, et al.: Effect of the transformation of the Veterans Affairs Health Care System on the quality of care. New England Journal of Medicine 348:2218–2227, 2003
18.
Bradley KA, Kivlahan DR, Williams EC: Brief approaches to alcohol screening: practical alternatives for primary care. Journal of General Internal Medicine 24:881–883, 2009
19.
Bradley KA, DeBenedetti AF, Volk RJ, et al.: AUDIT-C as a brief screen for alcohol misuse in primary care. Alcoholism, Clinical and Experimental Research 31:1208–1217, 2007
20.
Wright SM, Craig T, Campbell S, et al.: Patient satisfaction of female and male users of Veterans Health Administration services. Journal of General Internal Medicine 21(suppl 3):S26–S32, 2006
21.
Pronovost PJ, Lilford R: A road map for improving the performance of performance measures. Health Affairs 30:569–573, 2011
22.
Damman OC, Stubbe JH, Hendriks M, et al.: Using multilevel modeling to assess case-mix adjusters in consumer experience surveys in health care. Medical Care 47:496–503, 2009
23.
Buchsbaum DG, Buchanan RG, Lawton MJ, et al.: A program of screening and prompting improves short-term physician counseling of dependent and nondependent harmful drinkers. Archives of Internal Medicine 153:1573–1577, 1993
24.
Buchsbaum DG, Buchanan RG, Poses RM, et al.: Physician detection of drinking problems in patients attending a general medicine practice. Journal of General Internal Medicine 7:517–521, 1992
25.
Burman ML, Kivlahan DR, Buchbinder MB, et al.: Alcohol-related advice for Veterans Affairs primary care patients: who gets it? Who gives it? Journal of Studies on Alcohol 65:621–630, 2004
26.
Volk RJ, Steinbauer JR, Cantor SB: Patient factors influencing variation in the use of preventive interventions for alcohol abuse by primary care physicians. Journal of Studies on Alcohol 57:203–209, 1996
27.
Stata Statistical Software: Release 11. College Station, Tex, Stata Corp, 2009
28.
Solberg LI, Maciosek MV, Edwards NM: Primary care intervention to reduce alcohol misuse ranking its health impact and cost effectiveness. American Journal of Preventive Medicine 34:143–152, 2008
29.
Maciosek MV, Coffield AB, Edwards NM, et al.: Priorities among effective clinical preventive services: results of a systematic review and analysis. American Journal of Preventive Medicine 31:52–61, 2006
30.
Jonas DE, Garbutt JC, Amick HR, et al.: Behavioral counseling after screening for alcohol misuse in primary care: a systematic review and meta-analysis for the US Preventive Services Task Force. Annals of Internal Medicine 157:645–654, 2012
31.
Desai MM, Rosenheck RA, Craig TJ: Case-finding for depression among medical outpatients in the Veterans Health Administration. Medical Care 44:175–181, 2006
32.
Kilbourne AM, Keyser D, Pincus HA: Challenges and opportunities in measuring the quality of mental health care. Canadian Journal of Psychiatry 55:549–557, 2010
33.
Walter LC, Davidowitz NP, Heineken PA, et al.: Pitfalls of converting practice guidelines into quality measures: lessons learned from a VA performance measure. JAMA 291:2466–2470, 2004
34.
Landon BE, O’Malley AJ, Keegan T: Can choice of the sample population affect perceived performance: implications for performance assessment. Journal of General Internal Medicine 25:104–109, 2010
35.
Garnick DW, Horgan CM, Chalk M: Performance measures for alcohol and other drug services. Alcohol Research and Health 29:19–26, 2006
36.
HEDIS 2011 Technical Specifications, Vol 2. Washington, DC, National Committee for Quality Assurance, 2011
37.
Physician Consortium for Performance Improvement: Preventive Care and Screening: Percentage of Patients Aged 18 Years and Older Who Were Screened for Unhealthy Alcohol Use at Least Once During The Two-Year Measurement Period Using a Systematic Screening Method and Who Received Brief Counseling if Identified as an Unhealthy Alcohol User. Rockville, Md, Agency for Healthcare Research and Quality, National Quality Measures Clearinghouse, 2008. Available at www.qualitymeasures.ahrq.gov/content.aspx?id=13366&search=alcohol. Accessed Oct 3, 2011
38.
Bradley KA, Johnson ML, Williams EC: Commentary on Nilsen et al (2011): the importance of asking patients: the potential value of patient report of brief interventions. Addiction 106:1757–1759, 2011
39.
HEDIS CAHPS Health Plan Survey 4.0H Adult Questionnaire (Commercial). Washington, DC, National Committee for Quality Assurance, 2008. Available at www.cchri.org/programs/CAHPS%20PDFs/CAHPS_4_0H_Adult_Commercial_survey.pdf
40.
Whitlock EP, Polen MR, Green CA, et al.: Behavioral counseling interventions in primary care to reduce risky/harmful alcohol use by adults: a summary of the evidence for the US Preventive Services Task Force. Annals of Internal Medicine 140:557–568, 2004
41.
Bradley KA, Williams EC, Achtmeyer CE, et al.: Implementation of evidence-based alcohol screening in the Veterans Health Administration. American Journal of Managed Care 12:597–606, 2006
42.
Keenan PS, Cleary PD, O’Malley AJ, et al.: Geographic area variations in the Medicare health plan era. Medical Care 48:260–266, 2010
43.
Seale JP, Shellenberger S, Tillery WK, et al.: Implementing alcohol screening and intervention in a family medicine residency clinic. Substance Abuse 26:23–31, 2005
44.
Seale JP, Shellenberger S, Boltri JM, et al.: Effects of screening and brief intervention training on resident and faculty alcohol intervention behaviours: a pre- post-intervention assessment. BMC Family Practice 6:46, 2005
45.
Rose HL, Miller PM, Nemeth LS, et al.: Alcohol screening and brief counseling in a primary care hypertensive population: a quality improvement intervention. Addiction 103:1271–1280, 2008
46.
Bradley KA, Williams EC: Implementation of screening and brief intervention in clinical settings using quality improvement principles; in Principles of Addiction Medicine. Edited by, Fiellin D, Miller S, Saitz R, et al. Baltimore, Lippincott Williams & Wilkins, 2009
47.
Blumenthal D: Launching HITECH. New England Journal of Medicine 362:382–385, 2010
48.
Blumenthal D, Tavenner M: The “meaningful use” regulation for electronic health records. New England Journal of Medicine 363:501–504, 2010
49.
Ahern DK, Woods SS, Lightowler MC, et al.: Promise of and potential for patient-facing technologies to enable meaningful use. American Journal of Preventive Medicine 40(suppl 2):S162–S172, 2011
50.
Druss BG, Mauer BJ: Health care reform and care at the behavioral health–primary care interface. Psychiatric Services 61:1087–1092, 2010
51.
Walker EP: Medicare to cover alcohol, depression screening. MedPage Today, Oct 17, 2011. Available at www.medpagetoday.com/PrimaryCare/PreventiveCare/29085. Accessed Feb 1, 2012

Information & Authors

Information

Published In

Go to Psychiatric Services

Cover: Walter Martin, by Dickson Reeder, 1956. Oil on canvas. Collection of the San Antonio Art League and Museum, San Antonio, Texas.

Psychiatric Services
Pages: 1018 - 1025
PubMed: 23852137

History

Published online: 1 October 2013
Published in print: October 2013

Authors

Details

Katharine A. Bradley, M.D., M.P.H.
Dr. Bradley and Dr. Lapham are with the Group Health Research Institute, 1730 Minor Ave., Suite 1600, Seattle, WA 98101 (e-mail: [email protected]). Ms. Chavez, Dr. Williams, Ms. Achtmeyer, Dr. Rubinsky, and Dr. Kivlahan are with the Northwest Center of Excellence, Veterans Affairs (VA) Health Services Research and Development, Seattle. Ms. Chavez and Dr. Williams are also with the Department of Health Services, School of Public Health, University of Washington, Seattle. Dr. Hawkins is with the Center of Excellence in Substance Abuse Treatment and Education, VA Puget Sound Health Care System, Seattle. Dr. Saitz is with the Department of General Internal Medicine, Boston University, Boston.
Laura J. Chavez, M.P.H.
Dr. Bradley and Dr. Lapham are with the Group Health Research Institute, 1730 Minor Ave., Suite 1600, Seattle, WA 98101 (e-mail: [email protected]). Ms. Chavez, Dr. Williams, Ms. Achtmeyer, Dr. Rubinsky, and Dr. Kivlahan are with the Northwest Center of Excellence, Veterans Affairs (VA) Health Services Research and Development, Seattle. Ms. Chavez and Dr. Williams are also with the Department of Health Services, School of Public Health, University of Washington, Seattle. Dr. Hawkins is with the Center of Excellence in Substance Abuse Treatment and Education, VA Puget Sound Health Care System, Seattle. Dr. Saitz is with the Department of General Internal Medicine, Boston University, Boston.
Gwendolyn T. Lapham, Ph.D., M.P.H.
Dr. Bradley and Dr. Lapham are with the Group Health Research Institute, 1730 Minor Ave., Suite 1600, Seattle, WA 98101 (e-mail: [email protected]). Ms. Chavez, Dr. Williams, Ms. Achtmeyer, Dr. Rubinsky, and Dr. Kivlahan are with the Northwest Center of Excellence, Veterans Affairs (VA) Health Services Research and Development, Seattle. Ms. Chavez and Dr. Williams are also with the Department of Health Services, School of Public Health, University of Washington, Seattle. Dr. Hawkins is with the Center of Excellence in Substance Abuse Treatment and Education, VA Puget Sound Health Care System, Seattle. Dr. Saitz is with the Department of General Internal Medicine, Boston University, Boston.
Emily C. Williams, Ph.D., M.P.H.
Dr. Bradley and Dr. Lapham are with the Group Health Research Institute, 1730 Minor Ave., Suite 1600, Seattle, WA 98101 (e-mail: [email protected]). Ms. Chavez, Dr. Williams, Ms. Achtmeyer, Dr. Rubinsky, and Dr. Kivlahan are with the Northwest Center of Excellence, Veterans Affairs (VA) Health Services Research and Development, Seattle. Ms. Chavez and Dr. Williams are also with the Department of Health Services, School of Public Health, University of Washington, Seattle. Dr. Hawkins is with the Center of Excellence in Substance Abuse Treatment and Education, VA Puget Sound Health Care System, Seattle. Dr. Saitz is with the Department of General Internal Medicine, Boston University, Boston.
Carol E. Achtmeyer, M.N.
Dr. Bradley and Dr. Lapham are with the Group Health Research Institute, 1730 Minor Ave., Suite 1600, Seattle, WA 98101 (e-mail: [email protected]). Ms. Chavez, Dr. Williams, Ms. Achtmeyer, Dr. Rubinsky, and Dr. Kivlahan are with the Northwest Center of Excellence, Veterans Affairs (VA) Health Services Research and Development, Seattle. Ms. Chavez and Dr. Williams are also with the Department of Health Services, School of Public Health, University of Washington, Seattle. Dr. Hawkins is with the Center of Excellence in Substance Abuse Treatment and Education, VA Puget Sound Health Care System, Seattle. Dr. Saitz is with the Department of General Internal Medicine, Boston University, Boston.
Anna D. Rubinsky, Ph.D., M.S.
Dr. Bradley and Dr. Lapham are with the Group Health Research Institute, 1730 Minor Ave., Suite 1600, Seattle, WA 98101 (e-mail: [email protected]). Ms. Chavez, Dr. Williams, Ms. Achtmeyer, Dr. Rubinsky, and Dr. Kivlahan are with the Northwest Center of Excellence, Veterans Affairs (VA) Health Services Research and Development, Seattle. Ms. Chavez and Dr. Williams are also with the Department of Health Services, School of Public Health, University of Washington, Seattle. Dr. Hawkins is with the Center of Excellence in Substance Abuse Treatment and Education, VA Puget Sound Health Care System, Seattle. Dr. Saitz is with the Department of General Internal Medicine, Boston University, Boston.
Eric J. Hawkins, Ph.D.
Dr. Bradley and Dr. Lapham are with the Group Health Research Institute, 1730 Minor Ave., Suite 1600, Seattle, WA 98101 (e-mail: [email protected]). Ms. Chavez, Dr. Williams, Ms. Achtmeyer, Dr. Rubinsky, and Dr. Kivlahan are with the Northwest Center of Excellence, Veterans Affairs (VA) Health Services Research and Development, Seattle. Ms. Chavez and Dr. Williams are also with the Department of Health Services, School of Public Health, University of Washington, Seattle. Dr. Hawkins is with the Center of Excellence in Substance Abuse Treatment and Education, VA Puget Sound Health Care System, Seattle. Dr. Saitz is with the Department of General Internal Medicine, Boston University, Boston.
Richard Saitz, M.D., M.P.H.
Dr. Bradley and Dr. Lapham are with the Group Health Research Institute, 1730 Minor Ave., Suite 1600, Seattle, WA 98101 (e-mail: [email protected]). Ms. Chavez, Dr. Williams, Ms. Achtmeyer, Dr. Rubinsky, and Dr. Kivlahan are with the Northwest Center of Excellence, Veterans Affairs (VA) Health Services Research and Development, Seattle. Ms. Chavez and Dr. Williams are also with the Department of Health Services, School of Public Health, University of Washington, Seattle. Dr. Hawkins is with the Center of Excellence in Substance Abuse Treatment and Education, VA Puget Sound Health Care System, Seattle. Dr. Saitz is with the Department of General Internal Medicine, Boston University, Boston.
Daniel R. Kivlahan, Ph.D.
Dr. Bradley and Dr. Lapham are with the Group Health Research Institute, 1730 Minor Ave., Suite 1600, Seattle, WA 98101 (e-mail: [email protected]). Ms. Chavez, Dr. Williams, Ms. Achtmeyer, Dr. Rubinsky, and Dr. Kivlahan are with the Northwest Center of Excellence, Veterans Affairs (VA) Health Services Research and Development, Seattle. Ms. Chavez and Dr. Williams are also with the Department of Health Services, School of Public Health, University of Washington, Seattle. Dr. Hawkins is with the Center of Excellence in Substance Abuse Treatment and Education, VA Puget Sound Health Care System, Seattle. Dr. Saitz is with the Department of General Internal Medicine, Boston University, Boston.

Metrics & Citations

Metrics

Citations

Export Citations

If you have the appropriate software installed, you can download article citation data to the citation manager of your choice. Simply select your manager software from the list below and click Download.

For more information or tips please see 'Downloading to a citation manager' in the Help menu.

Format
Citation style
Style
Copy to clipboard

View Options

View options

PDF/EPUB

View PDF/EPUB

Get Access

Login options

Already a subscriber? Access your subscription through your login credentials or your institution for full access to this article.

Personal login Institutional Login Open Athens login
Purchase Options

Purchase this article to access the full text.

PPV Articles - Psychiatric Services

PPV Articles - Psychiatric Services

Not a subscriber?

Subscribe Now / Learn More

PsychiatryOnline subscription options offer access to the DSM-5-TR® library, books, journals, CME, and patient resources. This all-in-one virtual library provides psychiatrists and mental health professionals with key resources for diagnosis, treatment, research, and professional development.

Need more help? PsychiatryOnline Customer Service may be reached by emailing [email protected] or by calling 800-368-5777 (in the U.S.) or 703-907-7322 (outside the U.S.).

Media

Figures

Other

Tables

Share

Share

Share article link

Share