Employment Status of People With Mental Illness: National Survey Data From 2009 and 2010
Abstract
Objective
Methods
Results
Conclusions
Disability enrollment
Economic recession
Evidence-based interventions
Methods
Data source and study population
Measures
Employment status and related outcomes.
Past-year mental illness severity.
Selection of adjustment factors.
Past-year substance use disorder.
Health status.
Sociodemographic characteristics.
Analytic strategy
Results
Demographic characteristics
| Past-year mental illness | ||||||||
|---|---|---|---|---|---|---|---|---|
| None (N=57,283) | Mild (N=10,643) | Moderate (N=4,170) | Serious (N=5,230) | |||||
| Characteristic | N | % | N | % | N | % | N | % |
| Female | 26,647 | 48.1 | 6,069 | 57.0 | 2,524 | 58.9 | 3,589 | 66.7 |
| Age | ||||||||
| 18–25 | 26,604 | 15.9 | 6,229 | 25.0 | 2,474 | 24.4 | 3,013 | 23.8 |
| 26–34 | 8,506 | 18.5 | 1,587 | 21.4 | 634 | 22.0 | 807 | 21.3 |
| 35–49 | 12,655 | 33.8 | 1,847 | 32.1 | 718 | 29.5 | 1,019 | 32.6 |
| 50–64 | 5,749 | 31.7 | 642 | 21.4 | 262 | 24.1 | 331 | 22.4 |
| Education | ||||||||
| Less than high school | 8,384 | 13.3 | 1,745 | 14.1 | 775 | 17.1 | 909 | 15.5 |
| High school graduate | 17,496 | 30.0 | 3,308 | 29.6 | 1,358 | 28.7 | 1,758 | 33.0 |
| Some college | 15,508 | 26.0 | 3,166 | 28.2 | 1,262 | 29.4 | 1,709 | 30.9 |
| College graduate or higher | 12,126 | 30.7 | 2,086 | 28.1 | 713 | 24.8 | 794 | 20.6 |
| Ever married | 24,960 | 28.8 | 3,669 | 40.7 | 1,453 | 41.8 | 2,031 | 38.5 |
| Race-ethnicity | ||||||||
| White | 33,120 | 64.8 | 6,629 | 68.7 | 2,652 | 68.3 | 3,532 | 73.0 |
| Black | 6,882 | 12.5 | 1,270 | 12.0 | 468 | 11.3 | 470 | 9.5 |
| Hispanic | 8,961 | 15.9 | 1,433 | 12.4 | 593 | 14.4 | 684 | 12.1 |
| Other | 4,551 | 6.8 | 973 | 6.9 | 375 | 6.1 | 484 | 5.5 |
| Substance use | ||||||||
| No substance use disorder | 47,851 | 92.8 | 7,880 | 82.5 | 2,942 | 78.4 | 3,487 | 75.6 |
| Alcohol abuse only | 2,727 | 3.7 | 771 | 6.0 | 312 | 5.2 | 343 | 4.9 |
| Alcohol dependence only | 1,374 | 2.2 | 748 | 6.3 | 340 | 8.1 | 525 | 9.8 |
| Drug abuse only | 304 | .3 | 121 | .9 | 66 | 1.6 | 72 | 1.1 |
| Drug dependence only | 624 | .7 | 368 | 2.4 | 172 | 4.0 | 316 | 5.3 |
| Abuse of or dependence on alcohol and drugs | 357 | .3 | 250 | 1.8 | 149 | 2.7 | 277 | 3.4 |
| General health | ||||||||
| Excellent | 15,952 | 27.7 | 2,188 | 19.3 | 699 | 14.0 | 741 | 11.6 |
| Very good | 21,365 | 38.5 | 4,037 | 35.8 | 1,521 | 32.7 | 1,759 | 30.1 |
| Good | 12,717 | 25.1 | 2,905 | 29.3 | 1,269 | 32.0 | 1,614 | 30.5 |
| Fair or poor | 3,474 | 8.7 | 1,175 | 15.6 | 598 | 21.3 | 1,056 | 27.8 |
| Children <18 years old in household | ||||||||
| 0 | 35,028 | 62.0 | 7,210 | 63.8 | 2,868 | 68.0 | 3,590 | 66.9 |
| 1 | 8,272 | 15.9 | 1,445 | 15.0 | 611 | 14.8 | 753 | 14.6 |
| 2 | 6,477 | 14.0 | 1,041 | 13.5 | 382 | 10.9 | 500 | 11.2 |
| ≥3 | 3,680 | 8.1 | 603 | 7.7 | 224 | 6.3 | 325 | 7.3 |
| Arrests and bookings in past year | ||||||||
| 0 | 50,594 | 97.4 | 9,470 | 95.1 | 3,688 | 94.5 | 4,626 | 91.9 |
| 1 | 1,712 | 2.0 | 523 | 3.7 | 223 | 3.7 | 338 | 5.8 |
| 2 | 337 | .4 | 108 | .7 | 74 | 1.1 | 88 | 1.4 |
| ≥3 | 192 | .2 | 68 | .4 | 37 | .8 | 60 | .9 |
| County type | ||||||||
| Large metropolitan area | 23,860 | 54.7 | 4,557 | 53.2 | 1,759 | 53.1 | 2,096 | 48.9 |
| Small metropolitan area | 18,526 | 29.9 | 3,651 | 31.3 | 1,479 | 32.5 | 1,922 | 31.9 |
| Nonmetropolitan | 11,128 | 15.4 | 2,097 | 15.5 | 850 | 14.3 | 1,152 | 19.2 |
Employment rates
| Past-year mental illness | ||||||||
|---|---|---|---|---|---|---|---|---|
| None (N=57,283) | Mild (N=10,643) | Moderate (N=4,170) | Serious (N=5,230) | |||||
| Observation | N | % | N | % | N | % | N | % |
| Employment | ||||||||
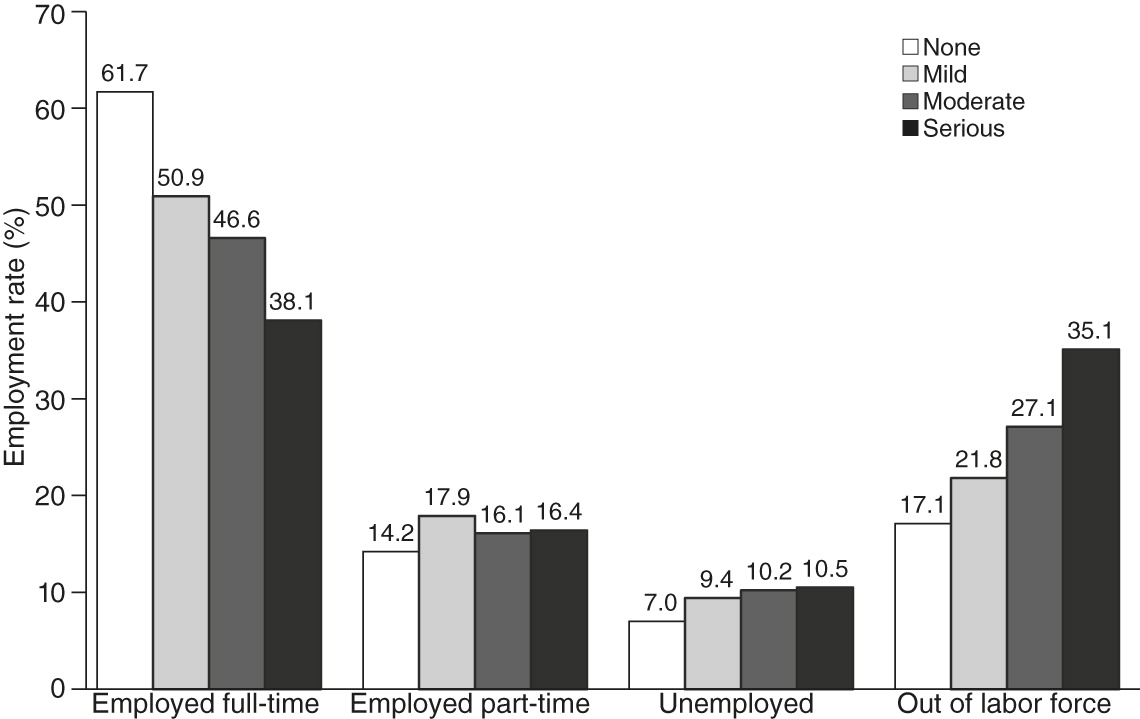
| Full-time | 28,100 | 61.7 | 4,394 | 50.9 | 1,576 | 46.6 | 1,777 | 38.1 |
| Part-time | 10,300 | 14.2 | 2,428 | 17.9 | 944 | 16.1 | 1,149 | 16.4 |
| Unemployed | 5,149 | 7.0 | 1,211 | 9.4 | 548 | 10.2 | 660 | 10.5 |
| Out of labor force | 9,965 | 17.1 | 2,272 | 21.8 | 1,020 | 27.1 | 1,584 | 35.1 |
| Respondent’s total income | ||||||||
| <$10,000 (including loss) | 19,812 | 23.1 | 4,778 | 32.0 | 2,014 | 35.5 | 2,596 | 38.5 |
| $10,000–$19,999 | 10,625 | 16.3 | 2,207 | 18.9 | 913 | 21.1 | 1,230 | 23.2 |
| $20,000–$29,999 | 6,912 | 13.6 | 1,223 | 13.4 | 451 | 12.4 | 546 | 12.1 |
| $30,000–$39,999 | 5,013 | 11.9 | 761 | 10.8 | 298 | 10.1 | 299 | 8.2 |
| $40,000–$49,999 | 3,489 | 9.2 | 456 | 6.7 | 157 | 7.6 | 194 | 5.8 |
| $50,000–$74,999 | 4,295 | 13.2 | 554 | 10.3 | 151 | 6.9 | 190 | 7.5 |
| ≥$75,000 | 3,368 | 12.8 | 326 | 7.8 | 104 | 6.3 | 115 | 4.8 |
| Past-year benefits to family | ||||||||
| Social Security | 5,050 | 12.8 | 1,186 | 14.7 | 531 | 18.2 | 786 | 20.8 |
| Supplemental Security Income | 2,925 | 5.8 | 818 | 8.6 | 380 | 11.5 | 567 | 13.2 |
| Employed respondent’s total incomeb | ||||||||
| <$10,000 (including loss) | 9,130 | 12.3 | 2,241 | 19.1 | 874 | 20.1 | 1,017 | 21.4 |
| $10,000–$19,999 | 8,296 | 15.7 | 1,655 | 18.7 | 654 | 20.2 | 816 | 23.0 |
| $20,000–$29,999 | 5,989 | 15.0 | 1,035 | 15.6 | 358 | 15.5 | 429 | 16.3 |
| $30,000–$39,999 | 4,488 | 13.8 | 666 | 13.5 | 256 | 14.0 | 242 | 11.8 |
| $40,000–$49,999 | 3,222 | 11.0 | 419 | 8.9 | 142 | 10.7 | 166 | 8.3 |
| $50,000–$74,999 | 4,062 | 16.2 | 503 | 13.9 | 138 | 9.9 | 153 | 11.1 |
| ≥$75,000 | 3,213 | 16.0 | 303 | 10.4 | 98 | 9.6 | 103 | 8.1 |
| Missed or skipped work ≥1 day in past weekb | 9,559 | 21.5 | 2,304 | 30.5 | 997 | 37.9 | 1,239 | 40.7 |
| Occupation categoryb | ||||||||
| Executive, administrative, managerial, or financial | 4,053 | 14.5 | 578 | 13.6 | 199 | 12 | 5,062 | 11.4 |
| Professional (not education, entertainment, or media) | 3,696 | 12.8 | 586 | 11.4 | 194 | 11.9 | 4,688 | 10.3 |
| Education and related occupations | 2,166 | 6.2 | 401 | 7.1 | 154 | 6.5 | 2,886 | 8.1 |
| Entertainers, sports, media, and communications | 805 | 2.2 | 196 | 3.1 | 60 | 2.2 | 1,141 | 3.6 |
| Technicians and related support occupations | 2,216 | 5.2 | 457 | 5.9 | 173 | 5.3 | 3,075 | 6.9 |
| Sales occupations | 4,574 | 9.9 | 953 | 11.6 | 392 | 14.3 | 6,352 | 11.4 |
| Office and administrative support workers | 4,937 | 12.4 | 973 | 14.2 | 369 | 14.3 | 6,722 | 14.5 |
| Protective service occupations | 930 | 2.5 | 125 | 1.9 | 43 | 2.5 | 1,143 | 2.2 |
| Service occupations, except protective | 6,648 | 11.7 | 1,485 | 15.5 | 547 | 14.3 | 9,368 | 18.1 |
| Farming, fishing, and forestry occupations | 375 | .7 | 45 | .3 | 15 | .2 | 447 | .3 |
| Installation, maintenance, and repair workers | 1,386 | 4.0 | 154 | 2.5 | 53 | 2.5 | 1,653 | 1.5 |
| Construction trades and extraction workers | 2,426 | 5.9 | 319 | 4.4 | 101 | 4.7 | 2,925 | 2.5 |
| Production, machinery setters, operators, and tenders | 2,199 | 5.9 | 286 | 4.0 | 117 | 5.4 | 2,734 | 4.9 |
| Transportation and material moving workers | 2,283 | 6.0 | 334 | 4.7 | 131 | 3.9 | 2,883 | 4.2 |

Other employment outcomes
Associations with full- or part-time employment
| Model 1: No mental illness | Model 2: Mild mental illness | Model 3: Moderate mental illness | Model 4: Serious mental illness | |||||||||
|---|---|---|---|---|---|---|---|---|---|---|---|---|
| Observation | % | OR | 95% CI | % | OR | 95% CI | % | OR | 95% CI | % | OR | 95% CI |
| Age | ||||||||||||
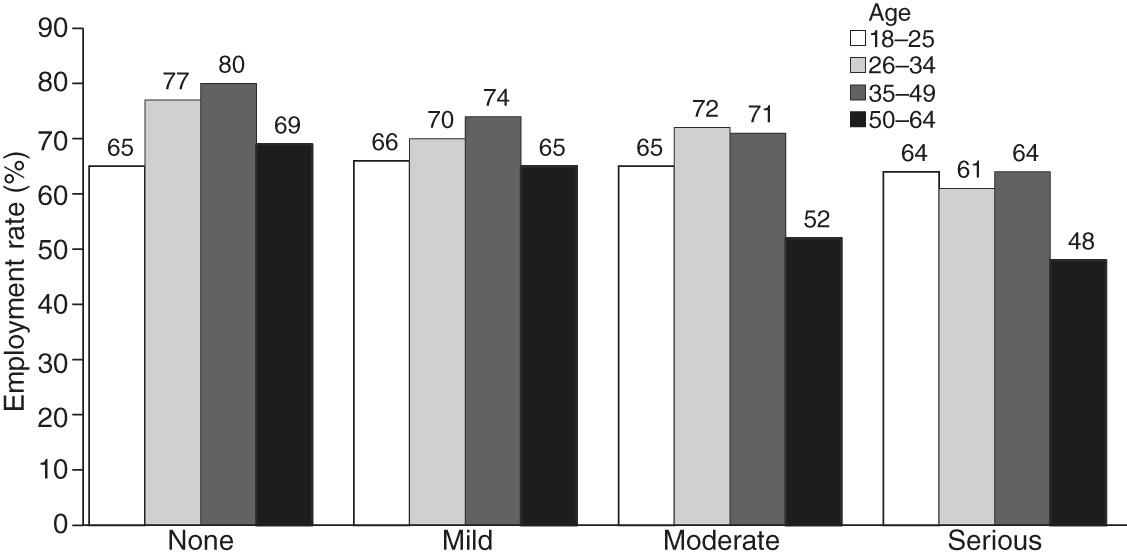
| 18–25 (reference) | 65 | — | — | 66 | — | — | 65 | — | — | 64 | — | — |
| 26–34 | 77 | 1.92 | 1.75–2.12 | 70 | 1.23 | .99–1.52 | 72 | 1.41 | 1.04–1.92 | 61 | .90 | .69–1.16 |
| 35–49 | 80 | 2.25 | 2.04–2.48 | 74 | 1.47 | 1.15–1.87 | 71 | 1.36 | .95–1.94 | 64 | 1.00 | .76–1.33 |
| 50–64 | 69 | 1.22 | 1.08–1.38 | 65 | .93 | .69–1.27 | 52 | .56 | .36–.86 | 48 | .50 | .34–.72 |
| Race-ethnicity | ||||||||||||
| White (reference) | 71 | — | — | 70 | — | — | 70 | — | — | 62 | — | — |
| Black | 69 | .87 | .78–.97 | 61 | .66 | .51–.85 | 57 | .59 | .43–.81 | 58 | .83 | .56–1.22 |
| Hispanic | 71 | 1.00 | .87–1.14 | 70 | 1.02 | .81–1.29 | 71 | 1.16 | .83–1.62 | 63 | 1.04 | .75–1.43 |
| Other | 68 | .84 | .71–.98 | 64 | .76 | .56–1.04 | 61 | .71 | .42–1.20 | 66 | 1.22 | .62–2.41 |
| Education | ||||||||||||
| Less than high school (reference) | 58 | — | — | 54 | — | — | 46 | — | — | 46 | — | — |
| High school graduate | 69 | 1.64 | 1.46–1.83 | 65 | 1.61 | 1.29–2.00 | 64 | 2.17 | 1.58–3.00 | 59 | 1.67 | 1.20–2.33 |
| Some college | 75 | 2.26 | 2.02–2.52 | 73 | 2.48 | 1.94–3.18 | 70 | 2.88 | 2.00–4.15 | 65 | 2.26 | 1.69–3.03 |
| College graduate or higher | 77 | 2.60 | 2.25–3.01 | 78 | 3.17 | 2.45–4.09 | 79 | 4.69 | 3.02–7.28 | 74 | 3.44 | 2.28–5.18 |
| Gender | ||||||||||||
| Male (reference) | 76 | — | — | 72 | — | — | 76 | — | — | 76 | — | — |
| Female | 65 | .55 | .52–.59 | 65 | .73 | .61–.87 | 65 | .97 | .77–1.22 | 65 | .82 | .64–1.05 |
| Ever married | ||||||||||||
| No (reference) | 69 | — | — | 66 | — | — | 65 | — | — | 58 | — | — |
| Yes | 73 | 1.22 | 1.10–1.34 | 71 | 1.31 | 1.05–1.63 | 67 | 1.09 | .78–1.52 | 67 | 1.52 | 1.10–2.09 |
| General health | ||||||||||||
| Excellent (reference) | 73 | — | — | 71 | — | — | 71 | — | — | 68 | — | — |
| Very good | 74 | 1.07 | .97–1.18 | 72 | 1.03 | .87–1.22 | 67 | .82 | .57–1.17 | 65 | .90 | .67–1.20 |
| Good | 69 | .82 | .74–.91 | 67 | .83 | .70–.99 | 67 | .82 | .54–1.24 | 59 | .67 | .51–.88 |
| Fair or poor | 51 | .34 | .30–.39 | 48 | .35 | .26–.45 | 45 | .30 | .19–.46 | 36 | .25 | .18–.34 |
| Children <18 years old in household | ||||||||||||
| 0 (reference) | 71 | — | — | 69 | — | — | 65 | — | — | 62 | — | — |
| 1 | 74 | 1.20 | 1.10–1.31 | 69 | 1.02 | .81–1.27 | 70 | 1.28 | .87–1.88 | 59 | .85 | .63–1.16 |
| 2 | 71 | 1.03 | .94–1.13 | 69 | 1.04 | .81–1.34 | 72 | 1.43 | .95–2.16 | 62 | 1.00 | .71–1.42 |
| ≥3 | 63 | .67 | .60–.76 | 62 | .73 | .55–.98 | 60 | .80 | .46–1.37 | 61 | .92 | .61–1.39 |
| Arrests and bookings in past year | ||||||||||||
| 0 (reference) | 71 | — | — | 69 | — | — | 67 | — | — | 62 | — | — |
| 1 | 62 | .65 | .52–.80 | 60 | .67 | .50–.89 | 62 | .78 | .51–1.21 | 51 | .59 | .38–.92 |
| 2 | 55 | .46 | .29–.72 | 46 | .34 | .20–.60 | 56 | .59 | .31–1.12 | 59 | .87 | .42–1.82 |
| ≥3 | 59 | .55 | .31–.95 | 55 | .52 | .24–1.14 | 50 | .45 | .14–1.44 | 53 | .66 | .27–1.65 |
| County type | ||||||||||||
| Large metropolitan area (reference) | 71 | — | — | 68 | — | — | 68 | — | — | 63 | — | — |
| Small metropolitan area | 70 | .98 | .91–1.06 | 69 | 1.03 | .88–1.21 | 64 | .79 | .62–1.02 | 62 | .94 | .77–1.14 |
| Nonmetropolitan | 70 | .97 | .87–1.08 | 68 | 1.02 | .83–1.25 | 66 | .92 | .68–1.23 | 59 | .84 | .61–1.15 |
| Substance use | ||||||||||||
| No substance use disorder (reference) | 70 | — | — | 68 | — | — | 66 | — | — | 61 | — | — |
| Alcohol abuse only | 74 | 1.23 | 1.01–1.49 | 72 | 1.20 | .87–1.65 | 69 | 1.17 | .73–1.88 | 65 | 1.19 | .77–1.82 |
| Alcohol dependence only | 71 | 1.01 | .83–1.24 | 69 | 1.04 | .72–1.49 | 72 | 1.33 | .93–1.90 | 68 | 1.37 | 1.01–1.86 |
| Drug abuse only | 72 | 1.07 | .75–1.51 | 61 | .70 | .41–1.20 | 63 | .86 | .41–1.80 | 59 | .92 | .34–2.45 |
| Drug dependence only | 71 | 1.04 | .75–1.44 | 59 | .63 | .44–.89 | 52 | .52 | .31–.87 | 57 | .83 | .57–1.21 |
| Abuse of or dependence on alcohol and drugs | 64 | .74 | .45–1.21 | 60 | .67 | .42–1.06 | 60 | .74 | .44–1.23 | 68 | 1.40 | .92–2.19 |

Discussion
Conclusions
Acknowledgments and disclosures
Supplementary Material
- View/Download
- 40.03 KB
References
Information & Authors
Information
Published In

Cover: Shamrock Ranch, by Peter Hurd, 1962. Watercolor, 12 × 16 inches. New Mexico Museum of Art, Santa Fe. Gift of the family of Edythe C. Mattone, 2005.
History
Authors
Metrics & Citations
Metrics
Citations
Export Citations
If you have the appropriate software installed, you can download article citation data to the citation manager of your choice. Simply select your manager software from the list below and click Download.
For more information or tips please see 'Downloading to a citation manager' in the Help menu.
View Options
View options
PDF/EPUB
View PDF/EPUBLogin options
Already a subscriber? Access your subscription through your login credentials or your institution for full access to this article.
Personal login Institutional Login Open Athens loginNot a subscriber?
PsychiatryOnline subscription options offer access to the DSM-5-TR® library, books, journals, CME, and patient resources. This all-in-one virtual library provides psychiatrists and mental health professionals with key resources for diagnosis, treatment, research, and professional development.
Need more help? PsychiatryOnline Customer Service may be reached by emailing [email protected] or by calling 800-368-5777 (in the U.S.) or 703-907-7322 (outside the U.S.).
