Substance use disorders are among the key contributors to adolescent morbidity and mortality in the United States (
1), necessitating effective treatment for youths with such disorders. Unfortunately, consumers have little information to ensure that adolescents are provided with effective treatments because few practices or processes have been shown to reliably predict adolescent treatment outcomes (
2–
6). When specific treatment practices are known to correspond with superior client outcomes and these practices are not universally implemented, they may serve as quality indicators that distinguish better-performing facilities from those with worse performance (
7,
8). This study tested whether the provision of mental health services is an appropriate structural quality indicator for adolescent substance abuse treatment facilities.
Notable efforts have been made to identify quality metrics for substance abuse treatment services, most of which derive from expert consensus. Experts have recommended performance measures (such as client engagement) (
9–
11), key adolescent substance abuse treatment elements (for example, staff trained in adolescent development and co-occurring mental disorders) (
12), and effective addiction treatment principles (such as the principle that many drug-addicted individuals also have other mental disorders) (
13). Many of these measures, elements, and principles overlap; studies have examined how clinical practice conforms or adheres to some of these guidelines (
12,
14,
15), but only one process measure—client engagement—has been associated with positive client outcomes (
4,
16,
17).
One salient structural characteristic that may serve as an ideal quality indicator is whether substance abuse treatment facilities offer mental health services. Over half of adolescents entering treatment report having mental health problems (
18–
24), suggesting that co-occurring disorders among adolescents are the “norm rather than the exception” (
25). Facilities are encouraged to offer integrated care that addresses both substance abuse and mental health symptoms) (
12,
13,
25). However, only a minority of clients receive mental health services (
21,
26), possibly because only about half of these facilities offer them (
5). To date, no study has examined whether the provision of mental health services at the facility level might be associated with better client outcomes in youth treatment settings. In this study, we tested whether the availability of mental health services might serve as an appropriate structural quality indicator for adolescent substance abuse treatment facilities. We did so using data from 50 facilities that offered different levels of mental health services and served over 6,000 adolescents. Using case-mix adjustment, we examined whether youths who received treatment at facilities offering mental health services fared better at 12 months postintake than youths attending facilities not offering such services.
Methods
Sample
Data were from facilities that were supported by one of nine discretionary grant programs sponsored and initiated by the Substance Abuse and Mental Health Services Administration Center for Substance Abuse Treatment (CSAT) between 1998 and 2008. Although the focus and initiation year of each discretionary program differed, all facilities were required to collect intake (baseline) and 12-month postintake (outcome) information from youths receiving funded services. All youths were 12–18 years of age, and we restricted our analysis to outpatient programs because adolescents in the United States receive mostly outpatient care (
27). During that period, CSAT supported 108 facilities. We excluded 29 sites that were missing facility-level data on services offered and 29 sites missing outcome data (22 were missing all 12-month data; seven did not collect data on two of the measures used for this analysis at baseline or follow-up). The final analytic sample consisted of 50 facilities serving 6,623 clients. This sample was further restricted to 3,235 clients with complete 12-month outcomes. Analyses were reviewed and approved by RAND’s institutional review board.
Measures
Both facility- and client-level data were used for the study.
Facility characteristics.
To obtain facility-level data on provision of mental health services, in 2010 we used a tailored survey design (
28) to survey administrative or clinical staff via mail or e-mail (identified staff indicated their preference during initial contact) at the funded facilities. Provision of mental health services was assessed with the following question: “Does this location treat both the substance abuse problems and psychiatric problems of dually diagnosed adolescents?” Full mental health services were defined by the response “Yes, can treat all psychiatric conditions (e.g., have psychiatrist and/or licensed social worker or psychologist on staff)”; partial mental health services were defined by the response “Yes, except for severe/persistent mental illness (includes actively psychotic, danger to self and others).” Those who responded “No” were categorized as providing no mental health services. Staff who completed the survey indicated whether responses referred to the time that the client-level data were collected or to the time of the 2010 survey.
We examined 20 other facility-level characteristics that could potentially co-occur with the different mental health services and be related to the outcomes. These characteristics were drawn from both our own survey and characteristics collected in the National Survey of Substance Abuse Treatment Services that we were able to match to the selected facilities in the year in which the grant was initially funded. Specific variables were whether the facility offered particular assessments (comprehensive substance abuse assessment or diagnosis), therapy and counseling (family counseling or aftercare counseling), testing (biological drug testing, HIV testing, other testing for sexually transmitted diseases [STDs], and tuberculosis screening), transitional and other ancillary services (assistance with obtaining social services; discharge planning; employment counseling or training; case management; and HIV/AIDS education, counseling, or support or other types of HIV-related interventions), and models of care (cognitive-behavioral, 12-step, therapeutic community, motivational enhancements, motivational incentives, and other), as well as an indicator of whether the facility had any licensure, certification, or accreditation. For most items, facility representatives were asked, “Which of the following services are provided by this facility at this location? (mark all that apply).”
Client characteristics.
All client characteristics were assessed via self-report responses to the Global Appraisal of Individual Needs (GAIN) (
29,
30). All facilities were required to use the GAIN at treatment intake and 12 months after intake. Case-mix adjustment controlled for 22 baseline variables across five domains: demographic characteristics, substance use, mental health, criminal justice involvement, and social risk.
Outcomes.
We examined four outcomes: Substance use frequency was measured with a scale that assessed the average proportion of the past 90 days on which alcohol and other drugs were used. Substance use problems in the past month were assessed with endorsement of up to 16 symptoms associated with criteria for substance dependence or abuse, health and psychological problems, and substance-induced health and psychological disorders. Internal reliability was good (Cronbach’s α=.80) for the Substance Use Frequency Scale (
31) and excellent (Cronbach’s α=.92) for the Substance Problem Scale (
30); a test-retest analysis of adolescents showed that both scales also showed good reliability over a 90-day interval (r>.72 for both) (
32). Internalizing problems were measured with a 43-item scale that comprises, with excellent reliability (Cronbach’s α=.94), a count of past-year symptoms related to internalizing disorders (
30) and reflects severe levels of mental distress, such as traumatic stress and homicidal and suicidal thoughts (
33). Externalizing problems were measured with the Behavior Complexity Scale, which is a count of 33 symptoms relating to externalizing disorders, also with excellent reliability (α=.94) (
30), and which chiefly reflects inattention and less so symptoms of conduct disorder (
33).
Analysis
Nonresponse weights.
Because we had limited outcome data from 50 treatment facilities, we first estimated nonresponse weights using generalized boosted models (GBM) (
34). These weights enabled matching clients with 12-month outcomes to the original baseline sample of 7,964 clients from 72 facilities (50 with 12-month outcomes and 22 that systematically did not collect any 12-month outcomes) with respect to the 22 pretreatment variables described above.
Case-mix adjustment.
Next, we estimated propensity score weights to adjust for baseline differences among youths who attended substance abuse treatment facilities with full, partial, or no mental health services. We created weights for youths in each group to match the characteristics of the overall analytic sample at baseline with respect to the distributions of the 22 baseline variables described above. Propensity score weights were also created with GBM (
35). Estimation of both the nonresponse and propensity score weights used the Twang package in R (
36,
37).
After propensity score weighting, we calculated the pre- and postweighting absolute standardized mean difference (ASMD) from the overall analytic sample for each group on each of the pretreatment variables. A value of 0 represented no difference in means, whereas a value of 1 represented one standard deviation difference between a particular group and the overall analytic sample. For each variable, we took the maximum ASMD across the three treatment groups to summarize how well balanced the groups were compared with the overall analytic sample. Group differences were deemed to be notable when the maximum ASMD was >.20 (
38).
Facility-level adjustment.
The level of mental health services offered may correlate with other services or practices. Although such clustering would not necessarily invalidate the provision of mental health services as a quality indicator, we nonetheless set out to assess the sensitivity of our findings to adjustment for additional facility-level confounds. Of the aforementioned 20 facility-level characteristics, facilities offering different levels of mental health services differed meaningfully on 13 characteristics. We did not have enough facilities within each group to estimate either propensity score weights to balance on these characteristics or regression models that would control for all 13 characteristics. We therefore estimated a series of outcome models that adjusted one at a time for seven of the most imbalanced covariates (biological drug testing; case management; accreditation and licensing; and reporting 12-step treatment orientation, therapeutic community, motivational enhancement, or motivational incentives as the primary care model), noting when results from the models were qualitatively different from those in the model that did not include the particular variable. Two characteristics yielded such differences: reporting a 12-step treatment orientation or motivational incentives as a primary care model. Given that adjustment for these measures would affect the estimated impact of partial mental health services facilities, our final models controlled for these two variables.
Outcome analysis.
We used weighted linear regression models to estimate the association between mental health service provision and each outcome. The models used dummy indicators for type of facility, along with the covariates that, after weighting, had ASMD values >.20 and two facility-level characteristics. All models controlled for clustering of clients within facilities, and predictive margins/recycled mean predictions were used to compute the estimated mean 12-month outcomes for each facility group (
34). Predictive margins/recycled mean predictions compute the predicted mean for each group, with the assumption that all youths in the analytic sample had attended facilities within that group. From there, we could estimate predicted mean group differences along with appropriate standard errors by using methods detailed elsewhere (
34). Models were fit with the “survey” package in R.
Results
Description of the Sample
Before nonresponse weighting, at baseline youths with 12-month data were more likely than the rest of the sample to recognize that they had a substance use problem. After weighting this difference was attenuated.
Thirteen sites (N=849 clients) reported offering full mental health services, 18 facilities (N=1,227 clients) offered partial mental health services only, and 19 facilities (N=1,159 clients) did not offer any mental health services. Of the 31 sites offering any mental health services, 18 reported that these services were offered during the funding period, and 12 reported currently offering them; one site did not answer the question about whether their survey responses, and the provision of mental health services, reflected current operations or status during the funding period. Data for the overall sample to which we weighted each subgroup are presented in the last column of
Table 1. In aggregate, approximately one-quarter of the sample was female, and half was white. Nearly half (N=1,520, 47%) were in treatment for marijuana as the primary substance. According to thresholds established by the developers of the GAIN instrument (
39), the youths in the sample had moderate levels of frequent substance use in the past month and moderate to high levels of substance use problems in the past year.
Case-Mix Adjustment
Weighting by both propensity score and nonresponse weights balanced the data from the three groups of facilities. Before the data were weighted, the groups were notably different on almost half of the 22 variables. After we applied propensity score weights, four differences remained: youths in facilities with full mental health services still had lower levels of experiences with a controlled environment, with the criminal justice system, and with being institutionalized compared with the overall sample. In addition, the full mental health service facilities treated a lower proportion of Hispanic clients. These four variables were included as covariates in our analyses.
Substance Use Outcomes
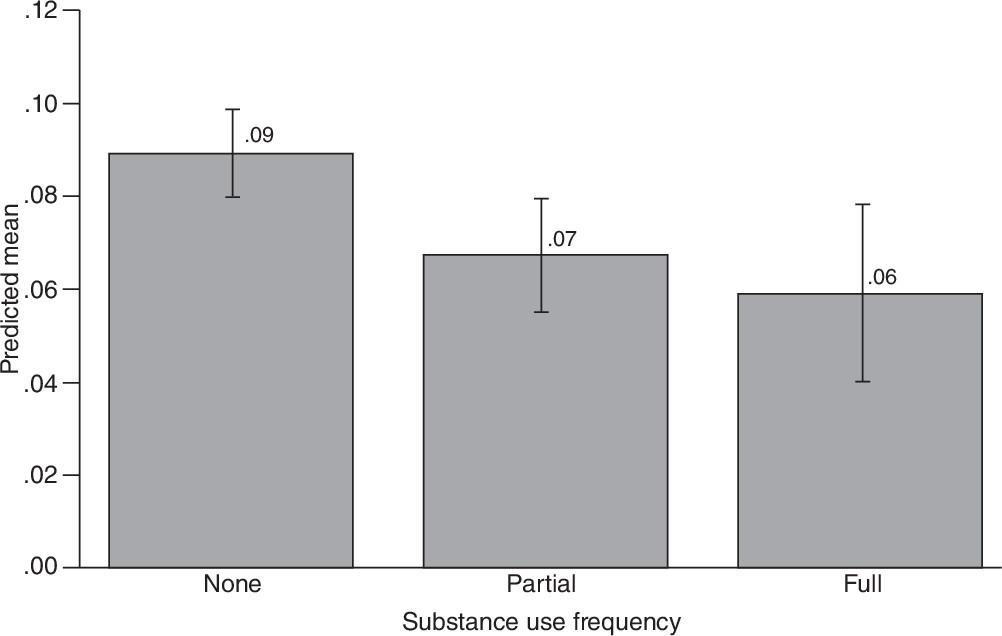
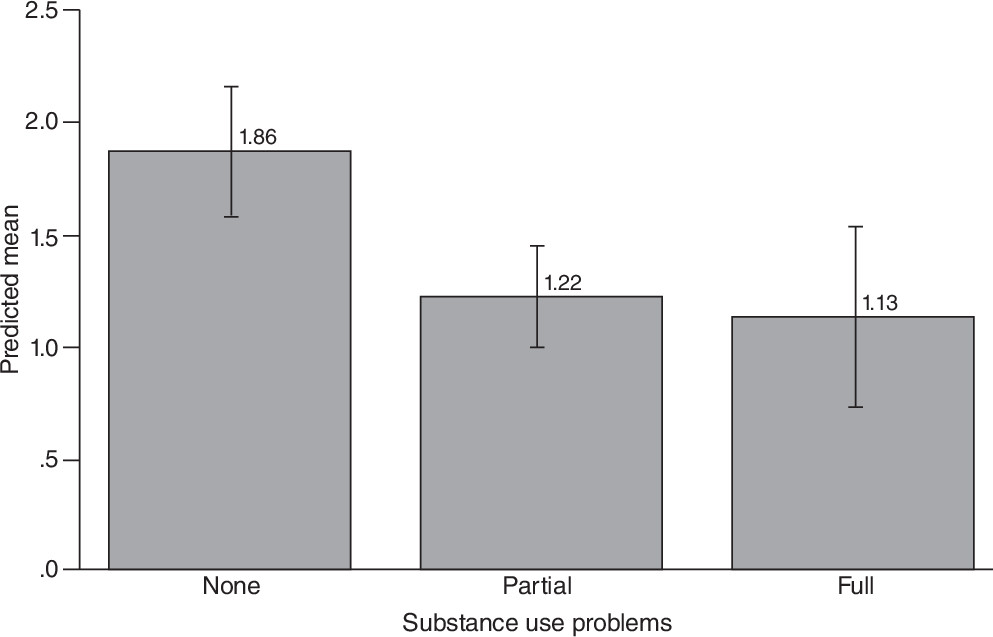
Predicted mean outcomes across the three groups for both substance use frequency and substance use problems are presented in
Figures 1 and
2, respectively; differences between groups are presented in
Table 2. Youths attending facilities providing mental health services used fewer substances and reported fewer substance use problems at 12 months than similar youths who attended facilities that did not provide mental health services. For example, the mean value on the Substance Problem Scale was 1.13 among clients attending facilities with full mental health services and 1.22 among clients attending facilities with partial mental health services compared with 1.86 for those with no mental health services—differences that were statistically significant (full versus none difference=.73, 95% confidence interval [CI]=.17–1.30; full versus partial difference=.64, CI=.25–1.03). However, youths from all three facilities were above the substance use problems threshold of 1.00 that may signify abuse, and all were below the substance use frequency threshold of .14 used to identify individuals who might have considerable difficulty stopping substance use without significant assistance or a controlled environment or both (
39). There was no statistically significant evidence of a difference between facilities offering full compared with partial mental health services on these outcomes.
Mental Health Outcomes
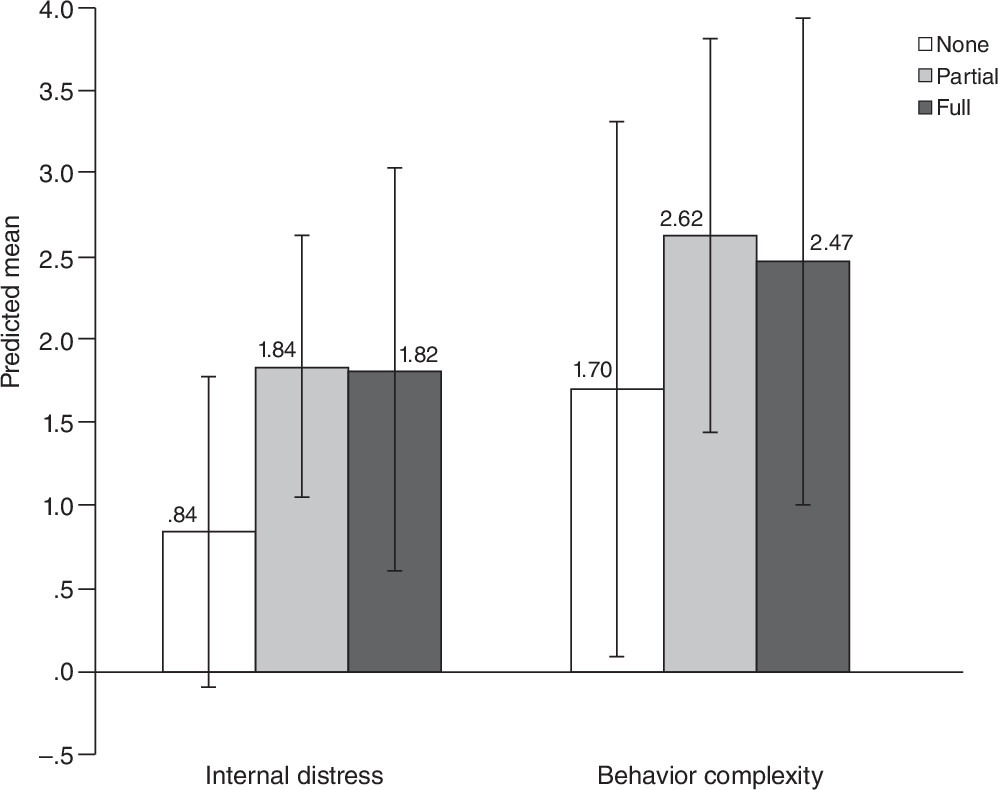
Differences between predicted mental health outcomes across the three facility types are presented in
Figure 3 and
Table 2. None of the differences were statistically significant.
Discussion
Quality indicators point to practices not universally implemented but known to correspond with better client outcomes (
7,
8); structural quality indicators are features of organizations related to the capacity to provide high-quality care (
40). Almost half of substance abuse treatment facilities do not offer mental health services, thereby meeting the criterion of not being universally implemented (
5). This analysis found preliminary support that this feature corresponds to better client outcomes: offering either full or partial mental health services was associated with better substance use outcomes compared with offering no mental health services. In a field with a notable absence of quality indicators, the availability of mental health services is a potentially meaningful quality indicator, although future research is needed to confirm these results.
The lack of evidence related to mental health outcomes is noteworthy, suggesting that simply offering mental health services does not necessarily translate to improved outcomes for adolescents receiving substance abuse treatment. There is a paucity of evidence-based treatment interventions for youths with co-occurring mental and substance use disorders (
25). Although some such treatments exist with proven benefits in experimental settings, the effectiveness of these treatments and adoption of these practices in community-based settings are unknown. More evidence-based treatments are needed for youths with co-occurring substance use and mental disorders. Research is also needed to better understand the specific types of mental health services currently used to treat youths in substance abuse treatment settings and how these services might be improved. In this study, the measures of full and partial mental health services were provided by administrative or clinical staff responding to a single survey item; more refined measures should be used to better specify such services.
An important limitation of this study was that we could not fully isolate the effect of the mental health service provision in our analyses because the groups differed on other characteristics measured at the facility level and possibly on unmeasured characteristics. Such differences do not necessarily invalidate provision of mental health services as a quality indicator to the degree that it is commonly offered with these other characteristics that are the causal factors associated with positive outcomes. However, if the relationships between provision of mental health services and other facility characteristics that are causally linked with improved outcomes are unique to our sample or could easily be disrupted if mental health service provision were used as a quality indicator, then such a use would be invalid. Although we could not examine this issue more fully in this study, we acknowledge this to be an important topic for future research.
Although this contribution provides important information, certain other limitations should be kept in mind. First, data from the study did not derive from a sample of youths in treatment settings designed to be representative of community-based treatment providers in the United States, and prior work indicates that CSAT-funded facilities may overrepresent programs that, on average, are more likely to offer ancillary mental health and HIV and other STD services (
5). Also, data from this study represent an 11-year time frame (from 1998 to 2008). Although these two features limit the generalizability of our findings, the analytic data set represents one of the largest longitudinal data sets of adolescent substance abuse treatment available in the United States. Furthermore, recent analyses of adolescent treatment facilities across a similar period showed little change in service provision (
5).
Another limitation was that the propensity score weights we estimated may not adjust for group differences on unmeasured variables, as well as those variables subject to measurement error. However, we were able to control for a large set of baseline variables, which reduced the risk of an omitted variable and measurement error bias (
41). Although our nonresponse weights made youths in our sample with 12-month outcomes look similar to the baseline sample of youths on 22 baseline characteristics, these weights did not protect effect estimates from attrition bias, which could have occurred if, for example, clients with the worst outcomes were most likely to be lost to follow-up. The challenge of retaining clients in substance abuse treatment studies has been noted (
42), and there is reason to suspect that clients with either superior or inferior outcomes are more likely than others to be lost to follow-up, limiting the types of sensitivity analyses that can be applied (
43).
Conclusions
Identifying quality indicators associated with superior clinical outcomes is one way to provide consumers with information about the effectiveness of treatment they or their children are likely to receive. This study raises many important questions for future research to consider, and we found initial evidence that clients receiving treatment at facilities offering mental health services report better substance use outcomes. We thus conclude that the provision of mental health services meets criteria and should be considered a potential quality indicator for facilities providing adolescents with substance use treatment.
Acknowledgments
This study was funded by grant 5R01DA017507 from the National Institute on Drug Abuse and supported by contract 270-07-0191 from the Substance Abuse and Mental Health Services Administration Center for Substance Abuse Treatment with data provided by several grantees. Details on contracts and grantees are available in the online supplement to this article.
The authors thank the grantees and their participants for agreeing to share their data to support this secondary analysis. The opinions about the data are those of the authors and do not reflect official positions of the U.S. government or individual grantees.
The authors report no competing interests.
