In psychotherapy, patient retention, or its opposite, dropout, is defined as a patient’s leaving therapy before receiving an adequate dose of treatment and is a common index of quality (
1). Estimates of dropout rates from meta-analyses of clinical trials vary from 20% to 47% (
2,
3), and over half of patients in health maintenance organizations who initiate psychotherapy receive only one or two sessions (
4). The use of retention as an index of treatment quality is consistent with the dose-response model of psychotherapy, which indicates that a minimum number of sessions is required for the majority of patients to show improvement (
5,
6). However, many patients benefit from very limited doses of treatment (four or fewer sessions) (
7), and patients who do not return for a second session are more likely to indicate extreme ratings of their treatment; that is, they are more likely to report very high or very low levels of satisfaction and improvement compared with their counterparts who continue in treatment (
4).
The finding that some patients benefit from less than the recommended dose of psychotherapy indicates that dropout may not necessarily represent a bad outcome for all patients (
8). As a result, the use of patient retention (dropout) statistics to evaluate provider performance may be misleading. In this study, we distinguished among episodes of general dropout by identifying patients who received limited treatment and reported positive experiences and outcomes (“good” dropout) and patients who received little treatment and reported negative treatment experiences and outcomes (“bad” dropout). We compared estimates of general dropout, good dropout, and bad dropout among providers. We hypothesized that providers would differ by number of general, good, and bad dropouts. We then explored the relative consistency of provider rankings on each outcome.
Methods
Patients were members of Group Health Cooperative (GHC) who received mental health services. GHC is a not-for-profit prepaid health plan serving approximately 600,000 members. GHC enrollment is similar to the area population in income, educational attainment, and representation of various racial and ethnic groups. Providers (N=316) included psychiatrists, psychologists, and master’s-level psychotherapists in clinic-based (N=80) or private practice (N=236) throughout Washington State and Northern Idaho.
GHC selected a random sample of visits from each therapist (up to ten visits per therapist per month). Surveys were mailed to patients within 30 days of the sampled visit, and patients who did not respond received up to two follow-up mailings. Visits by patients who had completed a survey within the previous six months were not surveyed. We selected all available surveys from psychotherapy visits occurring between March 2008 (when items for rating one’s improvement were added to the survey) and September 2010. The average number of ratings per provider was 9.67±13.66 (range 1–86). All procedures were approved by the Group Health Human Subjects Review Committee.
The Group Health Patient Experience Survey is based on items from the Experience of Care and Health Outcomes survey, the industry-standard survey of patient satisfaction with behavioral health care (
9). Overall satisfaction with treatment is assessed on an 11-point Likert scale ranging from 0, worst counseling or treatment possible, to 10, best counseling or treatment possible. Patient improvement is assessed with a single item, “Compared to when you first started seeing this clinician, how would you rate your problems and symptoms now?” The response is chosen from a 5-point Likert scale ranging from 1, much worse, to 5, much better. This single item is sensitive to changes in quality of depression care and is correlated with ratings obtained from more detailed clinical assessments (
10).
Dropout was operationalized as a new episode of care that was followed by no visits with the same provider in the subsequent 45 days after a surveyed encounter. A new episode of care was defined as a treatment encounter preceded by one or no visits to the same provider in the past 45 days. Next, we defined an episode of dropout as a bad dropout if overall satisfaction with treatment was rated ≤8 and global improvement was rated ≤3. In contrast, we defined an episode of dropout as a good dropout if satisfaction with treatment was rated 10 and global improvement was rated 5. Cut points were selected as a result of empirically examining the distribution of patient responses in our sample. Consistent with prior research on patient satisfaction (
11) and previous studies utilizing Group Health Research Institute data (
4,
12), patient responses to satisfaction items were highly skewed. Although the anchor of the satisfaction scale suggests that 8 is generally “good,” the actual distribution functions as a bimodal “excellent versus not” scale. A patient satisfaction rating of 8 on this scale was worse than 64% of all responses.
An analogous response pattern is seen in the distribution of responses to the clinical improvement scale. That is, although the behavioral anchor for a 3 on the overall improvement scale appears conceptually “neutral,” a patient rating his or her improvement as a 3 fell below the 81st percentile. Thus in order to meet criteria for bad dropout, a patient had to fall below both cut points. Of the 3,054 surveys analyzed, 149 (5%) were classified in this category. On the other side, a patient meeting criteria for good dropout meant that his or her improvement rating of 5 was above the 64th percentile, and his or her satisfaction rating of 10 landed above the 65th percentile. Of the 3,054 surveys analyzed, 277 (9%) were classified in this category.
We estimated differences among provider in numbers of general, good, and bad dropouts with Bayesian binomial mixed-effects regression models. To adjust for the potential influence of variability in the demographic characteristics of patients (case mix), the models were adjusted for patients’ age, gender, and primary diagnosis (depression, anxiety, bipolar disorder, substance use disorder, psychosis, and other). Specifically, we included covariates on the basis of the proportion of patients in each demographic category within a provider’s caseload (known as a grand mean–centered model). We used one million iterations, a burn-in of 10,000 iterations, and a thinning interval of 1,000 (
13). The mean and the highest posterior density (HPD) interval of the posterior distribution were used for point estimates and confidence intervals (
14). We used the Taylor-series approximation of the intraclass correlations (ICCs) for binomial models to estimate the size of differences among providers in treatment outcomes (
15).
Results
There were a total of 3,054 surveys from 2,931 patients. A number of patients (N=120, 4%) contributed two or three surveys (mean±SD=1.04±.21). The sample consisted of 2,082 (71%) female patients and ranged in age from 18 to 88 (mean±SD=48.04±15.25). The primary diagnoses were depression (N=1,696, 58%), anxiety (N=780, 27%), bipolar disorder (N=125, 4%), substance use disorders (N=63, 2%), psychosis (N=13, <1%), and other conditions (N=211, 7%).
Of the 3,054 treatment episodes, 1,032 resulted in dropout (34%), and of those, 149 (14%) episodes were classified as a bad dropout and 277 (27%) met criteria for a good dropout. Consistent with our hypotheses, there were provider differences in general dropout (ICC=.17, 95% HPD=.11–.25), good dropout (ICC=.10, 95% HPD=.04–.17), and bad dropout (ICC=.10, 95% HPD=.04–.18), indicating that providers accounted for between 10% and 17% of the variability across measures of dropout.
As noted above, all models were adjusted for differences among providers in case mix. [A table presenting the effects of differences in case mix on outcomes is available as an online supplement to this report.] Generally, differences in patient gender did not appear to have a significant influence on dropout of any type, whereas a higher proportion of patients aged 50 or older was associated with general and good dropout. Differences in primary diagnosis did not predict good dropout. However, the percentage of patients with diagnoses of bipolar disorder and psychosis as well as diagnoses categorized as other diagnoses was related to general dropout. Anxiety disorder and diagnoses categorized as other diagnoses predicted bad dropout.
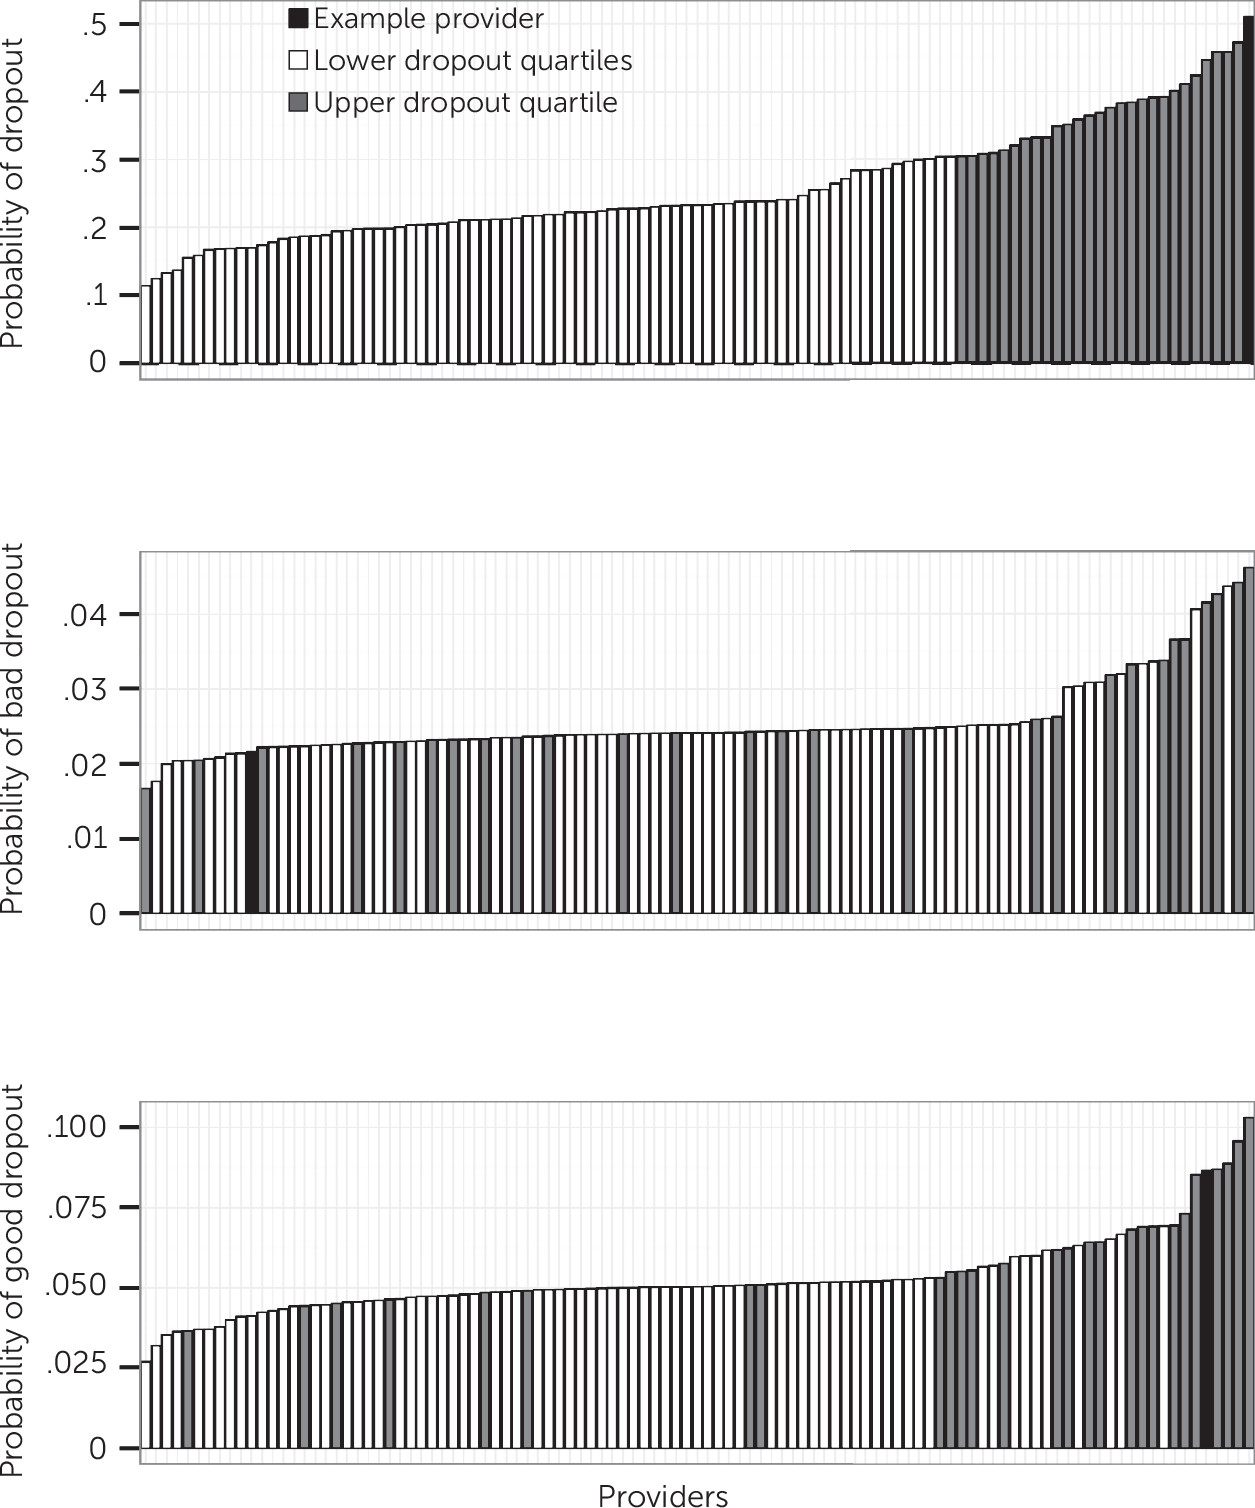
A provider’s ranking relative to his or her peers varied by outcome. Among the 79 providers ranked in the top quartile for overall probability of general dropout, only 34 ranked in the top quartile for bad dropout and 52 ranked in the top quartile for good dropout. Only 18 providers ranked in the upper quartile for each dropout outcome.
Figure 1 illustrates differences in predicted probability of general, good, and bad dropouts in a random selection of 50 providers. The provider with the highest predicted probability of general dropouts had among the lowest estimates of bad dropouts and among the highest estimates of good dropouts.
Discussion
Our findings suggest that patients’ persistence in treatment varies across providers, such that specific providers are more likely, on average, to have higher rates of general, good, and bad dropout. Provider ranking on these outcomes was inconsistent, given that some providers who had a generally low rate of retention may have treated patients who reported either doing quite well or doing very poorly. This indicates that nonspecific measures of retention are problematic indicators of provider performance. Evaluation of satisfaction and outcomes should complement retention metrics for providers.
Limitations of the findings described above included low response rates that are typical for mailed materials. However, previous work with similar patient survey data suggests that nonresponse did not bias satisfaction ratings (
12). In addition, these data were collected via patient report. Although a patient’s self-rating of improvement might not necessarily parallel the provider’s clinical assessment, it would be difficult to collect clinician ratings for patients who drop out of treatment, given that they are no longer attending sessions. Future studies could benefit from use of improved measures of patient response (for example, Patient Health Questionnaire–9 scores for patients diagnosed as having depression) and appraisal of patient-level factors, such as baseline severity, reason for dropout (for example, financial or logistical burdens), and treatment factors (for example, concurrent pharmacotherapy).
Conclusions
The use of dropout as a metric for provider performance may be misleading. Health systems designing measures of quality that are based on patient retention should seek to assess the treatment experiences of patients who discontinue treatment.


