Death rates from prescription opioid overdoses in the United States more than tripled between 1999 and 2012, creating an urgent need for policies that can effectively reduce the mortality and morbidity associated with opioid misuse (
1). The effectiveness of policies may depend, in part, on how providers prescribe opioids. If, for example, providers are uniform in the ways in which they prescribe opioids, then policies that broadly apply to all providers may be warranted. On the other hand, if a majority of opioids are obtained through a relatively small number of providers or a certain provider specialty, tailoring policy interventions to affect a narrower group of providers may be more effective than a broad-based application.
Opioid misuse is generally concentrated among patients who are prescribed higher volumes of opioids (
2–
5). However, less is known about variations in provider prescribing patterns and their implications. Heavy prescribing could be a marker for inappropriate use. In a recent study, opioid-related deaths were concentrated among patients treated by physicians who prescribed high volumes of opioids for each patient, although this study did not control for patient characteristics that could affect patient health outcomes (
6). On the other hand, high-volume providers could be associated with lower rates of opioid misuse and better patient outcomes because they specialize in pain treatment.
This study began with simple questions for which we had relatively little data: within a specified region and patient population, how concentrated are opioid prescribing and use, and does this concentration predict opioid misuse? Specifically, we sought to understand whether the top decile of providers and patients account for the majority of opioid prescriptions and tested the relationships of the opioid prescription concentration to indicators of opioid misuse.
We focused on Medicaid enrollees in Oregon. Compared with privately insured individuals, Medicaid patients are more likely to receive opioid prescriptions, at higher doses, and for longer periods (
7–
9) and to have higher death rates from overdoses (
10,
11). Oregon has taken a progressive stance in providing access to opioids for treatment of pain. The Oregon Intractable Pain Act of 1995 allows physicians to prescribe opioids for treatment of chronic pain at levels that can trigger sanctions from state medical boards elsewhere in the country (
12). This law has been celebrated by advocates concerned about inadequate pain treatment. Nonetheless, Oregon’s death and hospitalization rates from prescription opioid overdose increased more than fivefold between 2000 and 2011 (
13), leading to calls for policies to limit opioid prescribing. Although there has been widespread speculation about the ways in which opioids are obtained and subsequently abused, relatively little is known about the characteristics of the heavy user, and even less is known about different provider prescribing patterns. The goal of this study was to assess these patterns to provide insight for policies aimed at reducing opioid misuse in a vulnerable population of Medicaid enrollees.
Methods
Data
We used year 2013 data from Oregon Medicaid claims for opioid users’ demographic characteristics, health characteristics, and opioid use patterns, and we used National Provider Registry data for prescribers’ basic characteristics. We combined these two data sets with each provider’s National Provider Identifier, creating a patient-provider linked data set. We limited the sample to Medicaid beneficiaries who filled opioid prescriptions at least once in 2013 and to providers who prescribed an opioid for those beneficiaries. We further excluded patients who were diagnosed as having cancer at any time in 2013, who were not continuously enrolled in Medicaid, and who were eligible for Medicare. The final data set included 61,477 Medicaid beneficiaries.
Measures of Potential Opioid Misuse
We used four measures of potential opioid misuse to capture inappropriate opioid prescribing practices and patient behaviors. Each measure indicates whether the respective practice or behavior occurred at least once in 2013. Two measures reflect illicit patient behaviors: doctor and pharmacy “shopping” for opioid prescriptions. We defined doctor shopping as having received opioid prescriptions from six or more providers during one year, and we defined pharmacy shopping as getting opioid prescriptions filled from eight or more pharmacies within one year (
14). Previous studies found that doctor and pharmacy shopping were associated with opioid overdose (
14,
15).
We also used two indicators of inappropriate opioid prescribing practices: opioid prescription overlap (that is, at least one week of overlap for two prescriptions of the same opioid drugs from one prescriber or multiple prescribers) and opioid and benzodiazepine prescription overlap (at least a one-week overlap). All of the measures of prescribing practices have been used in previous studies (
16–
19).
Concentration of Opioid Prescriptions
We defined high-volume opioid users and prescribers as persons in the top decile in morphine-equivalent doses (MEQ) prescribed throughout the year (
8). With this definition, we used MEQ to make opioid doses comparable across products. We preferred MEQ to number of prescriptions as the measure of concentration because opioid doses differ across prescriptions. To calculate MEQ for each prescription, the quantity of pills or patches dispensed was multiplied by the strength of each pill or patch. We then multiplied this by an MEQ conversion factor. [A conversion table is available in the
online supplement to this article.] Last, we summed the MEQ of all prescriptions written throughout 2013 for each patient and prescriber.
Prescribers’ high annual MEQ could be attributable to multiple factors. For example, high-volume prescribers could prescribe a moderate amount of opioids for many patients. Alternatively, they might prescribe high doses of opioids for a moderate number of patients. To distinguish these two groups, in our sensitivity analysis we used an alternative definition of high-volume opioid prescribers: those in the top decile in annual MEQ prescribed per patient.
Other Variables
We controlled for patient age, gender, rurality (
20), and pain-related diagnoses (
21,
22). We also controlled for health conditions that often co-occur among opioid users, including depression, bipolar disorder, schizophrenia, alcohol-related problems, and drug-related problems (
23–
26). [A table in the
online supplement lists these conditions by
ICD-9-CM code.] For risk adjustment, we used the Chronic Illness and Disability Payment System indicators, which have been validated and used for risk adjustment in Medicaid populations (
27). We also accounted for each provider’s gender, entity type (sole or group practice), and provider type or specialty. Last, we controlled for each patient’s Medicaid health plan (
12).
Data Analysis
We conducted two sets of regression analyses. First, to examine to what extent high-volume opioid users were involved with opioid misuse, we estimated a patient-level regression of four measures of opioid misuse, controlling for a patient’s MEQ decile group, demographic characteristics, comorbid conditions, and Medicaid health plan.
The second set of regressions controlled for prescriber characteristics, including gender, entity type, and provider type or specialty. We also added an interaction term between a patient’s MEQ decile group and a dummy variable indicating whether the patient’s provider was a high-volume prescriber in the top MEQ decile. We considered this interaction term because opioid users’ experience of opioid misuse could be influenced by whether they received a prescription from a high-volume prescriber. In the second set of regressions, we did not examine doctor and pharmacy shopping as outcome variables because the number of doctors and pharmacies each patient visited for opioid prescription would be unlikely to be affected by the prescriber.
In the second set of regressions, we assigned one prescriber to each patient to take into account provider characteristics in the patient-level regression analyses. Many patients (44%) had more than one prescriber, however. For patients with multiple prescribers, we selected the provider who prescribed opioids the most times and accounted for at least one-third of the patient’s total number of prescriptions. On the basis of this assignment rule, 11,712 of the 61,477 patients (19%) were dropped from the original sample because they did not have a provider who met the listed condition. As a sensitivity analysis, we examined different assignment rules.
All regressions used a linear probability model instead of logit regressions to avoid a sample size reduction caused by perfect prediction. Standard errors were clustered at the provider level. All analyses were conducted with Stata 13.
Results
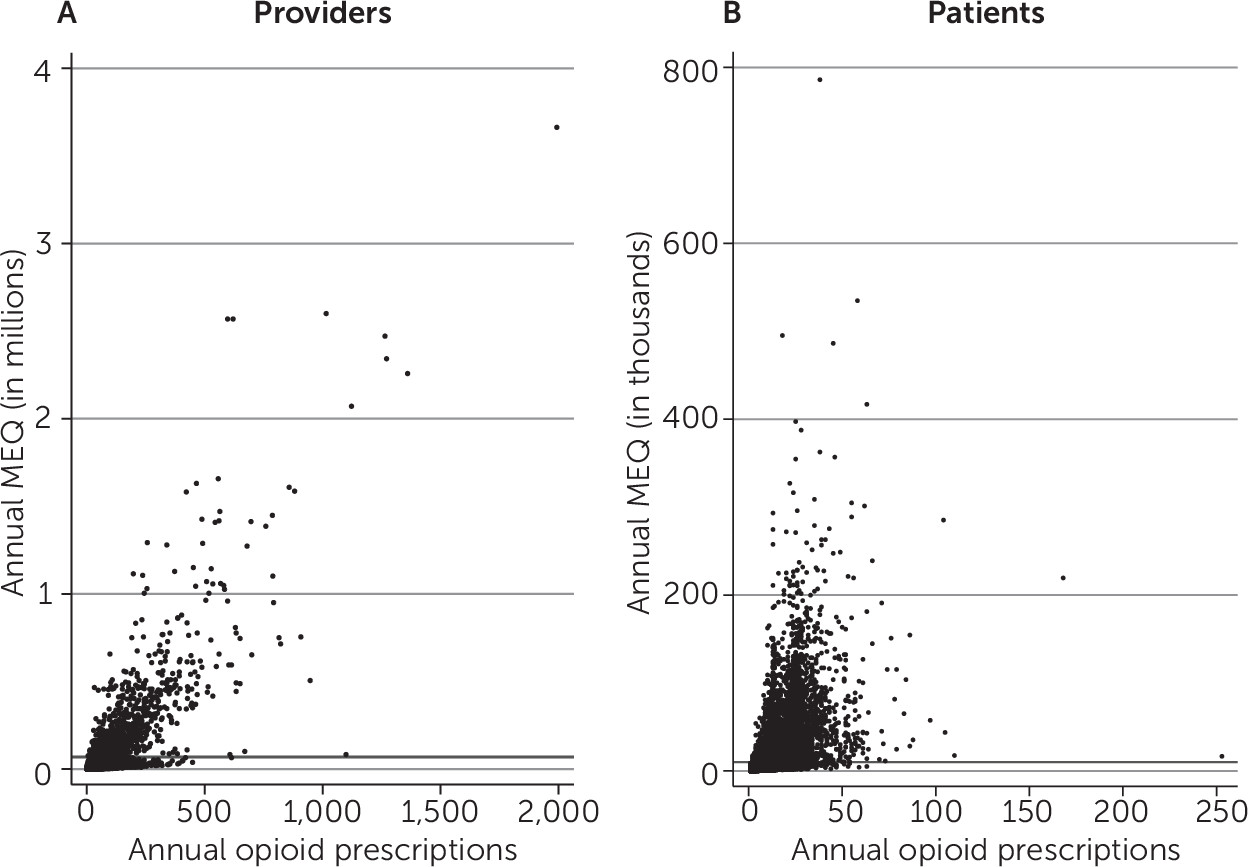
A relatively small share of providers accounted for a majority of all opioids prescribed. The top 10% of providers accounted for 80.8% of all MEQ provided to Oregon Medicaid beneficiaries. The top 1% of providers accounted for 43.4% of MEQ prescribed. As shown in
Figure 1A, a majority of providers (those under the top 10% reference line on the y-axis) prescribed relatively low amounts of MEQ. The average annual MEQ prescribed by providers in deciles 1–9 was 7,267; providers in the top decile prescribed an average annual MEQ of 275,503. High-volume opioid prescribers in the top decile also had prescription counts that were more than five times higher than the average counts of prescribers in deciles 1–9.
We found a similar concentration of opioid use among patients. The top 10% of patients accounted for 83.2% of all MEQ prescribed to Oregon Medicaid beneficiaries. The top 1% of patients accounted for 27.7% of MEQ prescribed. As shown in
Figure 1B, a majority of patients (those under the top 10% reference line on the y-axis) received relatively low volumes of MEQ. The average annual MEQ prescribed to patients in deciles 1–9 was 863; patients in the top decile averaged 38,368 annual MEQ and received eight times more prescriptions than those in deciles 1–9.
Table 1 shows characteristics of Medicaid beneficiaries who received no opioid prescriptions, opioid users in deciles 1–9 of MEQ received, and those in the top MEQ decile. Almost one in five (18%) Medicaid beneficiaries received prescriptions for opioids. Compared with individuals who received no opioid prescriptions, individuals with an opioid prescription were older, more likely to be female, and had higher rates of joint and back pain diagnoses as well as diagnoses of depression. The mean daily dose for individuals in the top decile was 87.6 mg MEQ, close to the 100-mg level, where overdose risks dramatically increase (
2,
19). Users in the top decile were far more likely to doctor or pharmacy shop and to have overlapping opioid prescriptions or overlapping opioid and benzodiazepine prescriptions.
Table 2 shows characteristics of providers who did not prescribe opioids, who were in the lower nine deciles of prescribing practice, and who were in the top decile of prescribing opioids. Two of three prescribers (66%) who wrote prescriptions for Medicaid patients prescribed opioids. Provider type and specialty varied substantially across all three groups. Lower-volume prescribers, or those in MEQ deciles 1–9, were more likely to be physicians in family medicine, internal medicine, or emergency medicine or to be dentists. Among high-volume prescribers in the top decile, however, the proportions of physicians in emergency medicine and dentists were significantly lower (<1%). About 63% of high-volume prescribers were physicians in family or internal medicine. High-volume prescribers had substantially different opioid prescription patterns. They prescribed opioids not only for more patients but also at higher doses per patient compared with lower-volume prescribers. About 96.8% and 68.1% of high-volume prescribers ever prescribed more than 100 mg and 200 mg MEQ per day for a patient.
Table 3 shows regression results for our four outcomes of interest (physician shopping, pharmacy shopping, opioid prescription overlap, and opioid and benzodiazepine overlap). Consistent with other studies (
2–
5), increasing MEQ was associated with most measures of opioid misuse after adjustment for patient demographic characteristics, comorbid conditions, and Medicaid health plan. For opioid prescription overlap and overlap of opioid and benzodiazepine prescriptions, the coefficients tend to increase as the amount of MEQ each patient obtained increased, and the increase becomes steeper among patients in MEQ deciles 9 and 10. The probability of opioid prescription overlap for patients in deciles 9 and 10 was 13.4 and 24.9 percentage points higher than for individuals in the first decile; the probability of opioid and benzodiazepine prescription overlap for patients in deciles 9 and 10 was 16.1 and 29.9 percentage points higher compared with individuals in the first decile. Given the average probabilities of these measures (4.4% and 6.9%), these discrepancies are relatively substantial. This suggests that high-volume opioid users were more likely to experience opioid prescription overlap and opioid and benzodiazepine prescription overlap. For doctor shopping, the coefficient increases steeply among patients in deciles 7 through 9 but then declines in decile 10. [Full regression estimates are provided in the
online supplement.]
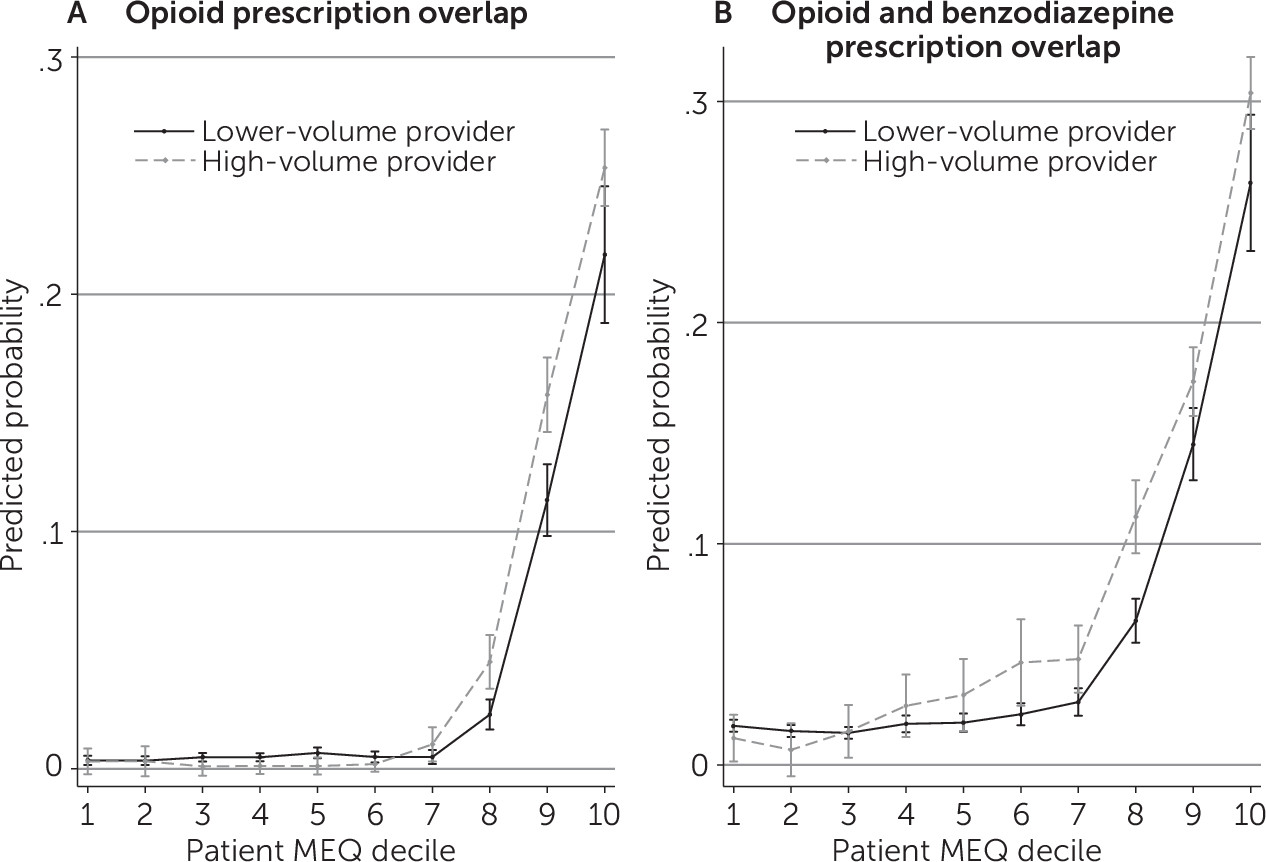
Figure 2 shows predicted probabilities of opioid misuse associated with obtaining prescriptions from lower-volume prescribers (deciles 1–9) and high-volume prescribers (decile 10). Patients receiving opioids from high-volume prescribers had a higher probability of overlap in opioid prescriptions and in opioid and benzodiazepine prescriptions, although the increase was significant only among patients who received high amounts of opioids (patients in MEQ deciles 8 and higher for overlap in opioid prescriptions and deciles 6 and higher for overlapping opioid and benzodiazepine prescriptions). The size of the increase was relatively small: 2.3–4.5 percentage points for overlap in opioid prescriptions and 2.5–5.3 percentage points for overlapping opioid and benzodiazepine prescriptions. These numbers are smaller than the increases in the probability of opioid misuse we found across patient MEQ group, but they are still significant. This result suggests that being treated by a high-volume provider was associated with higher probabilities of experiencing opioid misuse. [A chart of coefficients used to calculate the predicted values in
Figure 2 is available in the
online supplement.]
We defined high-volume prescribers as those in the top decile in annual MEQ. As a sensitivity analysis, we used a separate definition wherein providers were categorized as high-volume prescribers if they were in the top decile of annual MEQ per patient. We found similar results with this alternative definition (online supplement).
The analyses in
Figure 2 required us to assign patients to a single provider according to our rule of assigning the provider who prescribed the majority of opioids and accounted for at least one-third of each patient’s total number of prescriptions. This rule, however, resulted in dropping approximately 20% of our sample, which might have led to biased estimates. To address this concern, we conducted another sensitivity analysis using three additional assignment rules and found qualitatively similar results across the rules (
online supplement).
Discussion
Opioid prescriptions were common among Oregon Medicaid beneficiaries and their providers. Almost one in five beneficiaries filled at least one opioid prescription, and 66% of providers wrote at least one opioid prescription. Despite a high prevalence of opioid use among Medicaid beneficiaries, opioid use and prescriptions were heavily concentrated among the top 10% opioid users and prescribers. Those high-volume opioid users and prescribers accounted for 83.2% and 80.8% of MEQ of all opioids prescribed, respectively. This concentration of use among patients in Oregon is higher than what was observed in a similar study of the Arkansas Medicaid population, which found that patients in the top decile were prescribed 62.9% of opioids (
8). The concentration in prescription among Oregon providers, however, was slightly lower than the corresponding concentration among the California workers’ compensation system (86.8%) (
28).
High-volume prescribers were more likely to be physicians in family or internal medicine, nurse practitioners, or physician assistants. They prescribed higher daily doses of opioids for more Medicaid patients. Among high-volume prescribers, 96.8% had ever prescribed >100 mg MEQ per day, and 68.1% had ever prescribed >200 mg MEQ per day. Given that the risk of opioid overdose death increases at 100 mg MEQ per day, the high percentage of providers prescribing daily doses of ≥100 mg may be of concern (
19), although these high dosage amounts may be attributable to providers who treat patients with health conditions that require higher doses of opioids.
Overall, opioid misuse was more likely to be found among high-volume opioid users. The probability of three types of misuse—opioid prescription overlap, overlap of opioid and benzodiazepine prescription, and pharmacy shopping—tended to increase with the amount of MEQ obtained by patients. Opioid users’ probability of opioid misuse increased when opioids were prescribed by a high-volume prescriber instead of a lower-volume one, although this finding applied only to the group of patients receiving the highest amount of opioids. Although our analyses measured association only, these findings suggest that provider prescribing patterns may be a risk factor for patients who obtain large amounts of opioids. These results suggest potential gains from interventions that target prescription patterns among high-volume opioid users and prescribers.
Opioid policies frequently focus on patient behavior. For example, prescription drug monitoring programs to reduce opioid misuse, which currently are used in 49 states, including Oregon (begun on June 1, 2011), monitor patients’ opioid use within a state (
29,
30). This effort is valid given the substantial discrepancy we found in probabilities of opioid misuse across patients with different MEQs. Many Medicaid agencies implemented patient lock-in programs, limiting patients at a high risk of opioid misuse to one prescriber and pharmacy to prevent opioid misuse (
31,
32). However, our results suggest that policies specifically focusing on providers also may be beneficial. In Oregon, several organizations have developed educational materials to improve opioid prescribing. For example, a group of providers created and disseminated opioid prescribing guidelines (
33). The state government also hosted education sessions on safe opioid prescription (
12). Other educational interventions, such as provider profiling and academic detailing, may also be effective at improving opioid prescribing (
34,
35). Regulatory interventions, such as monitoring for adherence to guidelines, might further reduce opioid misuse. Ideally, these policies would not inhibit access to opioids that provide safe and reliable pain management.
One intervention to reduce opioid overdoses without inhibiting access could be to encourage high-volume providers to coprescribe naloxone with opioid prescriptions. Naloxone is an effective overdose rescue medication (
36), but it is likely underprescribed partially due to physicians’ reluctance or lack of knowledge. Physician training on the efficacy of naloxone and policies addressing provider’s legal and social concerns about naloxone prescription can facilitate the distribution of naloxone (
37).
Our study had limitations. It included data only from Medicaid patients. Unlike studies that used data from prescription drug monitoring programs, this study cannot clarify whether the same patterns of prescribing exist in the commercially insured and Medicare populations. Thus our results should be interpreted with only the Medicaid population in mind. Our data are also from just Oregon, and generalizability to other states could be limited. Also, the data do not reflect opioids obtained illegally (
38,
39). There could be other factors for which we did not or could not control that are correlated with indicators of opioid misuse, which could bias estimates.


