Autism spectrum disorder (ASD) is a neurobehavioral condition characterized by persistent difficulties with interpersonal communication and interaction as well as restrictive and repetitive patterns of behavior (
1). Between 2004 and 2014, the estimated prevalence of ASD increased from 6.7 to 16.2 per 1,000 children (
2). The rising prevalence calls for new developments in health service delivery to ensure that affected youths receive timely access to evidence-based interventions such as applied behavior analysis (ABA).
ABA uses behavioral learning principles to help children with ASD decrease maladaptive behaviors and increase positive social interactions (
3). It is supported by more than 30 years of research (
3) and is the treatment of choice for children with ASD (
4). Research suggests that ABA should be delivered from early childhood and for 20–40 hours per week to yield the best outcomes (
3).
Forty-eight states and Washington, D.C., have mandated that private health insurance plans provide coverage for the diagnosis and treatment of ASD, including ABA therapy (
5). Research has shown that ASD service utilization increased following these mandates, but obstacles in implementation have been noted (
6). Key informants in a qualitative study identified the lack of providers in private insurers’ networks as a main barrier to increased service utilization (
6).
To date, there is a dearth of information on the supply of providers of autism treatment. In this study, we address this gap by using national data to examine the supply of and variation in certified ABA providers in the United States. We discuss our findings in light of recent policy efforts that aim to improve access to ASD services.
Methods
We obtained state-level data on the total number of certified ABA providers from the online database of the Behavior Analyst Certification Board (the Board) in March 2018 (
7). The Board was established in 1998 to form professional standards to credential ABA providers worldwide (
8). It certifies analysts at the doctoral level (BCBA-D) and the master’s level (BCBA) as well as assistant analysts at the baccalaureate level (BCaBA) (
7). BCBAs and BCBA-Ds are considered the most qualified ABA providers by policy makers (
9,
10) and consumers (
4). Moreover, BCBAs and BCBA-Ds are specifically listed as eligible for reimbursement in the insurance mandates in 39 states (
10).
The Board provides guidelines on the maximum caseload for certified behavior analysts under two scenarios (
8). In the first scenario, an analyst can provide “focused treatment,” which targets discrete behavioral goals such as increasing instruction following or decreasing self-injury behavior. In the second scenario, an analyst can provide “comprehensive treatment” to improve multiple developmental domains and overall functioning (
8). The recommended maximum caseload for focused treatment is 15 children per analyst without the support of an assistant, or 24 children per analyst with an assistant (a 60% increase in caseload). The recommendation for comprehensive treatment is 12 children per analyst without an assistant, or 16 children per analyst with an assistant (a 33% increase in caseload) (
8).
We used the Board guidelines to calculate the average caseload capacity for ABA providers while giving consideration to the national supply of certified analysts (N=25,591) and certified assistant analysts (N=1,979) in March 2018 (
7). Given these numbers, we assumed approximately 7.7% of behavior analysts received support from an assistant, yielding an average maximum caseload of approximately 15.7 children per analyst in focused therapy and approximately 12.3 children per analyst in comprehensive therapy. At these rates, a minimum of 6.4 and 8.1 behavior analysts are needed for 100 children with ASD who require either focused or comprehensive treatment, respectively. In our sensitivity analysis, we assumed that the caseload capacity for behavior analysts was double that of the Board guideline, and we obtained new benchmarks of 3.2 and 4.1 analysts per 100 children with ASD in either focused or comprehensive treatment, respectively (
online supplement).
Next, we used the supply of certified ABA providers and assistants in each state in conjunction with the caseload capacity guidelines for focused treatment to estimate the per capita supply of analysts in each state. First, we summed the total number of analysts with a graduate degree (i.e., BCBA-D and BCBA) in each state (
8). Then, we multiplied the number of certified ABA assistants (i.e., BCaBA) in each state by 0.6 and added this number to the overall number of certified ABA providers to calculate the total per capita supply of analysts. We used the caseload guidelines for focused treatment instead of comprehensive treatment to produce more conservative estimates of the difference between the supply of certified ABA providers and the benchmarks.
Finally, we estimated the number of children with ASD in each state to use as the denominator when calculating the per capita supply of certified ABA providers. We multiplied the number of children age 18 or younger in each state, derived from the U.S. Census Bureau’s 2017 population estimates (
11), by the most recent prevalence ratio of childhood autism by the Centers for Disease Control and Prevention (
2). We focused on children because ABA was designed primarily for children (
3) and has been shown to produce positive outcomes if started by early childhood (
12).
We examined variation in the per capita supply of certified ABA providers across four census regions (
13), by state public education spending, and by state-level socioeconomic status. State public education spending comes from the per pupil spending data for public elementary and secondary school systems in the U.S. Census Bureau’s 2016 Annual Survey of School System Finances (
14). We estimated state socioeconomic status using median household income data from the U.S. Census Bureau’s 2016 Small Area Income and Poverty Estimates Program (
15).
To contextualize our findings, we also examined the supply and distribution of other types of health and mental health providers. We downloaded data from the 2016–2017 Area Health Resource Files on speech-language pathologists, counselors and psychologists, and nonfederally employed psychiatrists with a Doctor of Medicine (M.D.) degree (
16). We used information on the total population in each state (
11) to calculate per capita ratios for each type of health care provider.
Using Wald tests and Pearson correlation coefficients (if applicable), we examined bivariate associations between state-level per capita supply of ABA providers and census region, state public education spending, and state median household income. We compared the variations in the supply of ABA providers and in other types of providers by examining coefficients of variation. We conducted data analyses using Stata, version 15.1 (
17).
The study was conducted between March 1, 2018, and July 1, 2019. The institutional review board at Emory University determined that this study did not constitute human subjects research.
Results
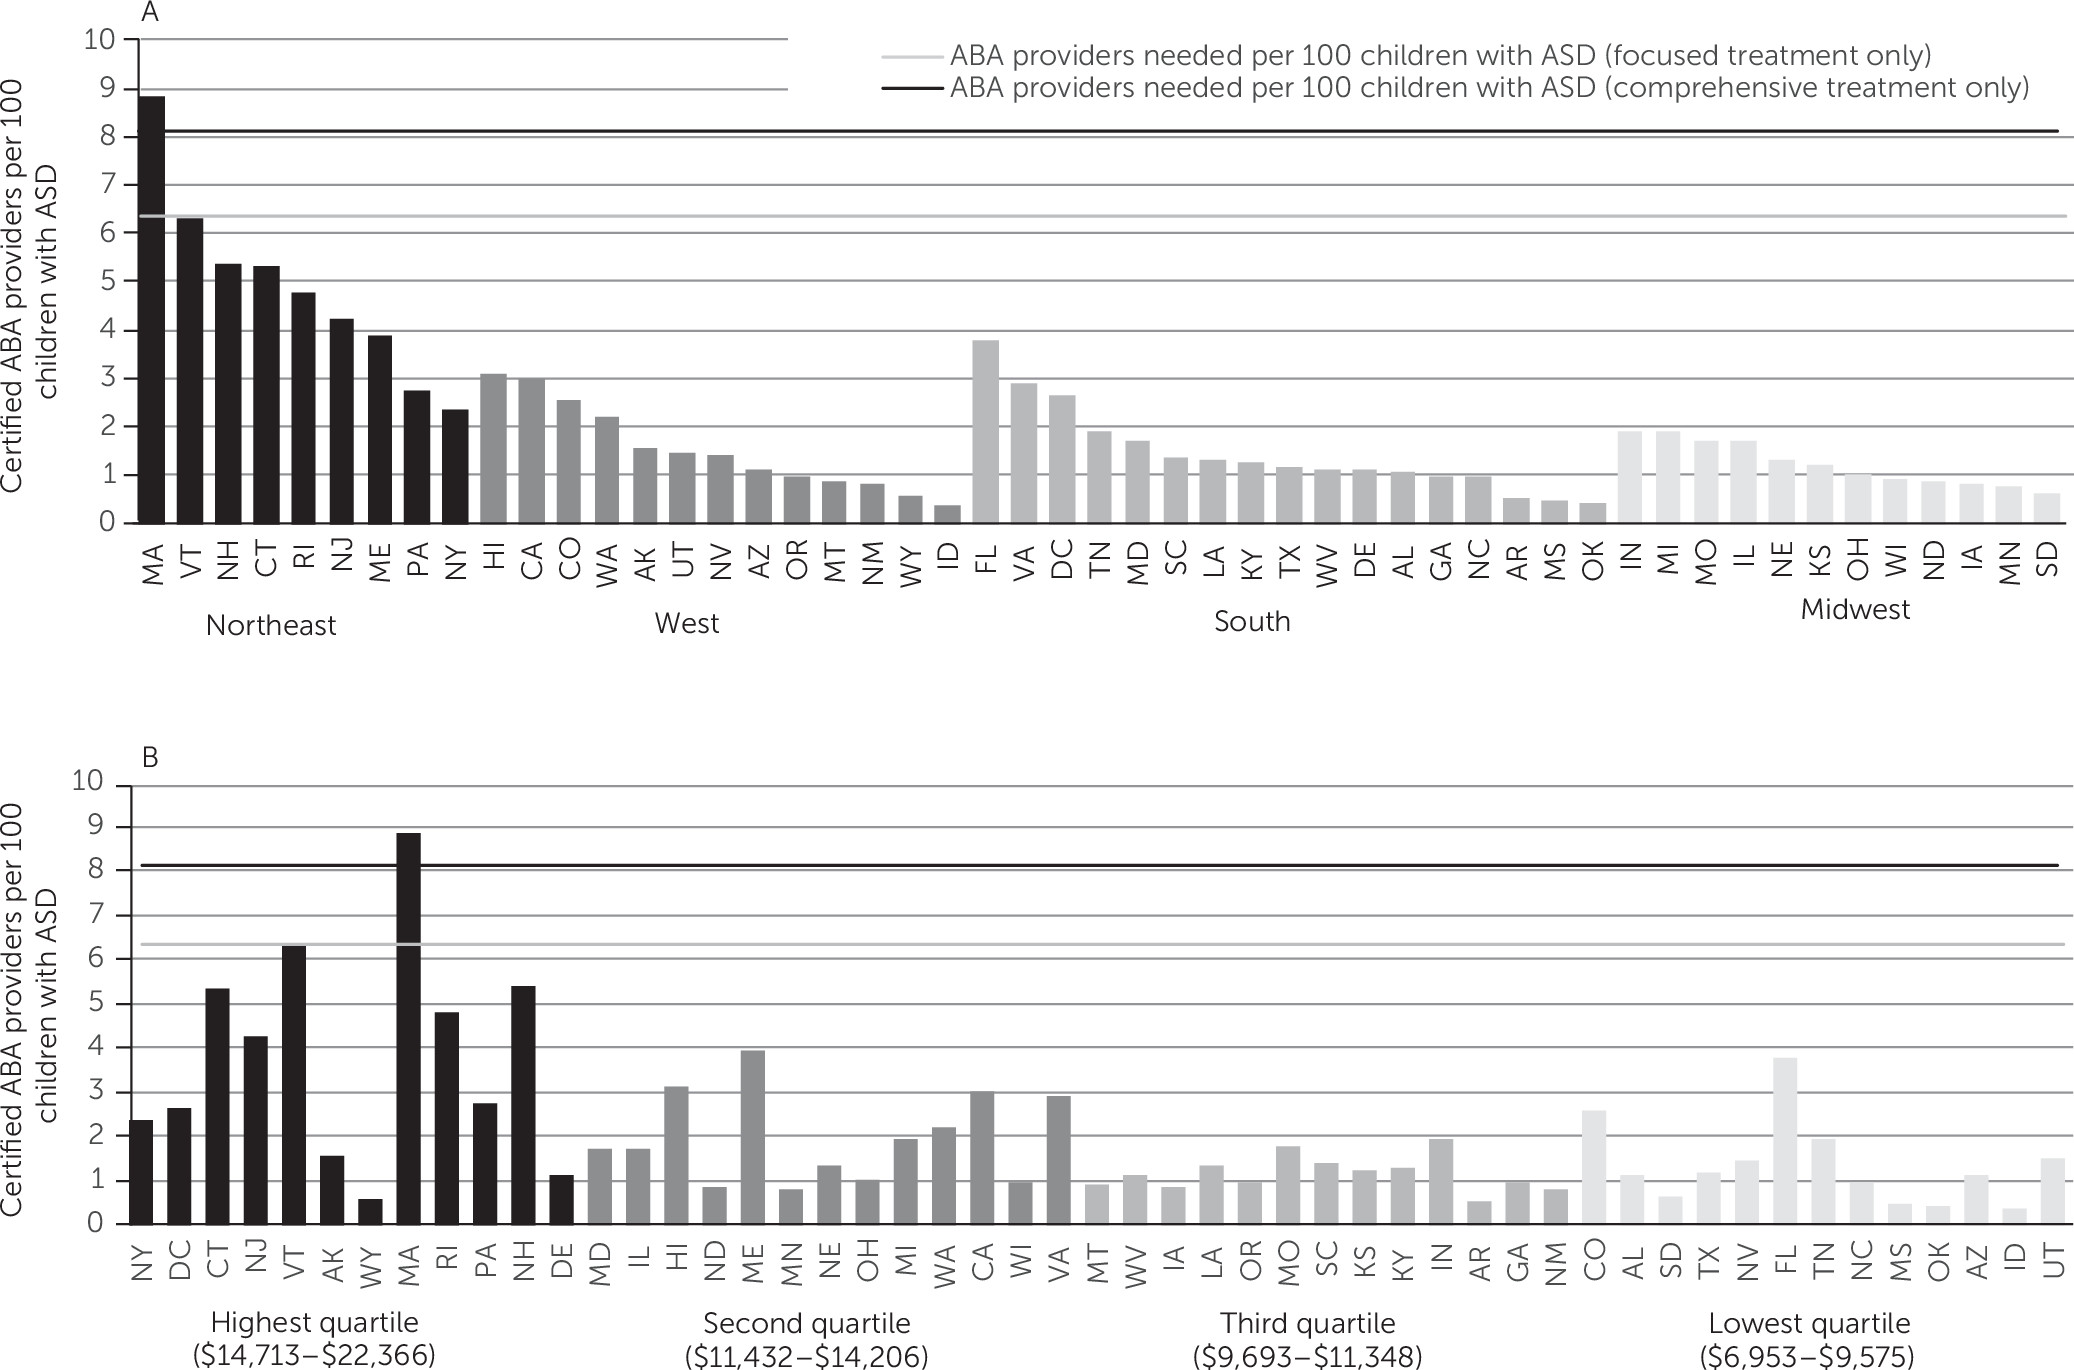
The supply of certified ABA providers fell short of the benchmark in 49 states and Washington, D.C., assuming all children with ASD require only focused treatment (
Figure 1). Massachusetts had the highest per capita supply of certified ABA providers (8.8 ABA providers per 100 children with ASD), and it was the only state in which the supply exceeded the benchmark. In the sensitivity analysis with the adjusted benchmark (assuming that ABA providers’ average case capacity is twice as much as the Board guidelines), the per capita supply of certified ABA providers fell below the benchmark in 42 states and Washington, D.C. (see
online supplement).
The supply of certified ABA providers varied across the four census regions (
Figure 1, panel A), by state public education spending (
Figure 1, panel B), and by state median household income (
online supplement). The Northeast had a significantly higher number of ABA providers per capita than any other region (p<0.001) (see
online supplement). As shown in
Figure 1, panel A, seven out of nine states in this region had the highest supply of certified ABA providers in the entire United States. Additionally, states with public education spending in the highest quartile had significantly more certified ABA providers per capita than states in the lower quartiles (p<0.05) (see
online supplement). Similarly, we found a positive relationship between state-level median household income and the supply of certified ABA providers (p<0.001) (see
online supplement).
The per capita supply of certified ABA providers was slightly lower than the supply of psychiatrists and was substantially lower than the supply of psychologists and counselors combined in all regions (see online supplement). Regional variation in the supply of ABA providers was more pronounced than for other types of providers (see online supplement).
Discussion and Conclusions
We found that the per capita supply of certified ABA providers fell below our benchmark informed by the Board guidelines in 49 states and Washington, D.C. Under the alternative assumption that the caseload capacity of ABA providers is double that of the Board guideline, the supply of ABA providers fell below the benchmark in 42 states and Washington, D.C.
Our findings also document substantial state and regional variation in the per capita supply of certified ABA providers. Although autism insurance mandates have increased overall utilization of ASD services, it is possible that states with a higher supply of ABA providers (such as those in the Northeast) may have had greater increases than the other states. In future studies, researchers should investigate whether increases in the supply of ABA providers strengthen the impact of state autism mandates on ASD service utilization. The positive correlation between state-level public education spending and supply of ABA providers may be partially explained by the fact that approximately 12% of certified ABA therapists were employed in the education sector (
7). Additionally, the positive correlation between state median household income and ABA provider supply is consistent with research showing positive associations between community-level socioeconomic status and mental health provider supply (
18). Nevertheless, the data are cross-sectional, and causality cannot be inferred. In future studies, researchers may build upon these findings and examine potential policies and environmental changes that affect ABA supply over time.
The study had several limitations. First, there was no information available about the supply of ABA providers who are not certified by the Board. However, we note that credentialed behavior analysts are the most qualified to conduct ABA (
4,
9,
10) and that an improved understanding of the supply of certified ABA providers is critical for enhancing access to ABA treatment that meets professionally recognized standards. Second, the database does not provide information on the share of certified ABA providers not providing direct clinical care. For example, some providers may work in the school system as special education evaluators (
7). In addition, not all providers are financially accessible to children who need treatment because many do not accept insurance because of the low reimbursement rates and administrative burden (
6). Another limitation was the lack of data at a smaller geographic unit than the state (e.g., the county) to allow assessment of variations in the supply of certified ABA providers across local communities.
In spite of these limitations, this study provides the first known examination of the supply and geographic variation in certified ABA providers. Given the increasing prevalence of ASD among youths, new workforce policies may be needed to improve the supply of ABA providers in the United States to meet the needs of this population.


