Hispanic individuals have accounted for more than half of the total population growth in the United States between 2010 and 2019, and the total Hispanic population surpassed 60 million individuals in 2019 (
1). The U.S. Census Bureau has projected that the Hispanic U.S. population will reach 111 million by 2060, which will account for 28% of the total population (
2). The proportion of Hispanic individuals in the population and the rate of growth of Hispanic populations have varied across states. Texas, California, and Florida had the largest Hispanic populations in 2019 and also had the largest increases in the number of Hispanic residents between 2010 and 2019. However, North Dakota and South Dakota exhibited the largest relative increases in the number of new Hispanic residents, with both states experiencing growth rates of >50% over 10 years (
3). These population changes have precipitated new and evolving demands on the health care system, which are nuanced and driven by a range of factors, including fluency in English and Spanish (
4,
5), immigration and documentation status (
6,
7), being first- or second-generation residents in the country (
8), and exposure to trauma related to racism and discrimination (
9,
10).
Disparities in behavioral health risk factors in the past decade have also grown and closely parallel the overall growth in the Hispanic population (
11–
13). From 2015 to 2018, rates of serious mental illness in Hispanic populations increased by 60% (from 4.0% to 6.4%) among those ages 18–25 years and by 77% (from 2.2% to 3.9%) among those ages 26–49 years (
14). This report was based on analysis of the National Survey on Drug Use and Health and used the Substance Abuse and Mental Health Services Administration’s (SAMHSA’s) definition of serious mental illness as a diagnosable mental, behavior, or emotional disorder that causes serious functional impairment that substantially interferes with one or more major life activities (
15). A similar trend between 2015 and 2018 has been observed for the prevalence of major depressive episodes among Hispanics ages 12–49 years, which increased from 8.4% to 11.3% (
14). In a study based on data from the Behavioral Risk Factor Surveillance System, more than one-third (34%) of Hispanic respondents reported at least one poor mental health day in the past month (mean=3.6 days), and 11% reported frequent mental distress (
16).
Despite the growing need for behavioral health care among Hispanic populations, the utilization of mental health services remains low in these populations. Use of mental health services is low among all racial-ethnic groups and particularly low among Hispanics compared with Whites (
12,
17–
19). Broadly, perceived need for treatment is a strong driver of treatment use (
20). Breslau and colleagues (
5) found that a perceived need for mental health treatment was lowest among both English- and Spanish-speaking Hispanic adults compared with adults in other racial-ethnic groups, after adjusting for severity of the mental health problem. Similarly, Green et al. (
21) reported that, among adults with a past-year psychiatric disorder, nearly 60% of Hispanics reported no need or a low perceived need for treatment (compared with only 40% of Whites). Additionally, analyses of data from the National Latino and Asian American Study indicated that only one in three Hispanics with a psychiatric disorder used any mental health services in the past year (
22). Among Hispanics in California who had a past-year mental health problem, 31% reported racial discrimination in mental health care settings, and discrimination was associated with a sentiment that treatment was not helpful (
23).
Culturally responsive health care, which incorporates an understanding of culture and language into clinical mental health practice (
24), may be one strategy to increase treatment uptake in Hispanic populations. A treatment provider’s competency in the patient’s primary language improves communication and allows for a more nuanced and personal discussion (
25). With the growing Hispanic population in the United States, a lack of providers who speak Spanish is a major barrier to health-seeking behavior. In 2015, the American Psychological Association estimated that only 5.5% of practicing psychologists provided services in Spanish (
26), but the study did not report on other types of mental health treatment providers. Spanish-language concordance between a provider and patient improves privacy, trust, and communication. The ways in which Spanish-speaking clients of mental health services express emotions and describe symptoms also vary depending on their own level of comfort with English and on the Spanish fluency of the provider (
27).
There is a pressing need to increase the presence of Spanish-speaking mental health providers in the United States in order to respond to the growth of the Hispanic population and minimize barriers to treatment. However, little is known about national changes in the availability of mental health services in Spanish. Therefore, the purpose of this study was to use clinic-level national mental health data to investigate treatment availability in Spanish and explore whether facilities offering services in Spanish varied by state and over time.
Methods
Data Source and Sample
We used annual, repeated cross-sectional data from the National Mental Health Services Survey (N-MHSS) collected in 2014 (N=13,015 facilities) and 2019 (N=12,345 facilities) to identify whether facilities employed clinical staff who provided services in Spanish. The N-MHSS is planned and directed by the Center for Behavioral Health Statistics and Quality, which is housed within SAMHSA. In brief, the N-MHSS includes data on characteristics of all known public and private facilities in the United States that provide mental health treatment. Administrative representatives from each facility completed an annual survey about the services the facility provided. In 2019, the response rate among facilities eligible to participate was 91% (
28). The present study was a secondary analysis of publicly available administrative data describing characteristics of mental health facilities. As such, no institutional review board approval was needed because no human subjects participated in this study, and no individual-level data were available or used.
Variables
Our main variable of interest was whether facilities offered mental health services in Spanish. Survey respondents answered yes or no to the following question: “Do staff provide mental health treatment services in Spanish at this facility?” We also included a variable representing the percentage of a state’s population that identified as Hispanic. We used annual 5-year estimates of the proportion of states’ Hispanic residents for the years 2014 and 2019, derived from the American Community Survey (
29).
Analysis
We used SAS, version 9.4 (
30), to generate temporal descriptive statistics for mental health services in Spanish as well as for the proportion of states’ Hispanic residents. Graphics were created with Tableau, version 2020.3 (
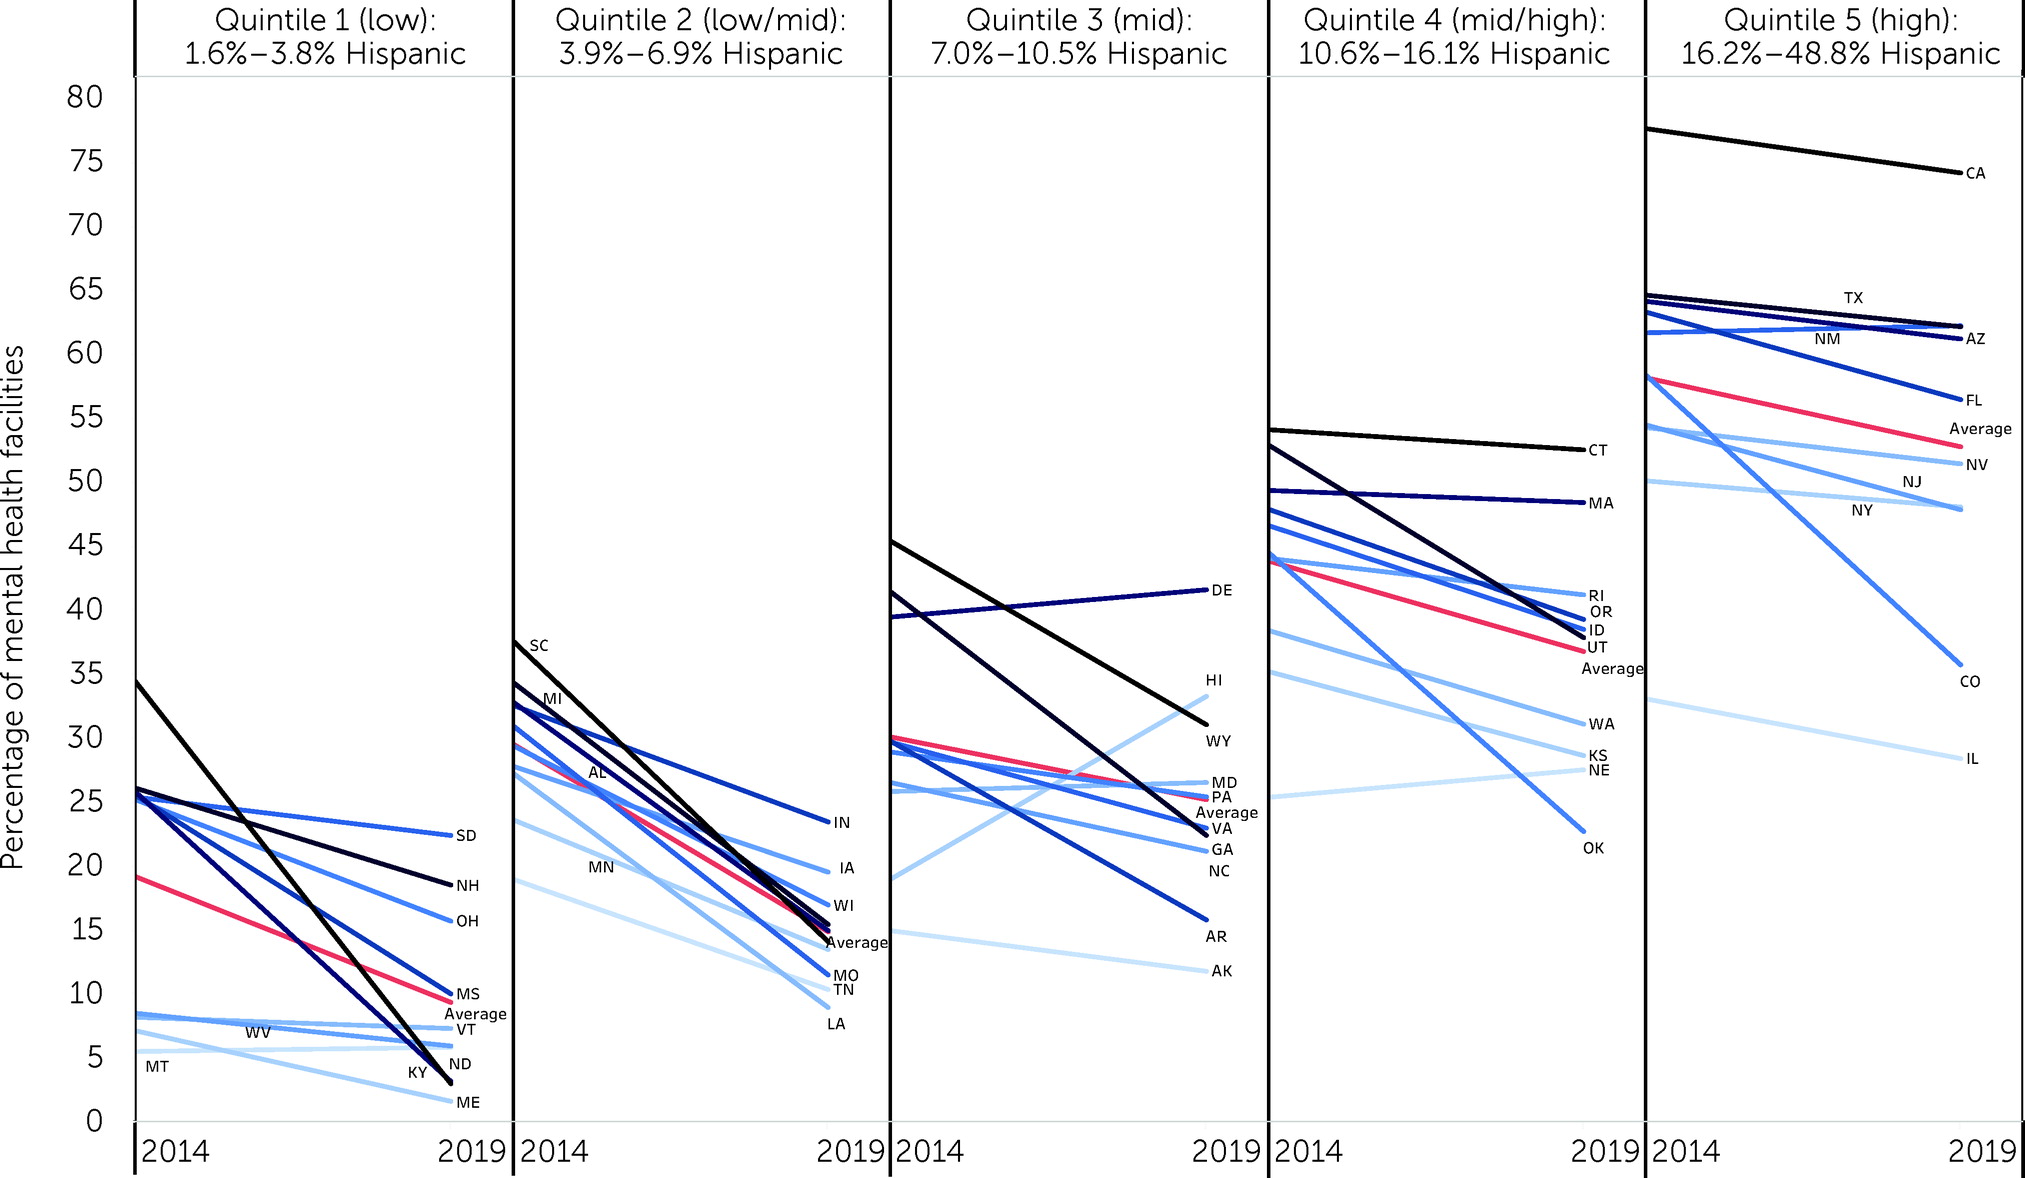
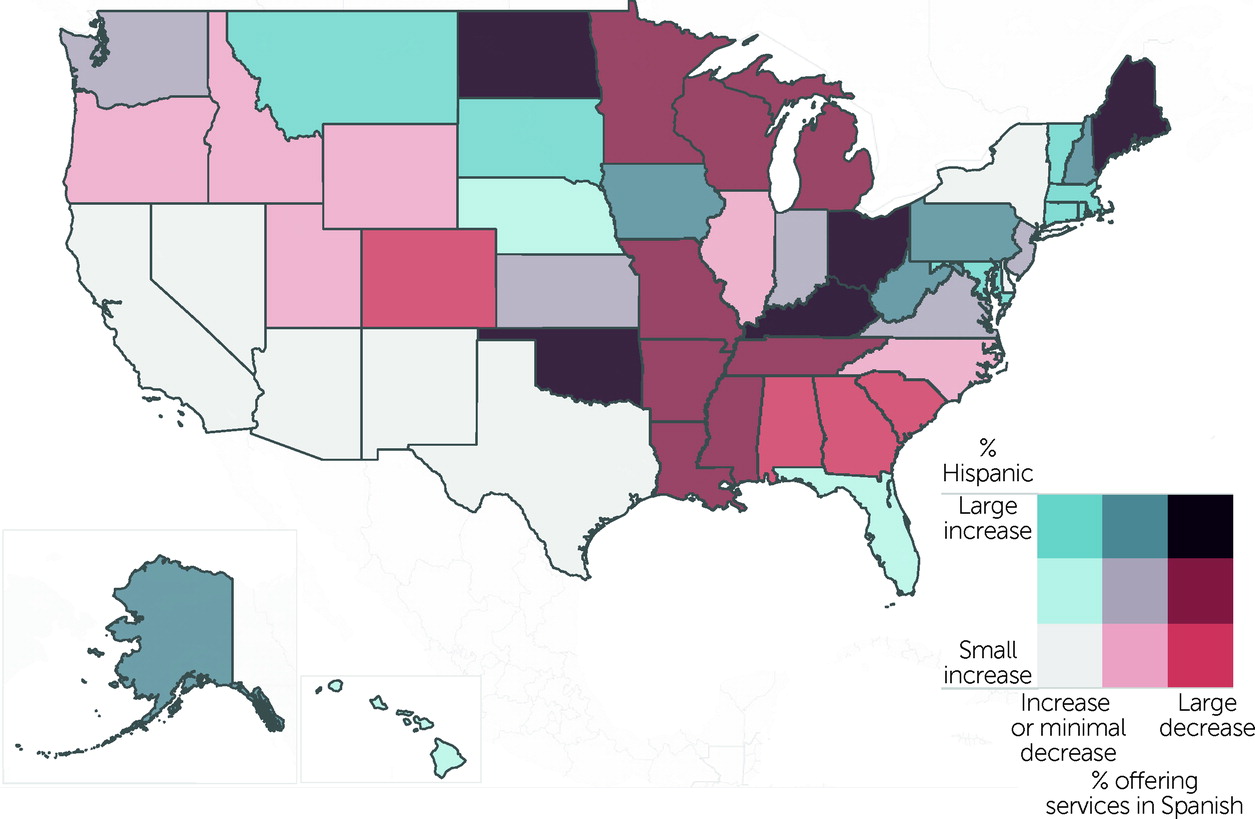
31). We calculated the national mean, minimum, median, and maximum estimates for both variables (the percentage of mental health facilities offering services in Spanish and the percentage of the population that was Hispanic) in both years. We plotted the percentage of mental health facilities offering services in Spanish for each state in 2014 and in 2019 to visualize changes over time, stratified by quintiles of the proportion of states’ Hispanic residents (Q1, low [1.6%–3.8%]; Q2, low-to-mid [3.9%–6.9%]; Q3, mid [7.0%–10.5%]; Q4, mid-to-high [10.6%–16.1%]; and Q5, high [16.2%–48.8%] proportion). We created a bivariate choropleth map of the United States to illustrate geographic and temporal trends of changes in mental health services in Spanish and changes in the proportion of states’ residents who were Hispanic. We calculated the relative difference in Spanish services between 2014 and 2019 as well as the relative difference in Hispanic population share between 2014 and 2019 and grouped the differences into tertiles for each variable. The resulting map included nine possible combinations of a state’s small, medium, or large growth in its Hispanic population and a state’s small or no, medium, or large decrease in the percentage of mental health facilities offering services in Spanish.
Supplemental Analysis
We conducted two supplemental analyses for this study. To better understand estimates for states with large Hispanic populations, we reported additional estimates for the 10 states with the highest proportion of Hispanic residents in 2019 and for the 10 states with the fastest growth in the percentage of the population that was Hispanic between 2014 and 2019. Specifically, for each state we calculated the percentage change in Hispanic population as well as the percentage change in health facilities offering services in Spanish between 2014 and 2019 (see Table S1 in the
online supplement). We also calculated the number of mental health facilities offering Spanish services per 100,000 Hispanic state residents for all 50 states (see Table S2 in the
online supplement).
Results
Between 2014 and 2019, the proportion of facilities that offered treatment in Spanish declined on average by 17.8% (from 40.5% to 33.3%), resulting in a total loss of 1,163 Spanish-speaking facilities in the United States. During the same period, Hispanics’ share of state populations increased on average by 4.5%, from 17.6% to 18.4% (
Table 1), corresponding to an increase of 5.2 million individuals.
Figure 1 shows the 2014–2019 trends in the prevalence of mental health facilities that offered services in Spanish, stratified by Hispanics’ share of the state population. An overall downward trend in Spanish services during this period was observed in 44 states. Five states had marginal increases in facilities offering Spanish-language services (Delaware, 40%–42%; Maryland, 25%–26%; Montana, 5%–6%; Nebraska, 25%–28%; and New Mexico, 61%–62%), and one state (Hawaii, 19%–33%) showed a notable uptick in Spanish-language services. As expected, the percentage of facilities that provided services in Spanish was greater in areas with higher concentrations of Hispanic populations. We identified greater reductions in Spanish-language services among states in lower-ranking quintiles than in higher quintiles. Specifically, we observed that, on average, facilities that offered services in Spanish between 2014 and 2019 declined by 51.0% in Q1 (19.2% vs. 9.4%), 49.7% in Q2 (29.6% vs. 14.9%), 16.2% in Q3 (30.2% vs. 25.3%), 16.2% in Q4 (43.9% vs. 36.8%), and 9.1% in Q5 (58.2% vs. 52.9%).
Figure 2 provides information regarding the relative change in both variables. We identified several states (Oklahoma, North Dakota, Ohio, Kentucky, and Maine, shown in dark brown) with large increases in their Hispanic populations that simultaneously had large decreases in the proportion of mental health facilities offering Spanish-language services. Notably, additional states with large decreases in Spanish-speaking mental health providers (dark red) were concentrated in the southern and southeastern United States.
We also found that the ratio of the number of facilities providing Spanish-speaking services (per 100,000 Hispanic state residents) varied more than 22-fold across the country, from 2.1 facilities in Texas to 47.2 facilities in Vermont (see Table S2 in the
online supplement).
Discussion
To promote equity in mental health outcomes across populations, efforts should be made to strengthen access to services, improve the quality of care, and promote culturally responsive services for large and growing Hispanic populations in the United States. Somewhat counterintuitively, this study identified a sizable gap between the growing need for mental health services provided in Spanish and a decrease in most states in the capacity of mental health practitioners to provide services in Spanish. Between 2014 and 2019, the United States gained >5 million Hispanic residents but lost >1,000 mental health facilities that employed clinical staff who provided mental health treatment in Spanish. All U.S. states exhibited an increase in the Hispanic population, and nearly all states had a reduction in the proportion of facilities that offered services in Spanish. As a result, access to mental health services has fallen far short of the increasing demand.
On average, more than half of mental health facilities in states with the highest proportions of Hispanic residents offered services in Spanish. This result was expected because the health care system broadly reflects the demographic characteristics of the population. At the same time, nine out of the 10 states with a high proportion of Hispanic residents had a decline in the percentage of facilities that offered treatment in Spanish across the study period. This downward trend is problematic for the country’s largest geographic concentrations of Hispanic residents. This finding is in keeping with other research into disparities in health provider shortages, such as a study that found substantial shortages of Spanish-speaking physicians in predominantly Hispanic communities (
32). However, we recognize that additional analyses to assess disparities across various types of health care services and mental health providers are critical for ensuring health equity.
Mental health facilities in states where Hispanics represent a small share of the population had the lowest likelihood of offering treatment in Spanish. In the bottom two quintiles, only one state (Montana) had an increase in the percentage of Spanish-speaking providers. The overall decline in Spanish-speaking providers among states with lower proportions of Hispanic residents was considerably larger than the decline in states with higher proportions of Hispanic residents. Access to culturally responsive services is therefore particularly limited for individuals in states with low proportions of Hispanic residents. This limited access was especially evident in North Dakota and Kentucky, for example, both of which were in the lowest quintile of proportion of Hispanic residents but had a reduction of about 90% in the number of facilities that had Spanish-speaking providers.
Language accessibility is one piece of culturally responsive health care services and is important in creating health care environments that are accessible and useful to historically marginalized populations. Nearly three out of four Hispanics in major metropolitan areas in the United States speak Spanish at home, but this rate has started to slowly decline in recent years (
33). The gradual decline in use of the Spanish language among Hispanics is largely attributable to a decrease in Spanish proficiency among Hispanic children born in the United States after 2000 (
34). Although not all Hispanic individuals with a need for mental health treatment speak or prefer Spanish, the availability of providers who speak Spanish may be a proxy indicator for other important elements of culturally responsive care, including a mutual understanding of cultural norms, expressions of adverse mental health characteristics, and recognition of stigma associated with some psychiatric disorders.
Medicaid expansion has generally been associated with increased use of behavioral health services, although Hispanic populations have shown more modest increases in coverage and health care use compared with gains among White populations and some other racial-ethnic groups (
35,
36). The decision of a state to expand Medicaid under the Affordable Care Act may be one proxy indicator of the state’s overall anticipation of changing demographic characteristics and preparation for an influx of newly covered clients who seek mental health care. We conducted a simple post hoc descriptive analysis of the 2019 N-MHSS data and found that a higher percentage of facilities offered Spanish services in expansion states (35.5%, N=2,973 of 8,365 facilities) compared with nonexpansion states (28%, N=1,134 out of 3,980 facilities). Future research may expand on this finding by measuring the effect of state policies on mental health treatment access among Spanish-speaking populations.
Finally, innovative strategies are needed to improve access to mental health treatment among underrepresented and hard-to-reach populations in all states. Telepsychiatry is a promising approach that may mitigate access barriers on a national scale. The proportion of mental health facilities that offered telepsychiatry nearly doubled between 2000 and 2017, but in 2017, fewer than one in three facilities offered these services (
37). Even in the midst of burgeoning interest in telehealth, racial-ethnic disparities persist. A study based in New York examining the use of telehealth for COVID-19 care reported that Hispanic individuals were more likely than White individuals to rely on the emergency department and office visits rather than telehealth (
38). In a study of efforts aimed at eliminating the Hispanic telehealth disparity, Martinez and Perle (
39) recognized challenges but remained optimistic about the opportunities telehealth can create for Hispanic populations. Specifically, the authors cited the need for better education of both providers and clients to improve health care use and health outcomes. Similarly, because the use of telehealth is predicted to continue expanding nationally, Anaya and colleagues (
40) have called for an equity-centered telehealth system designed to reduce linguistic, literacy, and socioeconomic barriers.
This study had several limitations. The N-MHSS includes data about the characteristics of mental health treatment facilities only. No client-level data were available, so the proportion of clients who identify as Hispanic within facilities was unknown. In addition, the geographic distribution of Hispanic populations varied within states, but no geographic data more granular than the state level were available in the N-MHSS. Data about the demographic composition of communities immediately surrounding mental health treatment facilities would be valuable in further refining investigations into the mechanisms underlying the availability of Spanish-language services.
Spanish competency among providers varies, but the level of language competency at each facility was not captured in the N-MHSS. In addition, no data were available that indicated whether services were provided directly through a Spanish-speaking clinician or through an interpreter. Our use of a single survey item to define whether any staff offered treatment in Spanish resulted in a broad definition of Spanish-language services and limited what may be inferred from the data. Future research should consider varying levels of facility-level language accommodation and its influence on mental health outcomes.
Our sample included all mental health treatment facilities in the N-MHSS data set. Characteristics of facilities differ, and we did not report the types of services provided by each facility. It is possible that Spanish-language services are more likely to be offered in one type of specialty treatment service than another. For example, the N-MHSS differentiates between outpatient, inpatient, and detoxification settings. Future studies of availability of Spanish-speaking providers in different clinical settings should consider evaluating differences by service type or by other facility-level characteristics.
The N-MHSS is the only source of national- and state-level data on the mental health services delivery system reported by both publicly and privately operated specialty mental health treatment facilities. However, several types of mental health treatment facilities were excluded from the N-MHSS, including Department of Defense military treatment facilities, jails and prisons, and individual private practitioners or small group practices that are not licensed as mental health clinics or centers (
28). Facility exclusion criteria should be considered when interpreting the national generalizability of the study findings.
Conclusions
The growing Hispanic population in the United States is paralleled by a growing need for mental health treatment offered in Spanish. Promoting service delivery in Spanish is one way to minimize barriers to treatment while advocating for the equitable distribution of resources, but we found that the availability of Spanish-language services has been decreasing in most of the country. Several states with low proportions of Hispanic residents are also experiencing the fastest growth in the rate of new Hispanic residents, resulting in a particularly high risk for shortages of treatments for Spanish-speaking individuals.


