The provision of behavioral health care services has undergone radical change over the past decade as a result of market and political forces that have created pressure to contain health care spending. Cost containment has forced health care providers to confront the reality of finite resources and the need to make difficult decisions about the allocation of those resources. As a result, the focus on the quality and outcomes of services has intensified over the past few years. Unfortunately, the implementation of clinical information systems for measuring and improving quality has lagged far behind success in containing financial costs.
Consequently, the debate about the impact of cost-containment efforts on clinical outcomes has remained anecdotal, and data have been poor. Something of a consensus has emerged on the desirability of incorporating outcomes measurement into quality-improvement efforts. A few managed care companies have funded large-scale efforts to build outcomes management systems (
1,
2,
3).
A clear distinction must be drawn between outcomes measurement and outcomes management. Outcomes measurement involves assessing the clinical outcome of treatment through the use of standardized measures of clinical severity. Because outcome is an indicator of change, at least two data-collection points are necessary, one at the start of treatment and another at some later time, presumably the conclusion of treatment or some follow-up point. Ideally, change is recorded through repeated measurements at regular intervals so that the magnitude as well as the rate of change can be estimated.
Outcomes management is an effort to improve the effectiveness of treatment services throughout a health care system by evaluating outcomes data. The key performance indicator for an outcomes management program is its ability to make a difference over time—that is, to measurably improve outcomes. Although reliable and valid outcomes measurement is an essential element of an outcomes management program, if this approach is to be effective it must go well beyond simple storage and tabulation of data.
The outcomes evaluation process must be systemic. That is, the outcomes management program should be integrated into an analysis of how care is delivered and managed for all patients rather than existing in isolation as a research study of a sample of patients. However, translating this requirement into reality presents several technical, practical, and scientific challenges, including the need for reliable, valid, and easy-to-use outcomes measures; the need for economical and user-friendly technology to capture data—for example, scanners and personal computer-based software; the need for a large normative sample of patients for whom there are multiple data-collection points in order to evaluate measurement tools and create norms for change profiles; the need for empirically validated statistical models for case-mix adjustment; the need for clinical reports and other decision-support tools designed to foster improvement in clinical outcomes and allocation of treatment resources; and the need for clinicians' acceptance of and participation in efforts to systematically improve outcomes.
This article describes our attempts to resolve these issues for PacifiCare Behavioral Health, Inc. (PBH), a subsidiary of PacifiCare Health Services, Inc. We drew on lessons learned in designing and implementing an outcomes management system for Brigham Young University Clinic and Human Affairs International, Inc., now a part of Magellan Health Services, Inc.
PBH is a managed behavioral health care company with a coverage of more than three million lives in the commercial and public sectors in nine western states. The methods described in this article are currently being implemented for PBH's largest commercially insured population and for one of its public-sector populations. The company has near-term plans for full implementation across its entire system of care.
Outcomes measurement method
Measurement instruments that have known validity and reliability are essential. However, collecting comprehensive data that meet high standards for scientific rigor can become excessively burdensome to both staff and consumers when they are used in real-world service-delivery settings. Thus we attempted to restrict the time requirements for data collection at PBH to five minutes for both the clinician and the patient. Also, data were collected at specified intervals rather than at every session. Clinical outcomes were assessed from the perspectives of both patients and clinicians.
Analyses of large data sets of commercially insured outpatients have shown that there are systematic differences between outcomes obtained from patients' reports and outcomes obtained from clinicians' reports. Clinicians' assessments tend to underestimate the progress of patients who report rapid improvement (
4). Conversely, analyses of improvement based on patients' self-reports and clinicians' ratings on the Global Assessment of Functioning scale suggest that clinicians significantly underestimate deterioration and risk of premature termination of treatment (
3).
Therefore we advocate a system in which the patient's rating of improvement in symptoms and quality of life is the standard for assessing the system's performance. A global change score reflects the overall reduction in patients' distress and has the advantage of broad applicability across multiple diagnoses and settings.
Another argument in favor of a patient-centered system is cost. Use of clinician rating scales is time-consuming and may require training—and retraining—of the clinical staff if adequate reliability is to be maintained (
5). This problem is complicated when the results of the evaluation are to be used for performance monitoring. Clinicians' concerns about the use of outcomes measurement tools can introduce hidden sources of bias that are difficult to detect statistically. Although patients may have idiosyncratic ways of understanding and rating items, a large enough sample will allow this source of error to be randomly distributed across providers and thus be much less likely to contaminate the results.
In keeping with the principle of minimizing the cost and effort of data collection, Lambert, Burlingame, and colleagues (
6,
7,
8,
9) developed two 30-item self-report questionnaires—the Life Status Questionnaire (LSQ) and the Youth Life Status Questionnaire (YLSQ)—for the PBH outcomes management program. Both the LSQ and the YLSQ have a range of possible scores of 0 to 120. For the purposes of this article, it is useful to divide the scores into four severity ranges: normal (0 to 38), mild (39 to 51), moderate (52 to 64), and severe (65 to 120). The mean±SD intake LSQ score for the PBH data repository was 53±18, and the mean±SD YLSQ intake score was 41±19.
The LSQ and the YLSQ incorporate behavioral health-related items from several instruments, including the widely used Outcome Questionnaire-45 (OQ-45) and Youth Outcome Questionnaire (YOQ) (
6,
7,
8,
9). Possible scores on the OQ-45 range from 0 to 180 and on the YOQ range from 0 to 256. Scores on the OQ-45 can be divided into four severity ranges: normal (0 to 61), mild (62 to 79), moderate (80 to 95), and severe (96 to 180). The mean±SD intake OQ-45 score for the sample analyzed for this article was 82±24.
The data repository for the OQ-45 and the YOQ includes repeated measurements for thousands of adults and children who were treated at hundreds of sites across the country. Most of the data were collected under the auspices of several managed care companies as part of ongoing research agreements; any patient identifiers were eliminated from the data.
Items were selected for the LSQ and the YLSQ on the basis of their tendency to improve during treatment while remaining relatively stable in a sample of matched control subjects. This approach resulted in instruments that were presumed to have sound psychometric properties even though the 30 items selected for inclusion in each instrument had not previously been administered in this format. Subsequent experience with the investigational instruments confirmed this presumption.
The LSQ and the YLSQ have been used since early 1999 in PBH's outcomes management program. Nineteen private-sector group practices and five public-sector clinics are providing outcomes data. PBH's highest-volume solo providers are also participating. PBH named its outcomes management program the Algorithms for Effective Reporting and Treatment (ALERT) system. The ALERT system links the patient, the provider, and PBH in an information loop that provides timely reports on critical risk factors and changing levels of patient distress. Aggregate-level reports summarize clinical outcomes for entire systems of care and for specific provider groups.
Before we address specific methods, a brief discussion of the enabling information technology is warranted. The entire enterprise depends on the ability to rapidly and cheaply capture, analyze, and report data in a variety of formats for target audiences. The cost of data capture must be minimal, and the tools for programming the complex logic for data analysis must be powerful and flexible. The technology must allow the rapid development and deployment of various reports and decision-support tools.
The ALERT system is based on an approach to data capture and management that retains maximum flexibility and timely reporting while minimizing cost. First, data are captured on paper forms that are faxed to a central location by means of the Teleform, a product of Cardiff Software, Inc., of Vista, California, that permits the user to design forms and then perform optical character and mark recognition from fax- or scanner-produced images of the completed forms.
Several software products are available for this purpose. However, the use of paper has the advantages of familiarity and low cost. Even if the data set is subsequently altered, the only cost is that of printing and distributing new forms. After the raw data have been captured, SAS software is used to manage the data and construct a clinical information system to provide clinical decision-support algorithms and reports.
Use of off-the-shelf products minimizes the cost of developing the information technology infrastructure that is necessary for outcomes management while retaining the flexibility to modify the data set or logic as needed. Once the data set and accompanying decision-support logic and performance indicators have been tested and refined, an organization may develop customized software applications that are fully integrated into the primary operational databases.
The performance indicators and decision-support tools are the most critical elements of an outcomes management program. As noted, the key performance indicator is the change in the score on the LSQ or the YLSQ from one session to the next. However, this change tells us little unless we know what level of improvement it is reasonable to expect. Outcomes are impossible to interpret without a valid method for statistically accounting for variations in the severity and difficulty of a case—that is, case-mix adjustment. A case-mix model uses data collected at intake to predict the change score at the end of treatment.
Arguably one of the most powerful methods for managing outcomes is a case-mix model that includes predictions of the trajectory of change (
10). Such a method depends on repeated measurements at regular intervals throughout treatment so that the progress of each patient can be monitored against these predictions. Obviously the development of valid case-mix-adjustment and trajectory-of-change models requires a large normative sample of patients for whom there have been repeated measurements.
The PBH outcomes management program uses a repeated-measures design; the frequency of data collection is greatest during the initial phase of treatment. Data are collected at the first, third, and fifth sessions and then less frequently, depending on the risk and complexity of the case. This repeated-measures design enables the trajectory of improvement to be tracked as part of the clinical management of the case. The trajectory during the first few sessions tends to be highly predictive of the outcome (
3).
The PBH data repository provided the means to model the expected trajectory of change for the most common diagnoses in outpatient samples. A sample of more than 3,200 adults and 800 children and adolescents was used to calculate the expected change. The cases selected were drawn from more than 15,000 cases in the data repository and reflected the commercially insured population. The cases were selected on the basis of completeness of data, including the primary diagnosis, the score on the LSQ or the YLSQ at intake, and test scores from at least one other assessment point.
The data repository also contains test protocols from community volunteers who are not currently receiving any mental health treatment. This sample was used to estimate a cutoff score between normal and clinically significant levels of life distress (
11,
12,
13). The formula for the cutoff is (SD
1×M
2+SD
2×M
1)/(SD
1+SD
2).
For example, in the case of the OQ-45, the sample of 1,353 community volunteers had a mean±SD score of 45±19 (
14). The mean±SD intake score for the clinical sample drawn for the PBH project was 82±24. According to the formula, the cutoff score between the clinical sample and the community sample was 61. The system can thus track the improvement of each patient against that of similar persons in the normative sample. The cutoff score provides the means for determining the point at which a patient is within the normal level of life distress. This feature is critical to the success of the outcomes management program and is one criterion for determining when patients are in need of continued care.
Case-mix adjustment
Our analyses of multiple outpatient samples indicate that the single best predictor of the change score for any given treatment episode is the score at the beginning of treatment. Other variables, such as diagnosis, chronicity, and treatment population, alter the relationship to some degree, yet every sample analyzed during the course of this project produced the same result. The change score had an essentially linear relationship with the intake score—higher levels of distress at intake predicted higher change scores and steeper trajectories of recovery.
The relationship between severity at intake and change can be easily communicated visually with a plot of the regression line.
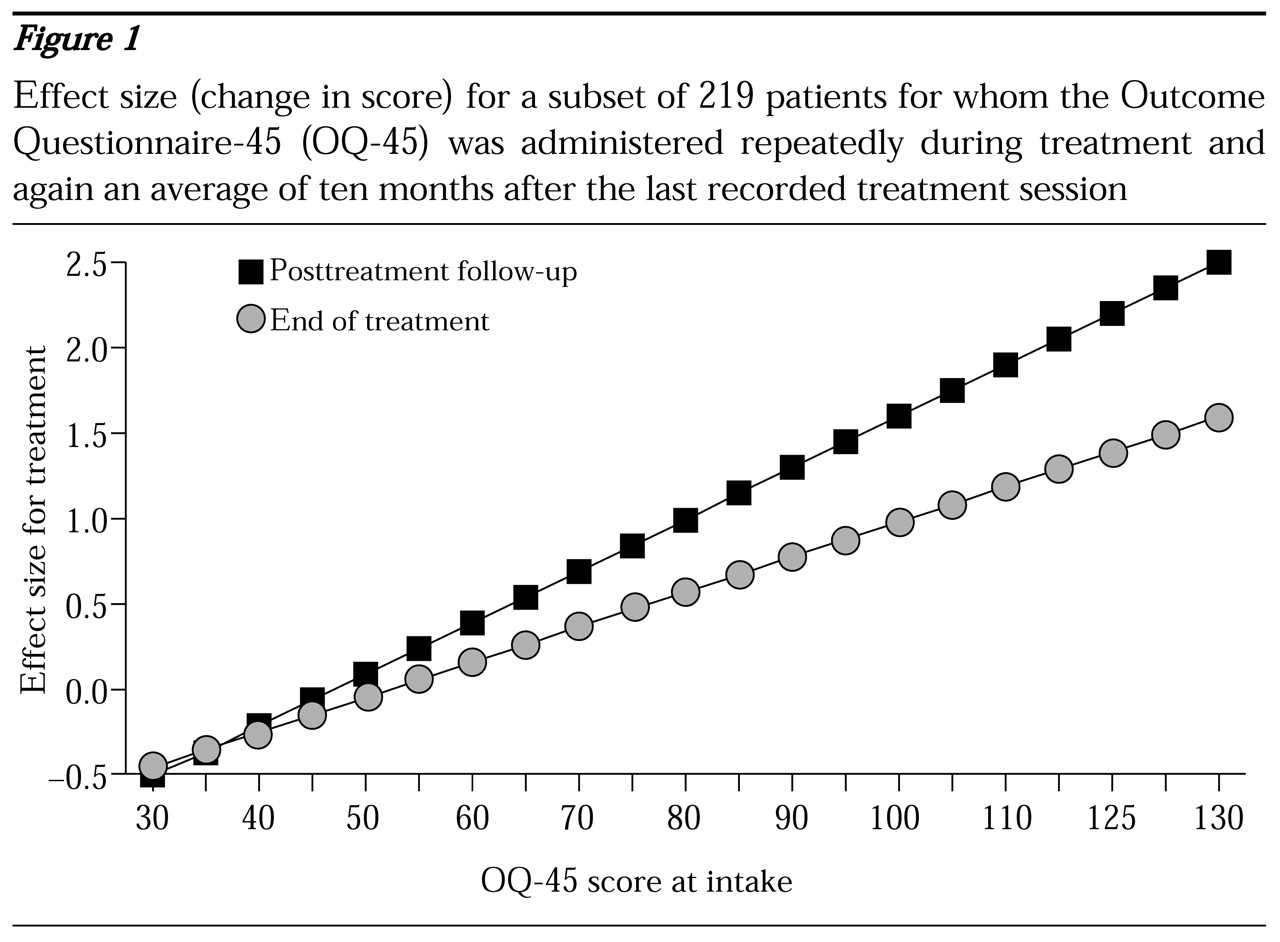
Figure 1 shows outcomes for 219 patients with repeated administrations of the OQ-45 during treatment and a single follow-up administration an average of ten months after the last recorded treatment session. The higher the score on the OQ-45 at intake, the greater the change during treatment and during the posttreatment follow-up period.
The intake score appears to account for 10 to 20 percent of the variance in the change score, depending on the sample, the instrument, and the time to the final assessment. The intake score accounted for 15 percent of the variance at the end of treatment and 20 percent at the follow-up assessment. For ease of interpretation and consistency, the change score is expressed as an effect size. The effect size is calculated by dividing the change in the raw score by the standard deviation of the measure. The use of effect size to express the change score conveys the magnitude of change in a way that allows pooling of data from different instruments, an important consideration when data for an entire system of care are aggregated.
However, caution must be exercised in comparing mean effect sizes from different populations. On average, large heterogeneous outpatient samples taken from the field will tend to have significantly lower effect sizes than those commonly reported in published outcomes research, not necessarily because academic research studies get better results than field-based studies, but because the range of intake scores in a research sample is often restricted in some way.
For example, a study on the treatment of major depression would naturally contain patients who had been screened to meet the criteria for depression. Consequently, the mean intake score would be higher than the score for a broad sample of outpatients. As illustrated in
Figure 1, higher intake scores tend to be associated with more change. Thus a restricted sample of very distressed patients would certainly show more change on average than a more heterogeneous sample. Furthermore, because the homogeneous sample would not contain patients at the lower end of the severity distribution, the standard deviation for the sample would be smaller.
Greater variability—a higher standard—will result in lower effect sizes, even if absolute change remains constant. In the relatively homogeneous sample of patients selected for the hypothetical study, the result was a higher numerator (change score) and a smaller denominator (standard deviation), resulting in a greater effect size in clinical trials than would occur in a typical sample of outpatients.
We would not argue that this case-mix model accounts for all relevant factors. The best process for improving the predictive ability of the model is to identify reasonable variables for investigation, such as socioeconomic level and chronicity, and then collect data on these variables for analysis and modeling. Ideally, as data accumulate, the model is tested and refined. The case-mix model permits an estimate of the expected improvement for any given patient at the start of treatment. Predicted change remains constant throughout an episode of care, serving as a benchmark for measuring treatment progress and outcome. For example, the ALERT system uses a change index, which is simply a residualized change score calculated by subtracting predicted change from actual change for each case. Positive values indicate above-average results.
When the trajectory of change during the first few sessions is known, it becomes feasible to evaluate an individual patient's response to treatment early on and to make any necessary adjustments to the treatment plan. Furthermore, calculation of an expected trajectory of change allows identification of patients who require treatment and how much treatment they require.
Predicting and tracking change
Several researchers have investigated dose-response curves for psychotherapy (
4,
15,
16). Their findings suggest that for most patients change occurs during the early stages of treatment, with diminishing benefits per session. However, it is risky to extrapolate from dose-response curves that were established in research settings in which the duration of treatment was prolonged or held constant for the purposes of the study. In real-world settings—whether fee-for-service or managed care environments—the duration of treatment is determined by many factors, and different dose-response patterns can be expected. Conventional wisdom argues that longer treatments result in superior outcomes.
Much of the criticism of managed care plans is that they arbitrarily limit the duration of treatment. Our data from the commercially insured managed care populations do not show a significant correlation between duration of treatment and outcome. In fact, short treatments are common, even for some of the most distressed patients, and the results often indicate rapid improvement rather than poor outcome.
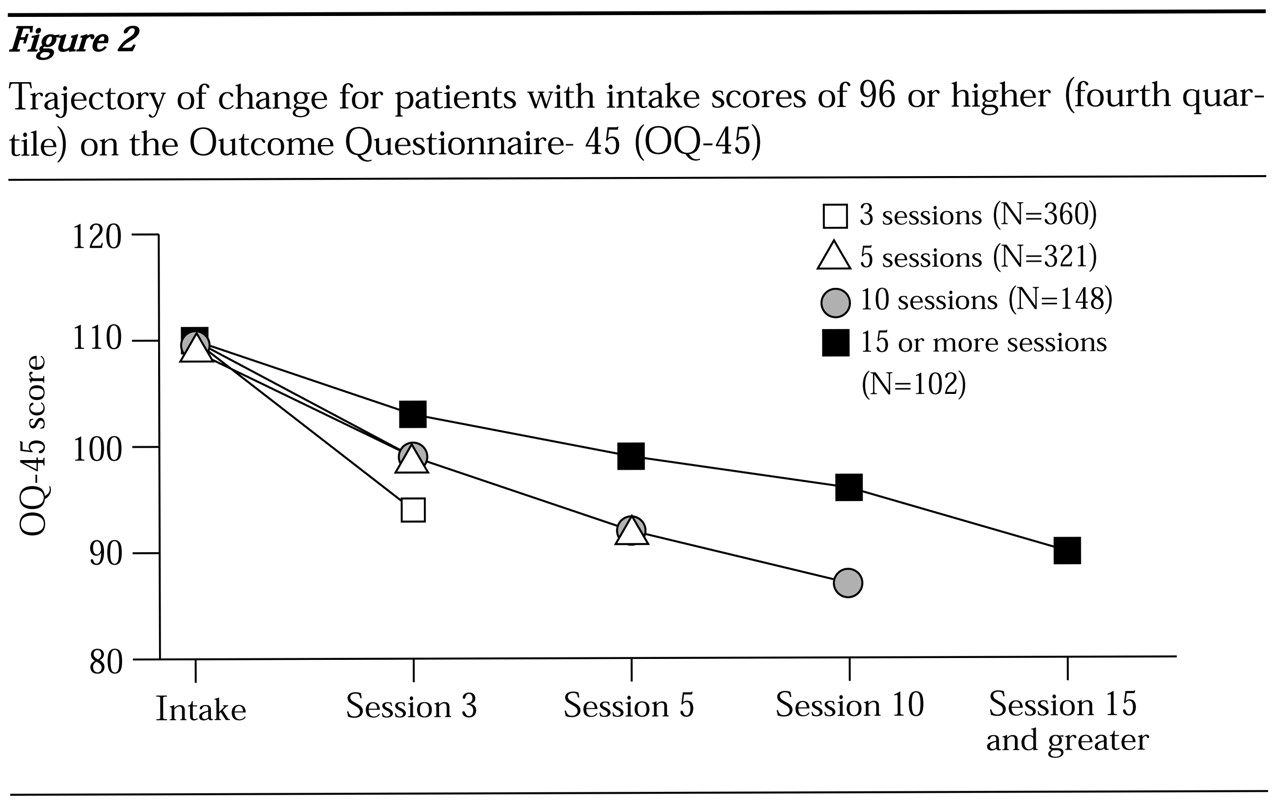
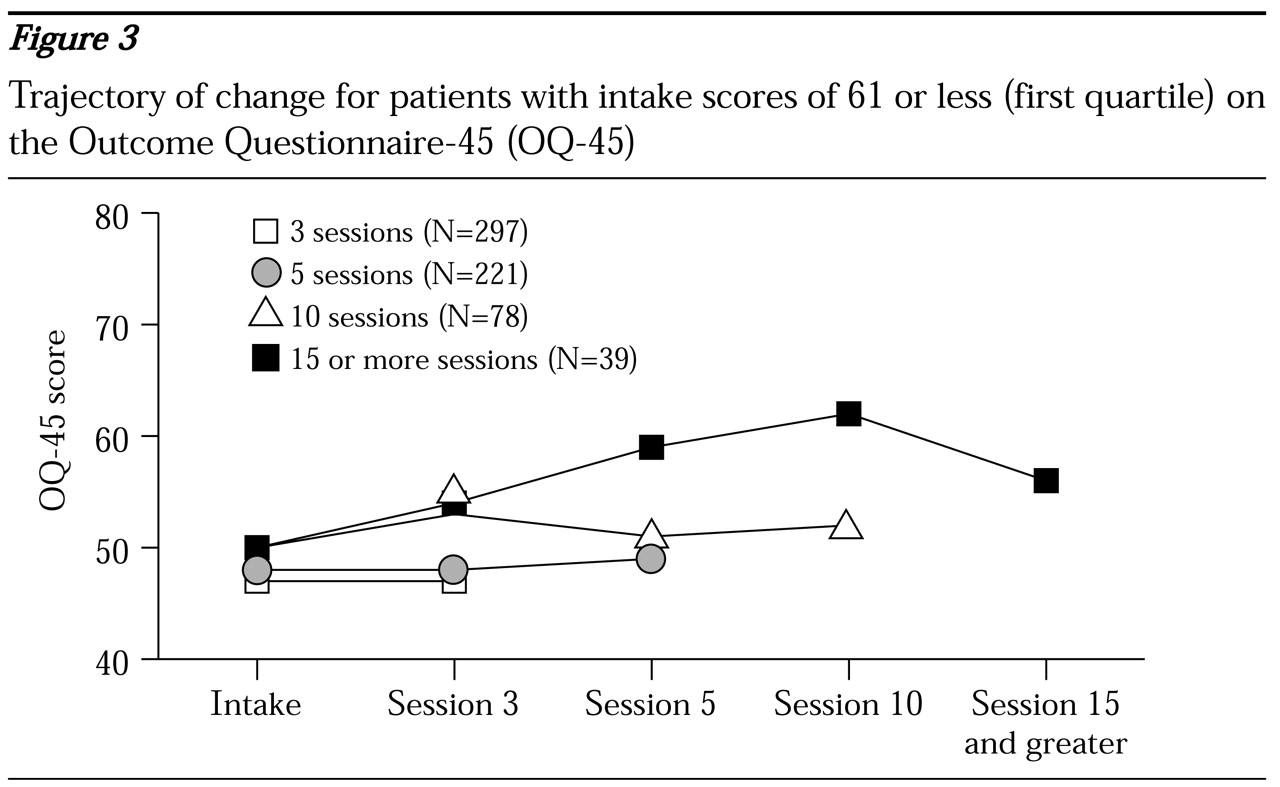
To illustrate this point the sample was divided into quartiles based on the score on the OQ-45 at intake to highlight the trajectory of change as a function of severity at intake.
Figure 2 shows results for the most distressed patients (fourth quartile, score of 96 or higher) by the number of treatment sessions completed.
Patients for whom data were collected at the tenth session or later had a few more points of improvement than patients for whom the last data-collection point was the third or fifth session. However, the rate of improvement for patients with the shorter treatments was so high that these patients probably did not need to stay in treatment until the next data-collection point.
Patients in the other three quartiles had very different outcomes. Durations of treatment of ten sessions or more were associated with worse outcomes; for patients with the mildest symptoms at intake they were actually associated with deterioration (
Figure 3). It appears that these patients and their therapists continued to meet because the patient was not improving or was doing worse, not because the treatment was helping.
The average duration of treatment, determined by the last session for which data were submitted, for patients in all of the quartiles, even the fourth quartile (score of 96 or higher), was less than seven sessions. Likewise, for patients in all quartiles, more than 75 percent of the treatment episodes were completed before the tenth session. Except for patients in the first quartile (score of 61 or less) (
Figure 3), shorter treatments were associated with a higher rate of change. However, these patients were more characteristic of a nontreatment sample than of a clinical population. In fact, the mean intake score in the first quartile was 50, only five points higher than the mean of the nontreatment sample. This group showed no change with shorter treatments, and patients who averaged ten sessions or more showed slight deterioration. One wonders whether this represents an "as good as it gets" phenomenon.
At the other end of the spectrum, the duration of treatment for the most severe cases bears closer analysis (
Figure 2). It is highly unlikely that the durations of treatment of less than five sessions for 42 percent of the patients in the fourth quartile were a result of managed care limitations or intentional termination by the clinicians. Despite the rapid improvement by the third session, the severity of distress among these patients remained greater than that of the entire clinical sample. At termination of treatment, these patients were, on average, above the 50th percentile of the larger clinical sample from which they were drawn. The managed care companies had access to the OQ-45 scores, as did the clinicians. There are clinical and business reasons for keeping such patients in treatment. These patients were still showing a level of distress that warranted further clinical intervention. Without such intervention, this group arguably might have had the greatest risk of deterioration and a need for more costly and higher levels of care.
The self-reported theoretic orientation of the provider seems to have had little impact on the duration of treatment. Treatment orientations as diverse as psychodynamic, cognitive-behavioral, and brief solution-focused therapies appear to result in essentially equivalent outcomes and durations of treatment when applied in the real world of commercial managed care (
17). The most tenable hypothesis is that the patients themselves are the primary determinant of duration of treatment and that the decision to terminate treatment is based on the rate of improvement—the faster the improvement, the sooner treatment is terminated.
Seen in this light, the regression equations we used for case-mix adjustment are an estimate of how much improvement is necessary for the average patient with a given severity of illness to decide whether treatment has been adequate. Because the patients appear to be determining the duration of treatment, it is more accurate to say that the duration of treatment is a function of the speed of recovery than that the outcome is a function of the duration of treatment.
From the perspective of outcomes management and quality improvement, this finding suggests that the focus should be on ensuring that patients achieve a given level of outcome rather than a given duration of treatment. These findings have obvious implications for the optimal allocation of resources. When outpatient treatment resources are allocated to the most distressed patients rather than to the healthiest patients, greater benefits are realized per dollar invested.
It is also evident that if a system of care wants to improve outcomes, the greatest opportunity lies with the patients who are most in need of treatment. Although the evidence shows in aggregate that patients tend to remain in treatment until they achieve a certain outcome, the variability of this phenomenon at the individual level is large. The average change for the entire sample was nine points (effect size=.39). However, the standard deviation of the change score was more than 19 points.
This means that even after severity has been controlled for, the predicted change for any given patient is a gross estimate only. Despite this limitation, the use of predicted change as a benchmark against which to compare actual change is useful for evaluating results. At the very least, predicted change quantifies the importance of case mix and provides a useful reference point for evaluating outcomes in the aggregate.
The wide variability in outcomes is further evident when one looks at the patients with the worst outcomes, who represent 10 to 20 percent of the sample. These patients were substantially worse off than patients with average results in that they showed no improvement or even showed substantial worsening of symptoms. Just as patients who show rapid improvement tend to end treatment early, patients who fare poorly early in treatment tend to end treatment before they achieve any substantial benefit. The challenge for an outcomes management program is to target these at-risk patients as early as possible in the hope of averting premature termination. The fact that early change predicts final outcome permits the use of statistical models to target at-risk patients as soon as at least two sets of data have been collected.
Targeting of these at-risk patients is accomplished through the use of regression models that use the intake score and the change score at a given session to predict the final treatment outcome. The model assumes that treatment will continue at least to the next data-collection point but does not attempt to predict outcome as a function of the number of additional sessions. This assumption is in keeping with the finding that the duration of treatment is mostly a function of the speed of improvement. Once data for the first and third session are obtained, the multiple regression formula accounts for about 40 percent of the variance in final outcomes. Of course, the predictive formulas that incorporate change at later sessions vary with the number of sessions already completed.
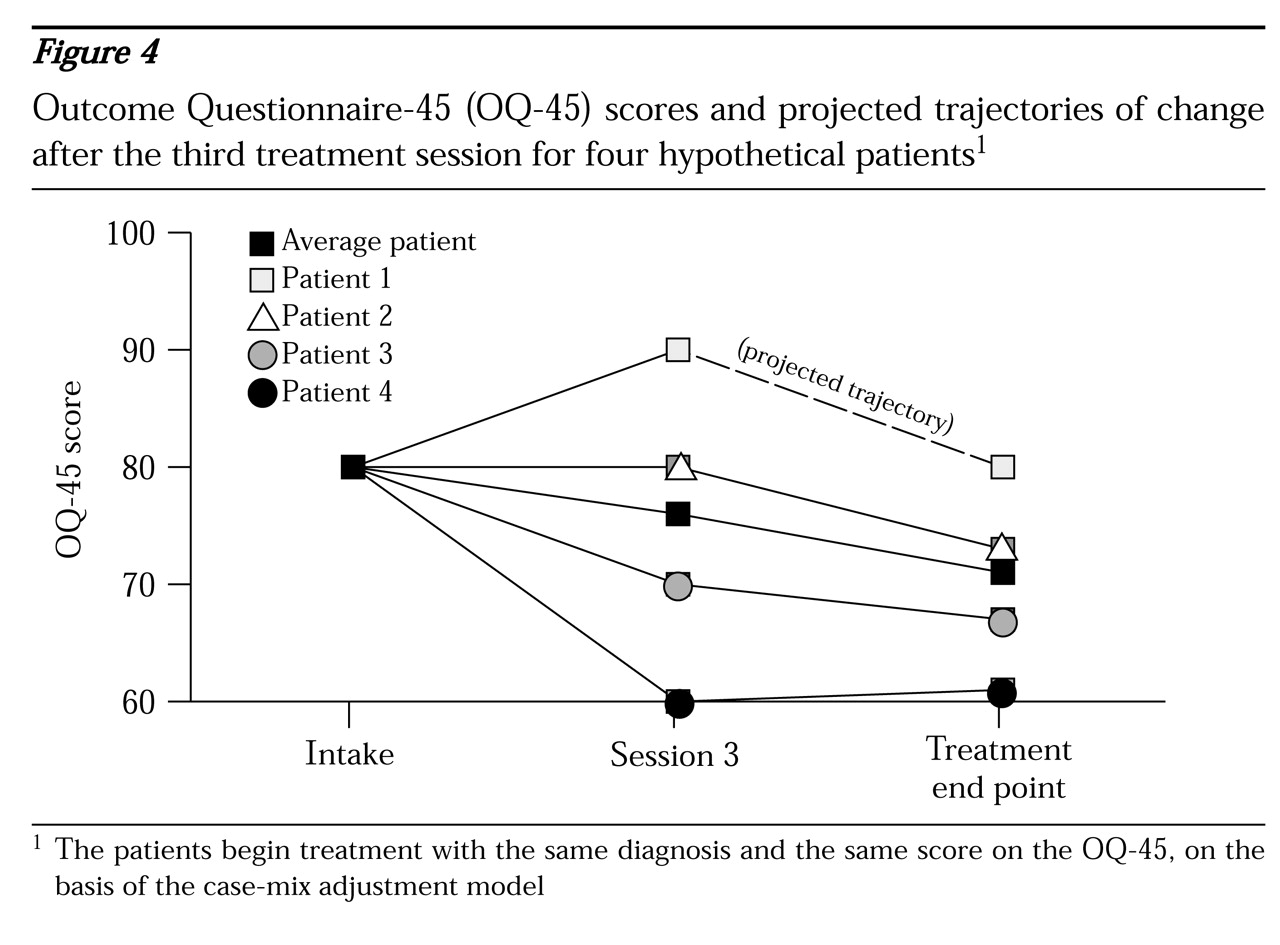
Figure 4 shows the average trajectory of change and data for four hypothetical patients who begin treatment with the same diagnosis and the same score on the OQ-45 at intake. On the basis of the case-mix-adjustment model, the expected improvement for the average patient by the fifth session or later is nine points. At the third session, the four patients have markedly different responses to treatment. The lines extending from the third to the final session represent the projected trajectory of change for each patient if treatment is continued beyond the third session.
Patient 1 has deteriorated by ten points by the third session. Even if the patient continues in treatment, the average patient with this pattern of change recovers only to the baseline score. Nevertheless, by continuing in treatment the patient at least still has the possibility of improving; by definition, half of the patients will fare better than indicated by this trajectory. However, if the patient were to stop at this point, the outcome is certain—19 points worse than the outcome for the average patient. Unfortunately, the data show that more than 60 percent of the patients who deteriorate by session 3 do not remain in treatment until session 5.
Patient 2 showed no change by session 3, but it is probable that if treatment continues, the patient will still achieve an improvement of close to nine points. Patient 3 achieved the nine points' improvement by session 3 and is likely to achieve only a modest additional benefit by remaining in treatment. Patient 4 has shown substantial benefit and is unlikely to benefit significantly from additional treatment.
Fortunately, in practice far more patients follow trajectories similar to those of patients 3 and 4 than that of patient 1. In principle, this means that for a large health care system, the cost of focusing resources on keeping a patient such as patient 1 in treatment can be offset by a modest shift in resources away from the many patients who are doing well and who are unlikely to benefit from further treatment.
A simple analysis of the adult patients on the basis of test scores at the third session illustrates this point. As noted, the mean±SD intake score on the OQ-45 in the sample that was used to develop the PBH norms was 82±24. Twenty-four percent of these patients had intake scores at or below 61, the cutoff between the normal and clinical samples. At the other end of the severity spectrum, 24 percent of patients had scores of 96 or more.
By the third session, 29 percent of patients who were still in treatment had scores below 62. The mean score of these patients who were in the normal range was 46, only one point higher than the mean in the community sample. In contrast, at the third session the percentage of patients with scores of 96 or more had dropped to 20 percent. The purpose of this analysis was to track what happens to these two groups of patients after the third session. Of the patients with scores in the normal range at the third session, 39 percent continued at least to the fifth session and averaged 3.8 additional sessions. Among patients with scores of 96 or more at the third session, 59 percent continued treatment, which means that more than 40 percent of the most severely distressed patients at the third session did not continue in treatment as far as the fifth session. Given the severity of distress, these patients were clearly premature terminators for whom treatment had failed.
The pattern of change is also telling. As a group, patients with scores below 62 at the third session had achieved substantial improvement by then, averaging almost 12 points' change in the three sessions (effect size=.5). However, on average, the patients who continued treatment had no further measurable benefit. In fact, the OQ-45 scores of these patients increased by an average of three points from the third session to the end of treatment, similar to the pattern shown by patient 4 in
Figure 4. From these cases it seems clear that there is room to reduce the average duration of treatment without sacrificing outcomes. In sharp contrast, the 20 percent of patients with scores of 96 or more at the third session had deteriorated by an average of two points by the third session. This is cause for alarm given the already high scores of these patients. However, it is encouraging that for the patients who did continue treatment, the average improvement between the third session and the end of treatment (mean± SD number of sessions=8.5±5) was 14 points (effect size=.61).
From a quality-improvement standpoint, the focus should be on keeping a higher percentage of these high-risk patients in treatment for a sufficient time for benefit to be realized. Our data support the idea that the cost of this effort can be more than offset by a reduction in the duration of treatment for patients with subclinical levels of distress.
Performance feedback anddecision-support tools
This section addresses the challenge of providing clinicians and clinical managers with outcomes-based information to assist in planning and monitoring treatment. Effective decision-support tools should result in improved outcomes and a much more efficient allocation of resources.
The ALERT system produces daily, weekly, and monthly clinical outcomes reports. The system can also track and identify high-risk patients on the basis of several clinical variables, such as diagnoses, clinicians' and patients' reports of suicidal ideation and substance abuse, and treatment history. The ALERT system scans in data daily from the most recent encounters, evaluates risk indicators, and calculates the trajectory of change. The system uses algorithms as a clinical aid for case managers and generates individual case reports on at-risk patients. These algorithm reports are produced daily on the basis of both patients' self-reported data—from the LSQ and the YLSQ—and provider-reported data.
The algorithm reports are intended to be decision-support tools for separating cases that require no intervention from those that require active management. Algorithm reports of high-risk patients are faxed to the provider and are a starting point for a dialogue to determine how best to serve the patient. The focus of the discussion is, first, on how best to keep the patient engaged in treatment and, second, on what changes, if any, to the treatment plan are warranted.
The algorithms evaluate nine variables: diagnosis, LSQ or YLSQ score, trajectory-of-change projections, patient's self-report of suicidal ideation, patient's self-report of substance abuse (both critical items from the LSQ or YLSQ), clinician's assessment of risk of suicide, clinician's assessment of substance abuse, history of hospitalization, and whether a psychiatric medication has been prescribed. These algorithms contain more than 42,000 separate decision rules encompassing all possible combinations of the variables and their values. Coding of the computerized algorithms with use of the SAS scripting language permits easy modification of the clinical variables and logic as data accumulate and the system "learns."
Case-mix adjustment is achieved by indexing the actual change score against the baseline statistical projection of change. The baseline projected change is calculated from data collected at intake with use of the case-mix model. This variable remains constant for each patient throughout the course of treatment. The outcomes are indexed by subtracting the baseline projected change from the actual change score to create a residualized change score. Positive values indicate more improvement than expected.
Although the system tracks outcomes at the level of the individual patient, it also provides regular reports of aggregated results across multiple patients for use by clinicians, clinical managers, and administrators. The system provides two sets of outcomes reports: one is for closed cases and is referred to as the aggregate outcomes report, and the other is the change index report, which projects outcomes for active cases. Used together, these reports are powerful tools for managing and monitoring results. They are provided monthly to contracted group practices that treat a high volume of PBH patients. Daily and weekly reports provide similar information on active high-risk cases.
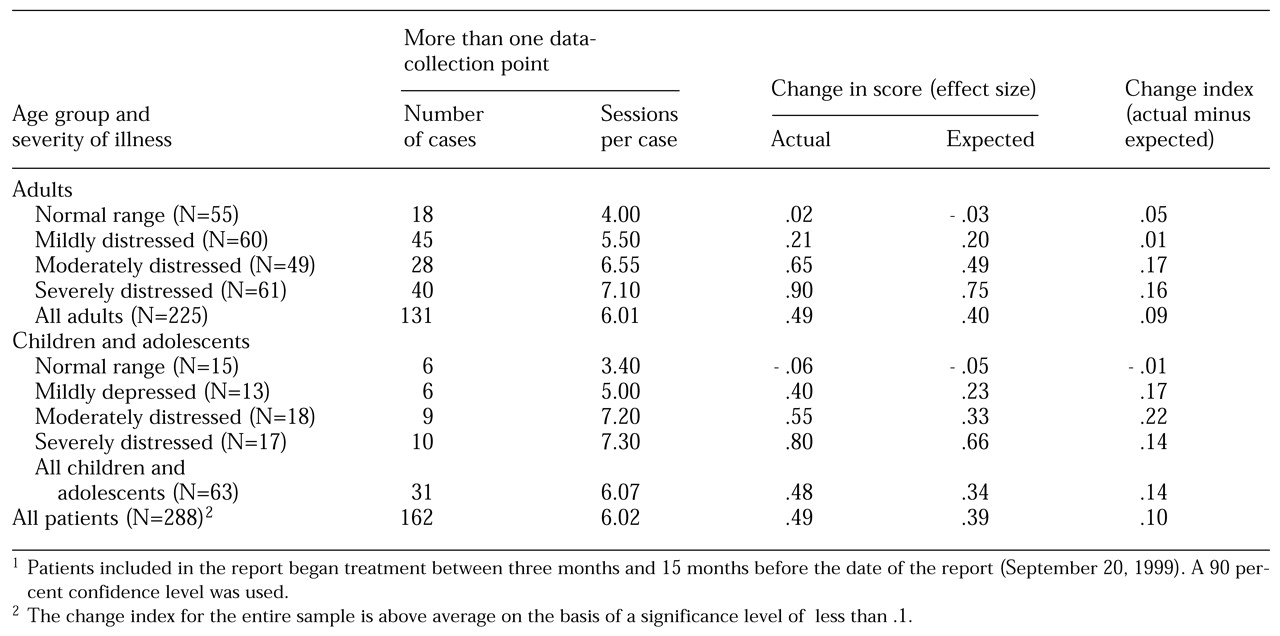
The aggregate outcomes report provides outcomes on closed cases by using the change index, or the average of residualized change scores. The aggregate outcomes report separates results for adults and children or adolescents and further separates the results by level of severity, categorized by using the four quartiles of scores at intake. The report provides information on the number of patients treated, the number and percentage of patients for whom there are at least two data-collection points, and the average number of sessions for those patients.
The report provides three key pieces of information that are needed to evaluate outcomes: the outcome expected on the basis of the average of the baseline predicted change scores using the case-mix model, the actual outcome as measured from the first session to the end of treatment, and the change index, which is the average of the residualized change scores calculated by subtracting the baseline predicted change from the actual change. Results are expressed as effect size for ease of interpretation and to permit the results from the LSQ and the YLSQ to be pooled.
Table 1 shows data based on the LSQ and the YLSQ for a group practice in which the effect size across 288 cases exceeded the case-mix-adjusted predicted outcome by .1 unit. This is an above-average result on the basis of a significance level of .1 or less. A 90 percent confidence level was used instead of the more conservative 95 percent, because these data were intended to provide general feedback for ongoing quality-improvement purposes, and the implications of a higher type I error rate are considered less serious.
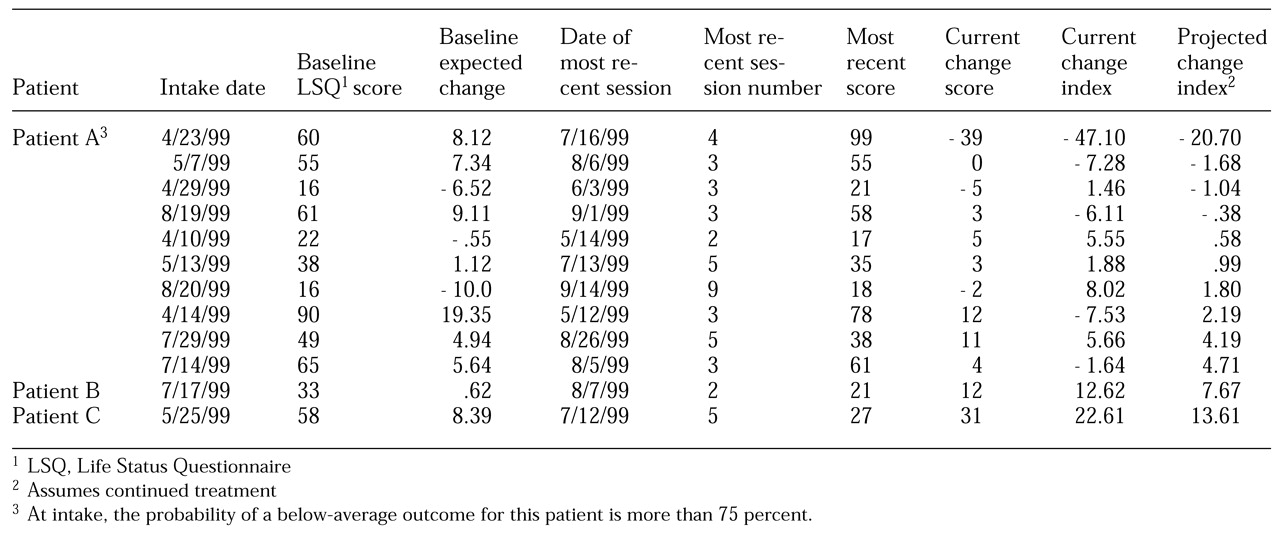
Whereas the aggregate outcomes report provides information on closed cases, the change index report provides information on open cases while there is still time to alter the treatment plan. The change index report presents the current change index—that is, the residualized change score at the most recent session. It goes further by also providing a predicted change index based on the outcome that is likely if the patient remains in treatment. This index is calculated by using the regression formulas that incorporate the intake score and the change score to estimate the change score at the end of treatment. The new projected change score is then indexed by subtracting the baseline expected change from this value. The change index report is designed so that the provider can quickly review patients' progress and focus efforts on patients who are at the greatest risk. Because the report is specific to one instrument, it uses the change in raw scores rather than the effect size.
Consumers' feedback on the reports supports the use of raw scores in this context. Patients are sorted so that those whose projected change index score is furthest below the expected change are at the top of the list. Patients with projected change index scores below zero at the 75 percent confidence level (for example, patient A in
Table 2) are highlighted. For these patients, the probability of a below-average outcome is more than 75 percent. These tend to be the patients with both the highest risk of premature termination of treatment and the greatest likelihood of benefiting from further treatment. A weighted average of the current and projected change index scores is used to derive an aggregated estimate of the most likely outcome for the entire patient cohort. This weighted average is based on the assumption that 40 percent of patients will improve with continued treatment, which was derived from analysis of the data repository.
The examples in
Table 2 are based on an actual sample of cases from a single provider. Although the overall results are averages, the example illustrates several of the points made in relation to
Figure 4. Patient A exhibits the same pattern as that shown by patient 1 in
Figure 4. There is significant deterioration, and the outcome is likely to be relatively poor, even with continued treatment. However, continued treatment is projected to result in 27 points of improvement from the current session and beyond if the patient remains in treatment. On the basis of this report, the most critical intervention is to take steps to keep this patient engaged in treatment. In a well-organized clinical setting, this patient might be targeted for special monitoring.
Like patient 4 in
Figure 4, patients B and C in
Table 2 have achieved significant improvement. Both have scores well within the nonclinical range and therefore are unlikely to obtain measurable benefit from additional sessions. Clinical judgment must be the final determinant in any single case. However, from a population-based perspective, this type of decision-support tool has the potential to direct available resources to patients who are most in need and most likely to benefit.
Evidence on decision support
The impact of feedback on patient improvement and allocation of care was tested in a recent study conducted at the comprehensive counseling center at Brigham Young University (
14). That study, involving 609 patients and 31 clinicians, used the OQ-45 at every session. Treatment continued until termination was deemed appropriate by the clinician, the patient, or both. Half of the patients were randomly assigned to the experimental condition in which the clinician had the benefit of feedback on the trajectory of change and the severity range. The feedback was determined by a set of algorithms that were a function of the number of sessions completed, the current level of distress, and an assumed likelihood that the patient would not recover. In the control condition, the patient completed the questionnaire, but the results were withheld from the clinicians.
A complete summary of this study is beyond the scope of this article, but for the purposes of the present discussion, it is instructive to look at the effects of feedback for the most at-risk patients. On the basis of the logic of the algorithm, 35 patients in the group for which the clinicians received feedback, or 11 percent, and 31 patients in the control group, or 10 percent, were identified as "signal" patients—those most at risk of premature termination of treatment and poor outcome, similar to patient 1 in
Figure 4. The feedback included a warning that the patient was improving less than expected, along with suggestions to review the treatment plan and to guard against premature termination of treatment.
The signal patients in the feedback group received almost twice as many sessions of treatment as the signal patients in the control group (p<.001). More important, these signal patients showed significantly more improvement after the warning than the signal patients in the control group (p<.05).
Whereas the signal patients in the feedback group received additional services, the nonsignal patients in the feedback group who were progressing well in treatment averaged fewer sessions than their counterparts in the control group (p<.05), and, as expected, the additional sessions provided to the signal patients were more than offset by the modest reduction in the number of sessions provided to the nonsignal patients. Thus the feedback group received 4 percent fewer sessions overall than the control group.
The results of this study support the premise that it is possible to focus resources and improve results for the most at-risk patients without increasing the overall cost of care.
Results from the field are likewise encouraging. The PBH data repository contains many cases (4,825 patients) involving large group practices that had participated in previous outcomes management initiatives and had the benefit of some form of decision support and feedback. These patients were compared with 1,412 patients who were treated by clinicians who did not receive this kind of feedback. That sample was larger than the sample that was used to develop the PBH norms, because cases were included even if they were missing therapist-generated data such as DSM-IV diagnoses. Patients treated at one of the sites that received feedback had more than 25 percent greater improvement on average than patients treated at sites that did not receive feedback (effect size=.29 compared with .37, p<.001). Of course, any number of other factors could have contributed to this result, but the finding does offer a promising hint of what is possible with outcomes management techniques.
The ALERT system was first implemented by PBH for the company's commercially insured population in February 1999. All the decision-support tools were provided to the 19 large group practices that were treating a high volume of patients. Individual practitioners who are not associated with one of the groups are contacted by a case manager if the algorithms determine that a patient is at risk; otherwise, these practitioners do not receive reports such as the change index report or the aggregate outcomes report. Our project provides a mechanism for further exploring outcomes in natural settings and investigating the impact of outcomes management methods on the delivery of care in various clinical environments.
Conclusions
The preliminary field results of these outcomes management methods are encouraging. However, the early findings must be approached with some caution. Future work will focus on refining the case-mix model and identifying process variables such as treatment and case management methods that are associated with superior results. Psychotherapy research has given us more than a quarter century of valuable information on how to assess change associated with behavioral health treatments. Although the science of outcomes measurement might be judged to be relatively mature, the implementation of outcomes management programs such as the ALERT system within large systems of care is in its infancy. Much work needs to be done to validate and refine the methods.
This article is intended to encourage behavioral health care organizations to pursue outcomes management programs and to contribute to the growing body of knowledge about what works. Organizations such as the National Committee for Quality Assurance and the Joint Commission on Accreditation of Healthcare Organizations should drive this process forward, because it is now possible to insist that behavioral health delivery systems demonstrate the clinical outcomes associated with their services. Behavioral health practitioners should welcome this development because the evidence suggests that clinical outcomes in the field are generally positive and that monitoring outcomes during treatment can contribute to even better outcomes.
