The Center for Mental Health Services conducts national surveys on mental health services in the United States. In 1988 the center surveyed the availability of mental health services in state adult correctional facilities and focused on the availability of services, location of services, staffing of services, volume of services, and demographic and clinical characteristics of service users (
1). The 1988 study was sparked by reports about rapidly increasing prison populations and facilities. At the time of the study, the Center for Mental Health Services reported that between 6 and 14 percent of the correctional population had a major psychiatric disorder and that the lifetime prevalence rate of major psychiatric disorders among prisoners and detainees was 82 percent. One of the center's concerns was that the proportion of persons with mental illness who were incarcerated had increased significantly as a result of insufficient community-based mental health services.
The 1988 survey was the first to investigate the national availability of mental health services for prisoners within the state correctional system. The data were as accurate a representation of mental health services in correctional facilities as possible. However, these data are now more than 15 years old. They no longer present an accurate portrait of the mental health services that are currently available in state adult correctional facilities. Yet the survey is an excellent historical reference that can be compared with more recent studies to identify changes in services over time.
Since the deinstitutionalization of persons with mental illness began, an increasing number of these individuals have been imprisoned, with no indication of a decline in this trend (
2). At the end of 1988 more than 100,000 patients resided in state and county mental hospitals. By the end of 2000 fewer than 56,000 patients resided in these hospitals, a reduction of almost one-half (
3). These hospitals were also admitting only half as many patients in 2000 as they were in 1988, which may have played a role in the increasing number of persons with mental illness who appeared in the criminal justice system. In addition, throughout the 1990s, prison populations and prison construction increased (
4). This escalation would also lead to an increase in the number of inmates in need of mental health services, because a disproportionate number of inmates are likely to be mentally ill compared with the general population.
Identifying trends in the availability and use of mental health services that are provided by state adult correctional facilities in the United States has proven to be difficult because of variability between surveys. Recent data on mental health services in state adult correctional facilities were relatively easy to find. However, each data source varied in its definition of the terms "correctional facilities" and "mental health services," which made comparisons difficult. To address differences between existing surveys and to make comparison as accurate as possible, uniformity between surveys needed to be established. The methods that were used to make the two surveys that we examined comparable are described below.
Our study examined trends in the availability and use of mental health services in state adult correctional facilities. We hypothesized that the increase in the availability and use of mental health services in state adult correctional facilities would be at least proportionate to the growth of these facilities and of their prisoner populations.
Methods
The two surveys that we examined were chosen because they occurred more than a decade apart, had a reasonable amount of data, and could be made comparable. Thus results from the 1988 Center for Mental Health Services survey—Inventory of Mental Health Services in State Adult Correctional Facilities—were compared with those from the 2000 Bureau of Justice Statistics survey—Census of State and Federal Adult Correctional Facilities (
1,
4).
The 1988 Center for Mental Health Services survey covered state adult correctional facilities in the United States and its territories operating during the month of September (
1). The sample for the survey was derived from the American Correctional Association's
1988 Directory of Juvenile and Adult Correctional Departments, Institutions, Agencies, and Paroling Authorities (
1). Facilities were excluded from the survey if they were identified as youthful offender facilities, prison farms, road camps, and federal prisons. A total of 799 facilities were asked to participate, and 781 responded, giving a response rate of 98 percent. For comparison purposes we excluded facilities that were in U.S. territories, leaving 757 sample facilities for our analyses.
The 1988 survey gathered specific data for each category of mental health service: availability of services, location of services, staffing of services, volume of services, and demographic and clinical characteristics of service users. Data were collected at the facility level and then aggregated. State and national findings were reported.
The comparison survey was conducted in June 2000 by the Bureau of Justice Statistics (
4). The survey's universe of facilities was developed from the Department of Justice's
Census of State and Federal Adult Correctional Facilities, 1995 (
5). However, the report was updated with the
2000 Census of State and Federal Adult Correctional Facilities to identify new facilities and to eliminate facilities that had closed (
6). The survey included adult correctional facilities, prisons and penitentiaries, boot camps, prison farms, reception centers, diagnostic centers, classification centers, road camps, forestry and conservation camps, youthful offender facilities, vocational training facilities, prison hospitals, drug and alcohol treatment facilities, and state-operated local detention facilities.
The 2000 survey asked 1,584 state facilities to participate; 1,519 responded, giving a response rate of 95.9 percent. Data were reported by type of facility, security level of the facility—maximum, medium, and minimum—and other characteristics of the facility. Data were not collected for U.S. territories.
The scope of the 2000 survey was somewhat broader than that of the 1988 survey. To make the comparison between the 1988 and 2000 data as accurate as possible, we excluded certain types of facilities from the 2000 data. Of the 1,584 state facilities that were asked to participate in 2000, a total of 1,124 were classified as confinement-based facilities and 460 were classified as community-based facilities. Facilities were defined as confinement based if less than 50 percent of inmates in the facility were regularly allowed to leave the facility unaccompanied. Facilities were classified as community based if 50 percent or more of inmates were regularly permitted to leave unaccompanied or if they were primarily involved with community corrections. We excluded all reporting community-based facilities, including halfway houses, work release facilities, prerelease facilities, study release facilities, and restitution facilities (N=422). We also examined certain confinement-based facilities, such as boot camps, prison farms, road camps, forestry and conservation camps (N=78), and youthful offender facilities for youths being tried as adults (N=35), both of which were excluded from the 1988 survey. The various camps were unlikely to offer any mental health services. Although the youth facilities were likely to offer mental health services, their number was small enough not to alter the findings appreciably. Therefore, we concluded that the reporting confinement facilities in the 2000 data set (N=1,097) closely resemble those in the 1988 data set (N=757). These two data sets are the basis for all the comparisons in our study.
Two differences existed between the surveys. The 1988 survey collected data on the number of facilities that offered medication services and specifically inquired about facilities that monitored psychotropic medication. The 2000 survey reported on facilities that distributed psychotropic medication, a slightly different type of service. Finally, the 1988 survey reported on facilities that provided psychiatric testing and assessments, whereas the 2000 survey reported on those that provided psychiatric assessments.
Results
Findings from 1988
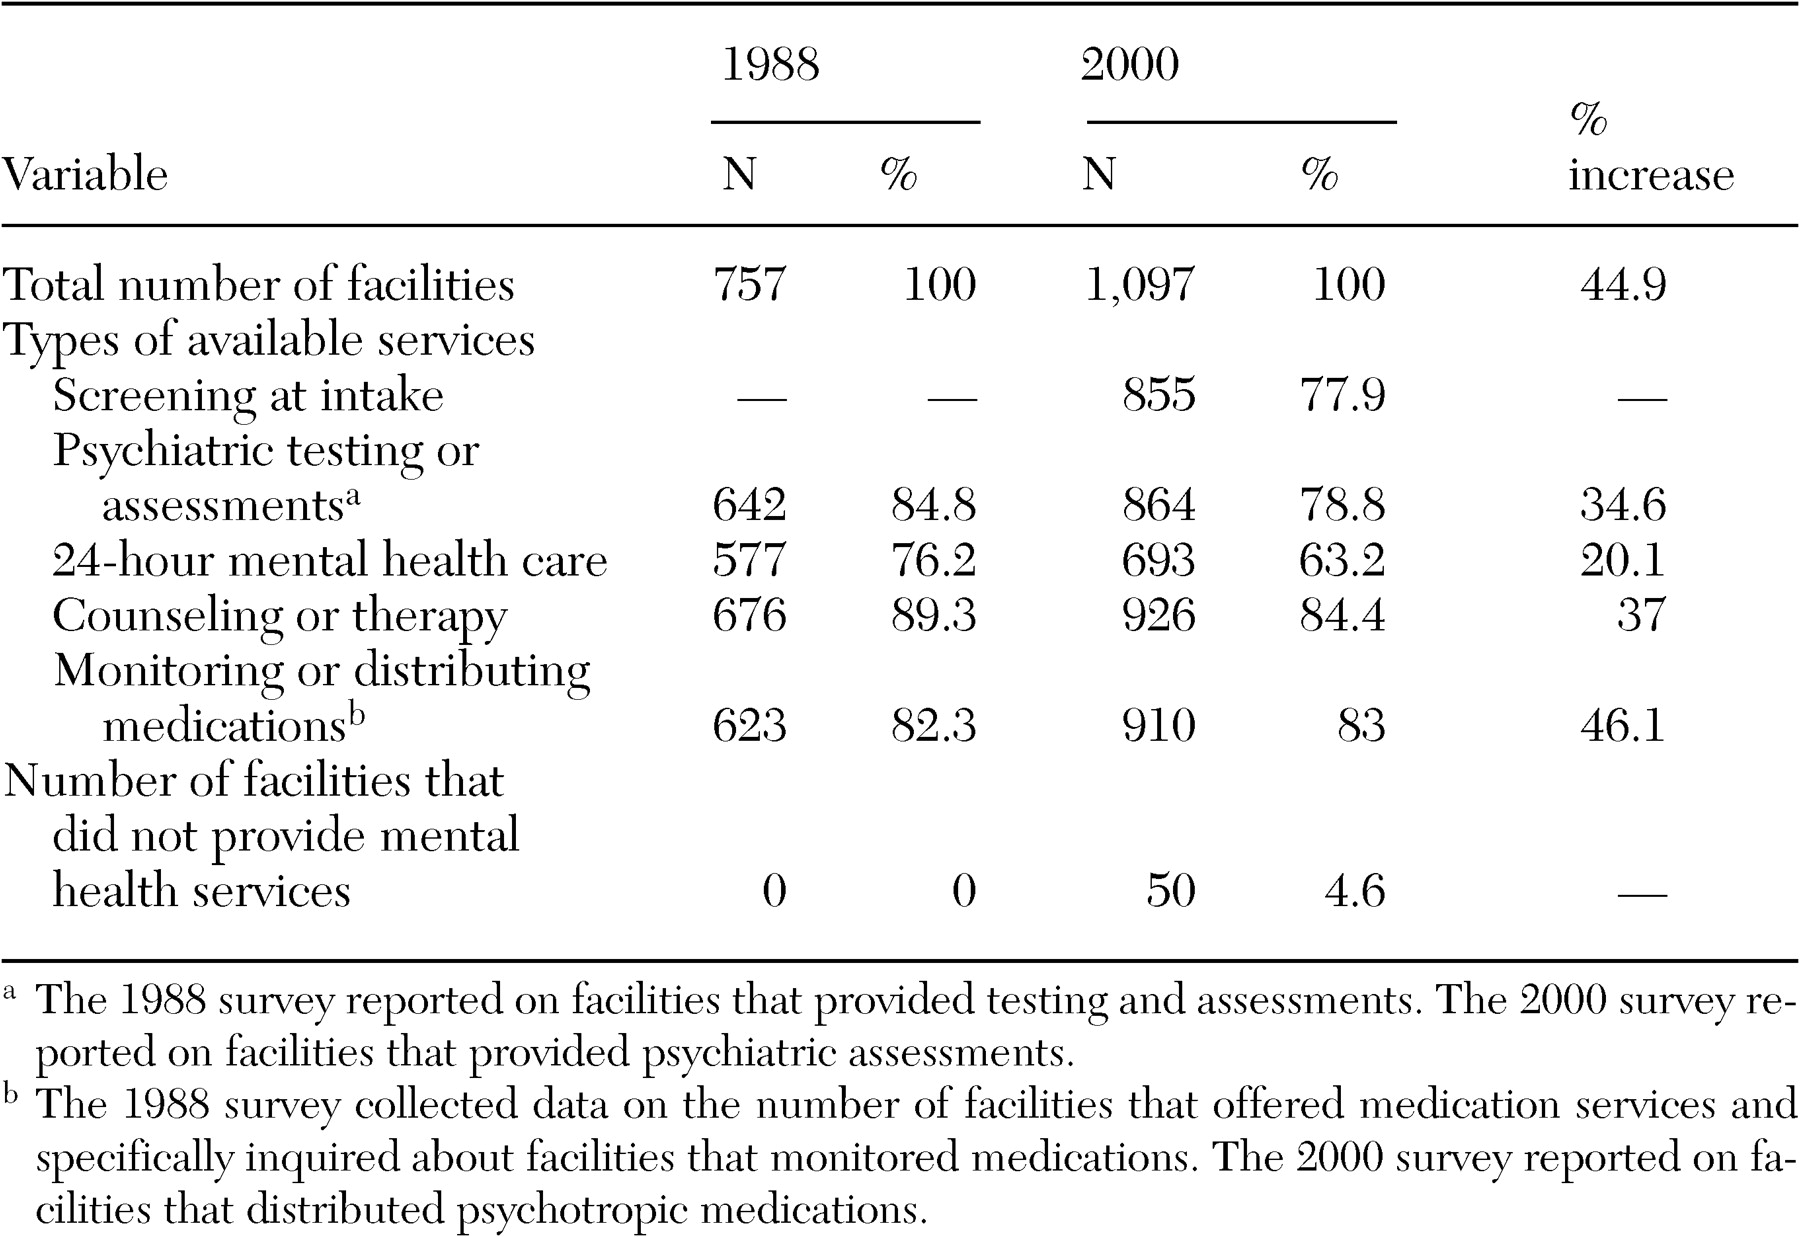
As shown in
Table 1, of the 757 facilities that we examined, 76.2 percent reported that they provided 24-hour mental health care, 89.3 percent provided counseling or therapy, and 82.3 percent monitored medication. Also, 84.8 percent of the facilities provided testing and assessment.
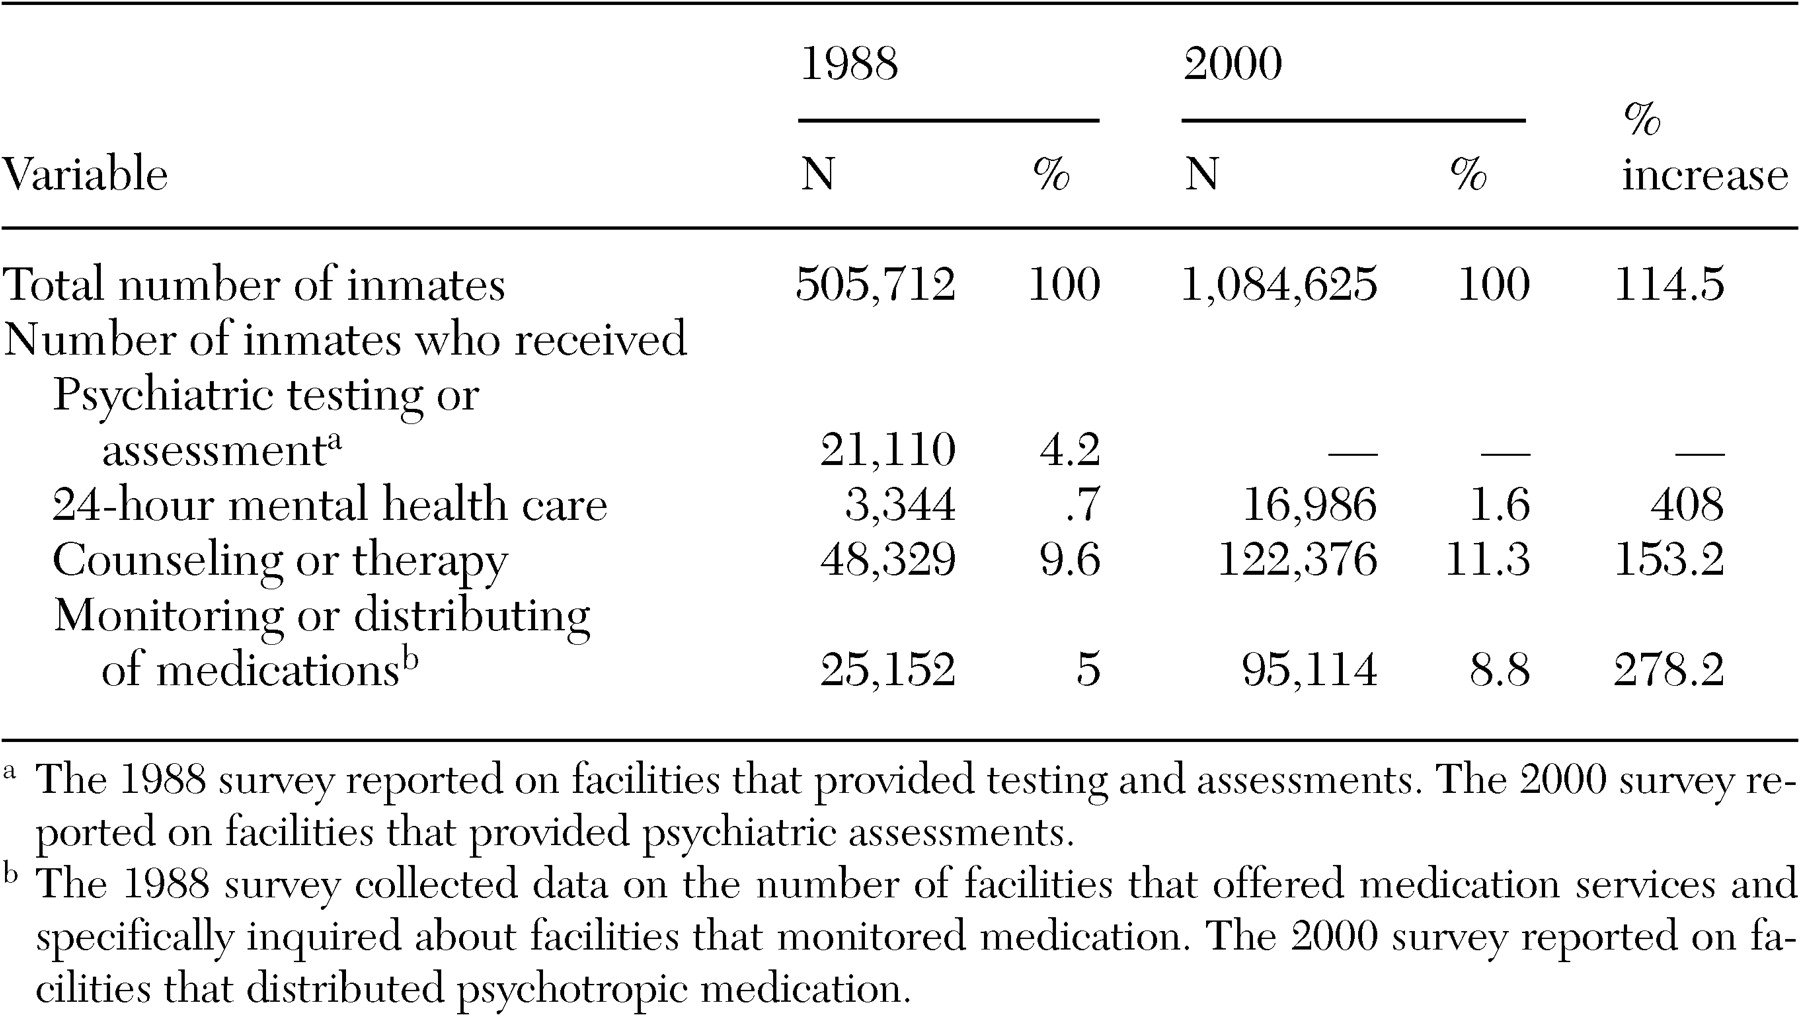
Table 2 shows that .7 percent of the 505,712 inmates in the 1988 survey used 24-hour mental health care, 9.6 percent received counseling or therapy, and 5 percent had their medication monitored. Finally, 4.2 percent received testing or assessment.
Findings from 2000
As shown in
Table 1, of the 1,097 confinement facilities that responded, 77.9 percent screened inmates at intake. Also, 63.2 percent of the facilities provided 24-hour mental health care, 78.8 percent conducted psychiatric assessments, 84.4 percent provided counseling or therapy, and 83 percent distributed medications. Of the 1,097 confinement facilities that reported, only 4.6 percent stated that they did not provide any mental health services to inmates. By security level, results indicated that 99 percent of maximum- and medium-security facilities provided some type of mental health treatment; 86.6 percent of minimum-security facilities did so as well.
Table 2 shows that 16,986 inmates (1.6 percent) used 24-hour mental health care, 122,376 (11.3 percent) received counseling or therapy, and 95,114 (8.8 percent) had medication distributed to them.
Comparative analysis
Tables 1 and
2 show the percentage increases in the availability and use of mental health services from 1988 to 2000. For our analyses, 757 state adult correctional facilities were surveyed in 1988. That number increased to 1,097 in 2000, a 44.9 percent increase. With the increase in the number of correctional facilities, a dramatic increase in the prison population was also seen—from 505,712 in 1988 to 1,084,625 in 2000, a 114.5 percent increase.
Mental health services were offered in significantly more facilities in 2000 than in 1988. However, the relative percentage of facilities that offered mental health services decreased overall. Simultaneously, the number and the percentage of inmates who used these services increased overall.
The service with the smallest percentage increase was 24-hour mental health care, which was provided by about 76.2 percent of facilities in 1988 and 63.2 percent in 2000 yet showed a 20.1 percent increase in the number of facilities offering this service. This increase was less than the 44.9 percent increase in the number of all prison facilities. Between 1988 and 2000 the percentage of inmates who used 24-hour mental health care rose from almost 1 percent to nearly 2 percent, which represented a 408 percent increase in the number of inmates who used this service (
Table 2).
The 1988 survey also reported that about 85 percent of facilities performed psychiatric testing and assessments, whereas the 2000 survey reported that about 79 percent performed psychiatric assessments, yet there was a 34.6 percent increase in the number of facilities offering this service. Data were not available from the 2000 survey on the number of prisoners who received psychiatric assessments, so a comparison between the two surveys in this category could not be done.
Facilities that provided counseling or therapy increased from 676 in 1988 to 926 in 2000, a 37 percent increase, although the relative percentage of facilities declined slightly. The number of inmates who used counseling or therapy services also increased between 1988 and 2000—from 48,329 in 1988 to 122,376 in 2000, a 153.2 percent increase in the number of inmates who used these services.
The type of service that grew the most was medication monitoring or distribution. The 1988 survey reported that 82.3 percent of facilities monitored medication. The 2000 survey reported that 83 percent distributed medication, yet there was a 46.1 percent increase in the number of facilities offering this service, which was about the same rate as the growth of all prison facilities. The percentage of inmates who received medication services also increased—from 5 percent in 1988 to 8.8 percent in 2000; this represented a 278.2 percent increase in the number of inmates who used these services.
Discussion
Between 1988 and 2000 there was a 44.9 percent increase in the number of adult state correctional facilities. At the same time there was a 114.5 percent increase in the number of adult state prisoners. The rate of growth in incarceration was more than twice the rate of facility construction.
Although the percentage increase in facilities that offered mental health services was generally below the overall rate of facility growth, we found very large increases in use of each service in question. One potential explanation for this disparity is that caseload increased in the facilities that offered services. Clearly, the growth in prison facilities and the growth in prisoner populations are outstripping the more meager growth in mental health services. These findings suggest that mental health services are becoming less available to the prison population, and service populations are becoming more concentrated in the facilities that do offer such services.
This interpretation is supported by the fact that other findings from the 2000 survey suggested that minimum- and low-security confinement facilities are less likely to offer any mental health services and that persons with mental illnesses are more likely to be confined elsewhere in the state system (
4).
Another explanation for the relative decrease in mental health services could be lack of funding for mental health staff and services. Funding for mental health services has been dwindling since the 1980s and remains a significant factor in the transinstitutionalization of persons with mental illness (
7). Clearly, a majority of resources for correctional facilities are not directed toward treatment, but rather security. Therefore, a lack of funding for mental health services may also be a limiting factor (
8).
Conclusions
Overall, mental health services in state adult correctional facilities have expanded somewhat, and use has increased dramatically. However, overall availability has decreased. Our findings have important implications for mental health policy: What should be the relative balance between service expansion and diversion? Should services be introduced at lower levels of confinement? How should we transform the specialty care sector to better serve this population? Considerably more policy discussion and research are urgently needed to illuminate these pressing questions.


