Sample
The FUS periodically investigate the use of social, cultural, and health facilities in the Netherlands. The surveys are based on nationwide household samples and contain information on all household members. FUS have been conducted every four years since 1979. The data analyzed in our study included all household members aged 16 to 74 years covered by the five FUS conducted between 1979 and 1995 (
10). All FUS had comparable research designs. About 6,000 households were interviewed each time, with responses just over 40 percent in 1991; around 60 percent in 1979, 1983, and 1987; and 70 percent in 1995. The samples were representative of households of the noninstitutionalized population in terms of household composition (gender, age, and marital status) and urbanicity of residence. In 1987 one-person households and families with grown children were slightly underrepresented (
11). Despite the varying response rates between surveys, these variations showed no association with any of the trends found in service use or help seeking. It therefore seems unlikely that nonresponse compromised our results.
All the FUS applied a relatively straightforward, random sampling procedure. A sample of private households (addresses) was drawn from postal registers in proportion to the population of each municipality included. The households were sent a letter of introduction with an explanatory leaflet. Shortly afterwards, they were contacted by the interviewers. If necessary, interviewers made several calls or visits to a given address at different times to make contact. If they succeeded, they interviewed one member of each participating household at home, generally the head of household. They also left behind extensive questionnaires for each household member aged six or older, returning to collect these later. At addresses with multiple households (which were rare), up to three families were interviewed. Respondents received no remuneration. Informed consent was obtained under prevailing Dutch regulations, and review board approval was secured from the Central Commission for Statistics (
12).
Measures
Mental health service use. Service use was determined by the question "In the past 24 months, have you been to any of the following organizations for problems of your own or of any of your household members?" The list included organizations that provided specialized mental health and social work services. The question was posed to all household members aged 16 years and older. We dichotomized answers into 0, no use, and 1, use by at least one member. Service use was assessed at the household level, because it was not known within households who had mental health problems and who received help for them.
Household characteristics. Household composition was divided into five categories: two partners living with children, two partners living without children, one person without a partner living with children, one person living alone, and other.
Household income refers to the net income of the primary breadwinner and partner (if any), excluding child allowance (that is, regular payment by the state to the parents of a child up to a certain age) and income from working children. We recoded household income into four ordinal categories, low to high (categories were created by placing 25 percent of the households in each income group). Missing answers were relatively frequent (21 percent). To avoid a serious reduction of the effective sample size, we treated these missing data as a separate category in the analyses.
Social position of primary breadwinner and partner (if any) was broken down into seven household categories on the basis of principal daily activities: employed, student, retired, dependent on benefits, housewife or househusband, employed breadwinner with a partner who was a housewife or househusband, and other.
Education of primary breadwinner and partner (if any) refers to the highest educational attainment. Categories ranged from primary school to higher professional or university education. Couples whose education levels differed by more than 1 point on this 4-point scale were defined as heterogamous couples (37 percent).
Religious identification of primary breadwinner and partner (if any) was determined by the question "What church or what religious group do you mainly feel part of?" and was dichotomized in terms of identifying with (
1) or not identifying with (0) a religious group. Couples who differed were classified as heterogamous (9 percent).
Other characteristics included the mean age of primary breadwinner and partner (if any) and the urbanicity of household location. Urbanicity ranged from rural, score of 1, to highly urbanized, score of 5.
Statistical analysis
After deleting cases with missing values on relevant items, we performed separate analyses for the two types of services—specialized mental health care and social work services—comparing the households that used the type of service with those that did not.
The aim of our study was to show a trend of service use from 1979 to 1995. For this analysis, we used as the reference category the (weighted) average service use of all households over the entire period. The analyses for mental health care used data for 28,264 households, and the analyses for social work services used data for 28,274 households. This approach, which is commonly used in demographic research (
13), is unusual in the study of service use. Therefore, a more detailed description of our methods will be given.
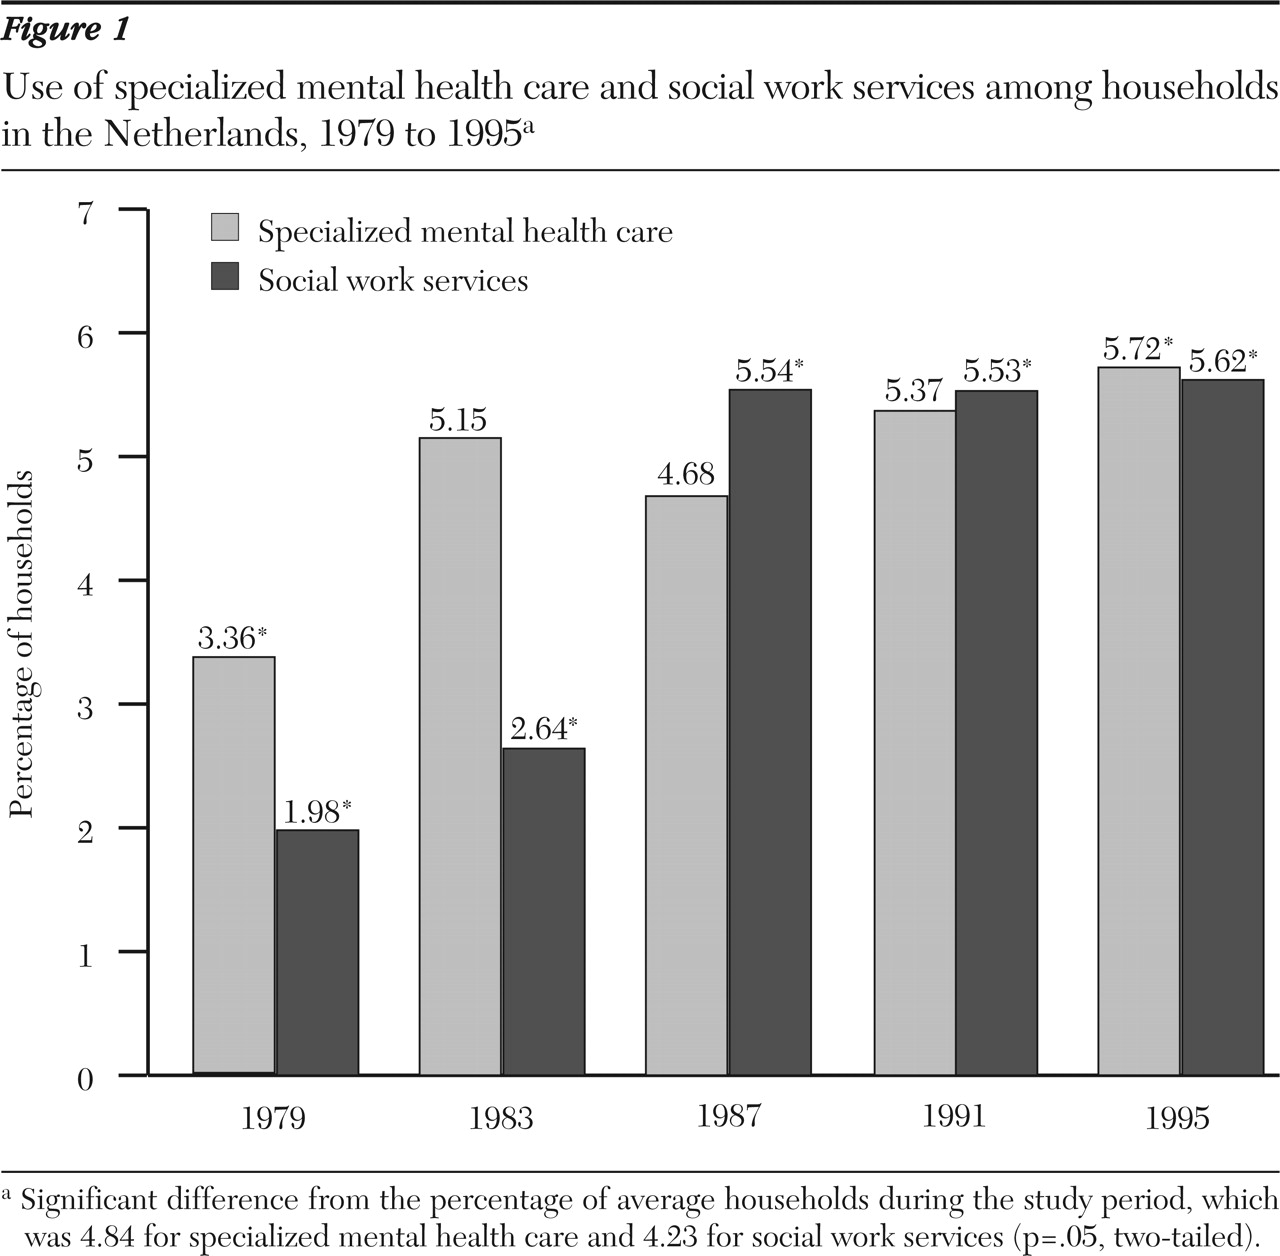
First, we constructed contingency tables to calculate the percentage of households that used the two types of services in each of the five years that the survey was given. We then calculated whether these percentages differed from the overall mean percentages of all households that used the services over the entire study period. These analyses addressed whether service use increased over time. A trial use of weighting in the calculations did not result in a different conclusion.
Second, we pooled the data and performed seven stepwise multiple logistic regression analyses for both types of service use. For each of the seven household characteristics (for example, household composition) we explored whether its particular household categories (for example, two partners living with children) made greater or less relative use of these services over time. In addressing this question, we used interaction terms in our stepwise multiple logistic regression analyses (in particular, a household characteristic with its particular household categories multiplied the study years). In the first step of our multiple logistic regression analyses we entered two variables: a certain household characteristic and the study year. In the second step we entered interaction terms between these two variables by using forward selection: the particular household categories multiplied by the study years. As the reference category we used the weighted average service use of all household categories over the entire study period (
14).
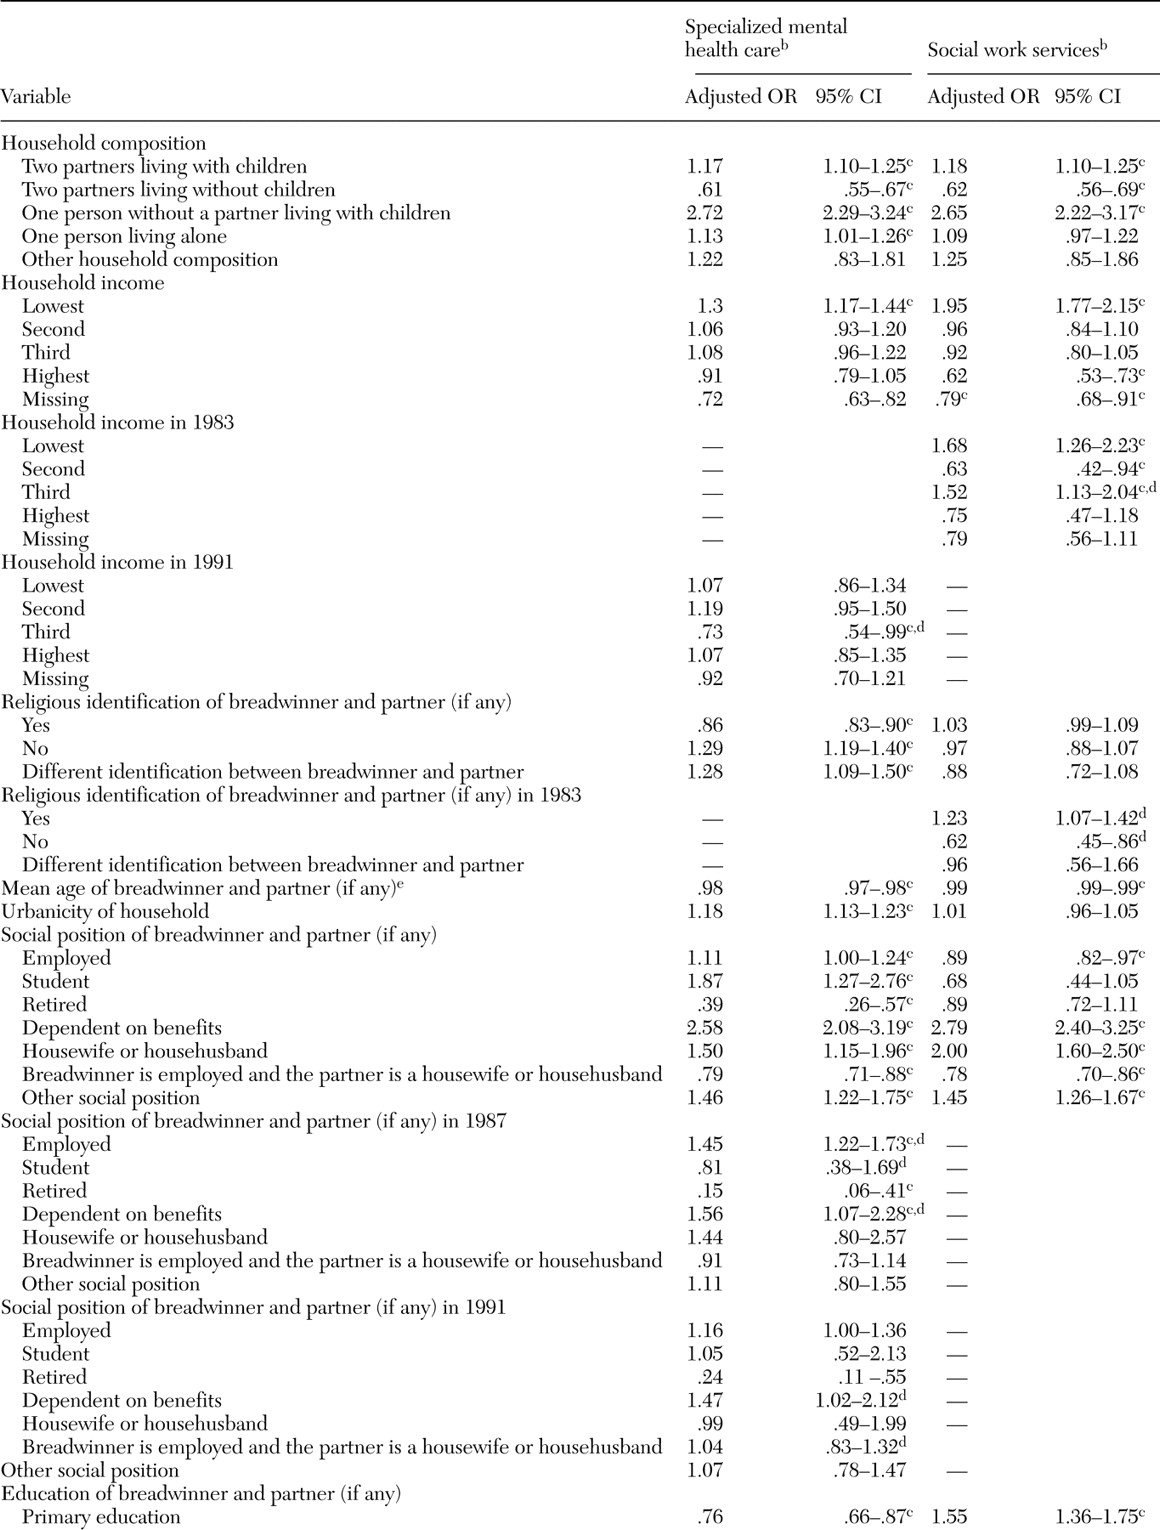
For each of the seven household characteristics we performed two multiple logistic regression analyses. In each analysis for a particular household characteristic—for example, household composition—we explored the presence of interaction effects (that is whether the odds of using a service varied for the particular household categories over time) and reported only the significant interaction effects.
If there was no significant interaction term between one of the particular household categories and a study year, we presented the odds ratios for each of the household categories while controlling for the effect of study year.
If there was a significant interaction term between a household category and study year, we calculated the particular odds ratio for that household category in that particular year. We present this odds ratio as well as the one in the other years for the particular household categories. In this way it becomes clear to what extent the odds of making use of the services can fluctuate over time for household categories compared with the average household.
Finally, we performed one stepwise multiple logistic regression analysis for both types of service use, using the method described above. We adjusted not only for the study year but also for other household characteristics. In the first step of our multiple logistic regression analysis we entered all household characteristics and study year simultaneously. In the second step we entered interaction terms between these variables by using forward selection: all household categories by study years. As a reference category we again used the weighted average service use of all household categories over the entire study period. Results of these analyses were not tabulated here, because they did not differ substantially from those presented.
All statistical analyses were performed with SPSS version 12.0 for Windows.
No results were weighted, as we were seeking to explain, rather than describe, the interrelationships between determinants and service use. The necessity of adjusting for sampling characteristics in analytic studies is the subject of ongoing debate. Most of the time overall conclusions do not substantially change when sample weights are used (
15,
16).