Full access
Regular Article
Published Online: November 1999

Changes in Prefrontal Cortex and Paralimbic Activity in Depression Following Two Weeks of Daily Left Prefrontal TMS

Publication: The Journal of Neuropsychiatry and Clinical Neurosciences

Abstract

Twenty-two depressed adults were scanned with perfusion single-photon computed emission tomography before and after 2 weeks of left prefrontal transcranial magnetic stimulation (TMS) in a parallel design, double-blind treatment study. At medication-free baseline, across all subjects, blood flow in the bilateral medial temporal lobes, left prefrontal cortex, and caudate significantly declined with increased depression severity. Also at baseline, depressed adults who responded to TMS, compared with nonresponders, showed increased inferior frontal lobe activity. Following treatment, there was an even greater difference in inferior frontal blood flow in responders compared with nonresponders, and the negative baseline correlations between depression severity and limbic and prefrontal blood flow disappeared. These results suggest that in depressed adults, 10 days of prefrontal TMS affects prefrontal and paralimbic activity, which may explain its antidepressant effects.
Transcranial magnetic stimulation (TMS) is a method for noninvasively inducing electrical impulses and stimulating the brain. A brief but powerful electrical current is passed through a small coil of wire on the scalp. This generates a magnetic field that passes unimpeded through the skull and induces a weaker electrical current in the brain.14 Some have called this “electrodeless” electrical stimulation to emphasize that the magnetic current is merely the force that converts electrical energy in the coil into electrical currents in the brain.
This noninvasive ability to stimulate the brain makes TMS a powerful research tool in studying a host of cognitive processes such as the motor system,58 vision,9 language,10 and even memory.11 There has been much interest in whether TMS might work as an antidepressant (see reviews4,12,13). Building on open studies where TMS was applied over the vertex to treat depression (with inconclusive results),1416 George and Wassermann17 proposed in 1994 that TMS applied to the prefrontal cortex might be more effective. They based their argument on evidence that electroconvulsive therapy (ECT) response is linked to changes in prefrontal function,18 and on functional imaging studies in depression where prefrontal cortex has been shown to be dysregulated (see reviews19,20). Recently, several parallel design double-blind treatment trials have suggested that prefrontal TMS applied daily over 2 to 3 weeks can work as an antidepressant.2124
The mechanisms of action of prefrontal TMS as an antidepressant are unknown. Previous work in healthy adult volunteers has shown that prefrontal TMS (and not TMS at other brain regions) increases serum thyroid measures, hinting that changes in mood might be due to neuroendocrine changes.25 In addition, two imaging studies during TMS in healthy control subjects have begun to shed some light on what may be happening in the brain during stimulation. Kimbrell et al.26 used fluorodeoxyglucose (FDG) positron emission tomography (PET) to image the effects of 20 minutes of prefrontal TMS at 1 Hz and found that stimulation, compared with a sham condition, was associated with a global reduction in activity. In addition, TMS caused relative decreases in activity both below the site of stimulation and in deeper regions including the caudate, orbitofrontal cortex, and cerebellum. George and co-workers27,28 used perfusion SPECT to image cerebral blood flow during fast (20 Hz) left dorsolateral prefrontal cortex (DLPFC) TMS in healthy adults. Compared with a sham condition, TMS was associated with relative decreases in activity in the anterior cingulate, right prefrontal, and orbitofrontal cortex and relative increases in activity in the brainstem and cerebellum. In summary, these two imaging studies of prefrontal cortex TMS in healthy adults suggest that TMS is likely having both local cortical effects immediately below the site of stimulation and secondary limbic changes.
To further study the effects of TMS on mood and the brain, we imaged resting brain activity in depressed patients before and after participation in a randomized double-blind placebo-controlled treatment trial. On the basis of previous studies of the putative regional neuroanatomy of mood dysregulation in depression20 and previous work in healthy control subjects with left DLPFC SPECT,27 we posed the following pre-study hypotheses:
1. Regional cerebral blood flow (rCBF) in the prefrontal cortex near the TMS coil (DLPFC) and in specific parts of the limbic and paralimbic systems (cingulate, caudate, anterior temporal poles, inferior frontal, orbitofrontal and medial temporal cortex) is dysfunctional at baseline in depression.
2. Two weeks of daily left prefrontal TMS alters activity in these regions.
3. Baseline activity in these regions differs in TMS responders compared with nonresponders.

METHODS

Subjects

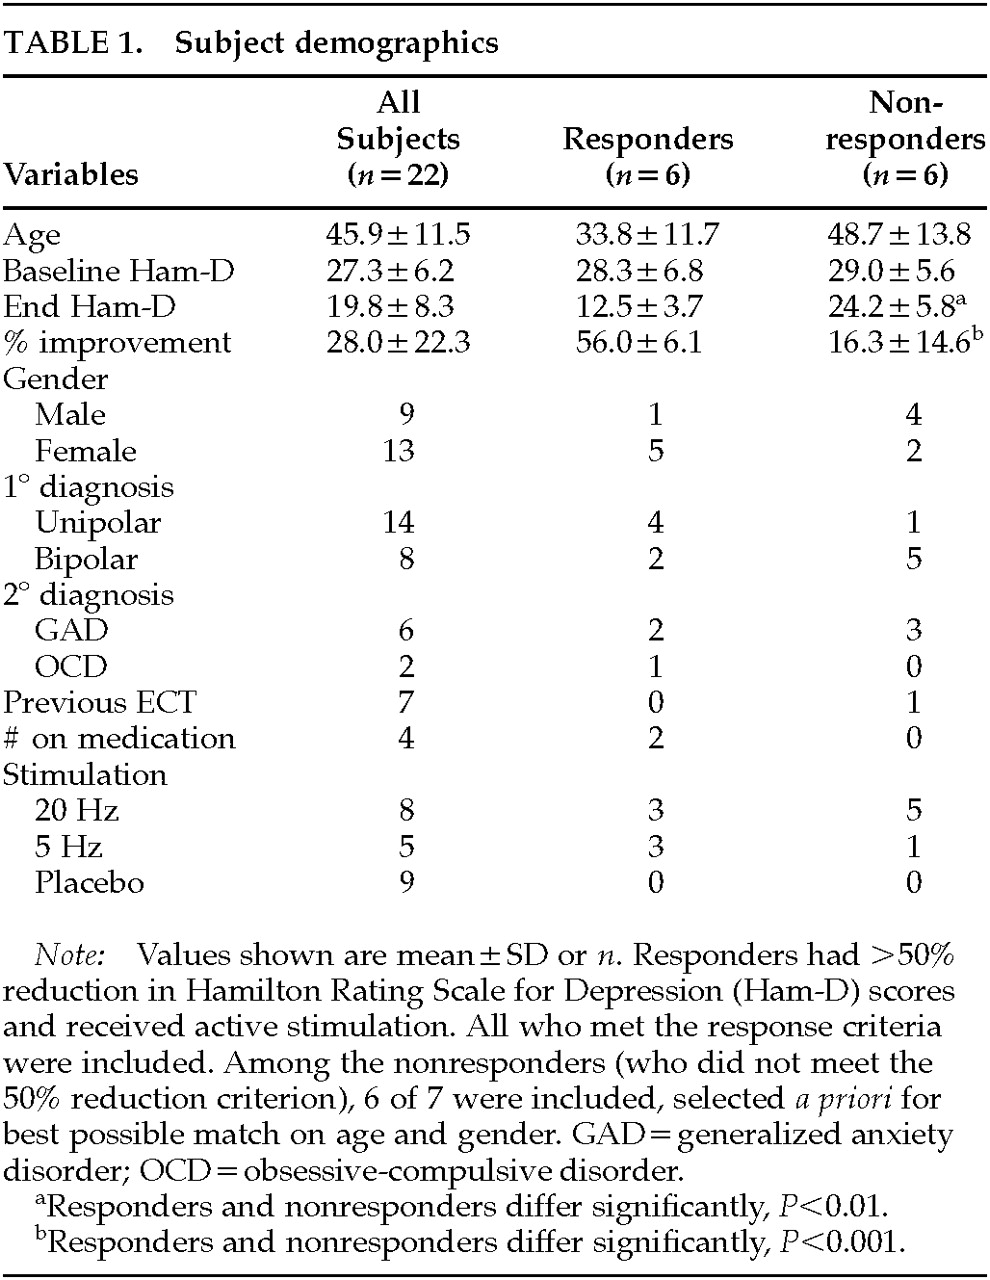
Twenty-seven depressed subjects who were enrolled in a 2-week double-blind placebo-controlled trial of TMS were scanned (as described below) immediately before and then 3 days after 2 weeks of TMS treatment. Five subjects were excluded from final analysis because they lacked either the baseline or end SPECT scan or the data were not usable. Thus, 22 patients (9 men) who met DSM-IV criteria for either major unipolar depression (n=14; 5 men) or bipolar depression, depressive phase (n=8; 4 men) were used for the final analysis. Although failure to respond to other antidepressant medications was not an explicit entry criterion, this cohort was largely treatment refractory and had been ill for many months before enrolling in this trial. The average number of years since the first diagnosis of depression was 21.9 years (SD=11.8, n=16), and the average duration of the current episode was 21.7 months (SD=22.1, n=18). Of the 22 subjects, 13 received active stimulation and 9 received placebo. Complete information about this clinical treatment trial is reported elsewhere (Nahas et al.29 and manuscript under review).
Subjects were free of antidepressant medications for at least 2 weeks prior to study entry, although 3 bipolar patients required ongoing mood stabilizers or benzodiazepines for anxiety (1 each received valproic acid, clonazepam, and lithium plus alprazolam), and 1 patient required medication for thyroid disease (thyroxine). All subjects gave written informed consent following full explanation of the procedures and risks. See Table 1 for complete subject information.

Ratings and Response Classification

Before entering the study, subjects were screened and diagnosed by using the Schedule for Affective Disorders and Schizophrenia (SADS).30 In addition, the 21-item Hamilton Rating Scale for Depression (Ham-D)31 was obtained at baseline and at end of study. Trained psychiatric nurses, blind to treatment arm, performed all ratings.
Ham-D scores were used to calculate percentage improvement between the beginning and the end of treatment. Following convention,32,33 subjects who showed 50% improvement or better at 2 weeks from baseline were classified as responders. Six of the 13 subjects who received active treatment met this pre-study criterion for treatment response. Six subjects who received active treatment but who were not responders were then chosen to best match the responders on key variables (age, gender). No subjects receiving placebo met response criteria.

Transcranial Magnetic Stimulation

TMS was performed with a Cadwell Magnetic Stimulator equipped with a figure 8–shaped coil and a continuous water cooling system to prevent overheating. Subjects received treatment for 10 days (all weekdays over 2 weeks) for 20 minutes per day at 100% of motor threshold. Subjects were randomly assigned to receive stimulation at either 20 Hz (2 s on, 28 s off), 5 Hz (8 s on, 22 s off), or placebo (coil angled at 45 degrees with one wing touching so that the bulk of the magnetic field did not pass through the skull). Because of the small sample sizes, for the purposes of this imaging analysis subjects receiving 20 Hz and 5 Hz stimulation were pooled into one “active” group.
Motor threshold was determined by placing the coil over primary motor cortex and determining the minimum amount of stimulation required to initiate visible motor movement at rest of the contralateral (right) abductor pollicis brevis (APB) muscle. The left prefrontal cortex stimulation site was defined as the location 5 cm rostral to and in a parasagittal plane from the site of APB stimulation.

Single-Photon Emission Computed Tomography (SPECT) Imaging

Whole-brain resting SPECT imaging was performed 3 days prior to starting TMS and 3 to 4 days after the last TMS session (but prior to restarting any medications). Intravenous access was obtained, followed by a 15-minute rest period during which subjects sat in a dark, quiet room with eyes closed. Thirty mCi (1,110 MBq) of technetium-99 bicisate (ECD; Neurolite®, DuPont Pharma) were injected, followed by an additional 15 minutes of rest before scan acquisition.
SPECT images were acquired by using a triple-headed Picker camera with low-energy ultra-high resolution fan beam collimators. They were processed on an Odyssey VP computer using a low-pass filter with the default order of 2+0.32 as the cutoff. Images were attenuation-corrected and reconstructed transversely and then transferred to a Sun SPARC20 for analysis. Statistical Parametric Mapping (SPM96b) software was used to apply a 10-mm smoothing followed by linear normalization into Talairach space.34 These normalized images of relative brain perfusion were used as the dependent variable in the analyses.

Analyses

The data analysis used a two-stage approach. Both approaches used Statistical Parametric Mapping (SPM96) software, which does not distinguish between hypothesis-driven and more exploratory analyses. The data were compared across conditions by using a threshold of P<0.01, with a gray matter threshold of 0.6 and proportional scaling of the grand mean at 50. The following analyses were performed to test hypotheses regarding specific regions:
1. To test the hypothesis that baseline activity in the DLPFC and specified limbic regions correlates with depression severity, baseline Ham-D scores were compared with baseline regional blood flow by using Pearson's correlations.
2. To test the hypothesis that baseline relationships change over 2 weeks of TMS treatment, correlations between end Ham-D scores and end blood flow in these predetermined regions were computed. In addition, change in activity over time (baseline versus end) was analyzed within the responder and placebo groups by using two-tailed paired Student's t-tests.
3. To test the hypothesis that baseline activity in the predetermined regions might distinguish TMS responders from nonresponders, blood flow in these regions at baseline was compared across groups. These analyses were repeated at the end to see whether TMS had affected the differences in activity between the two groups.
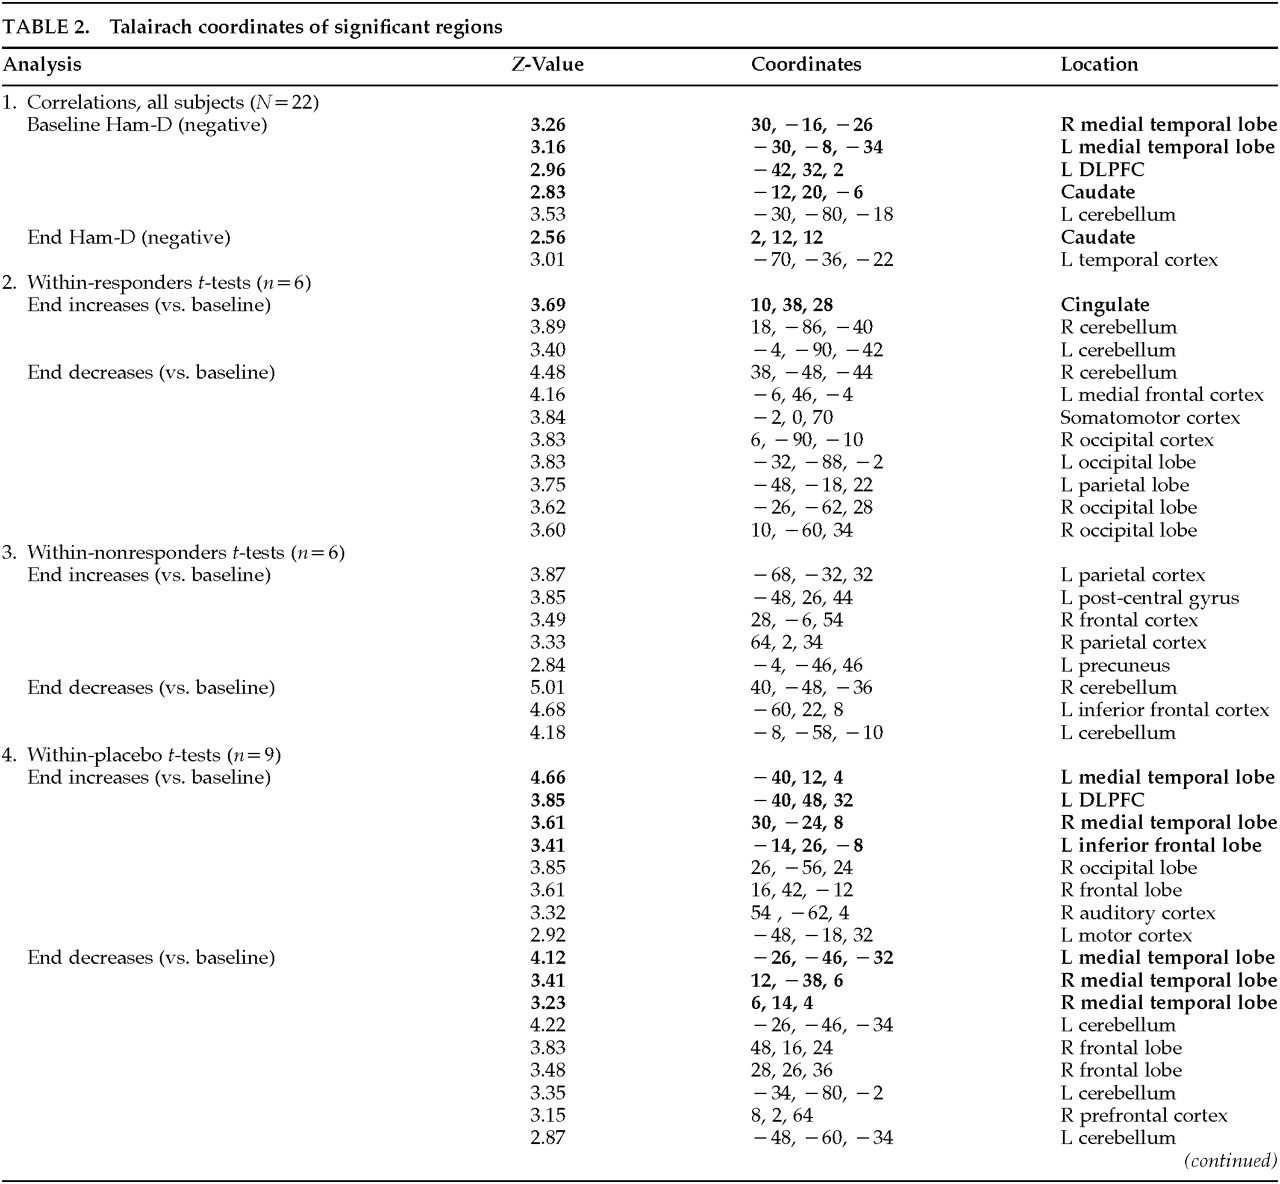
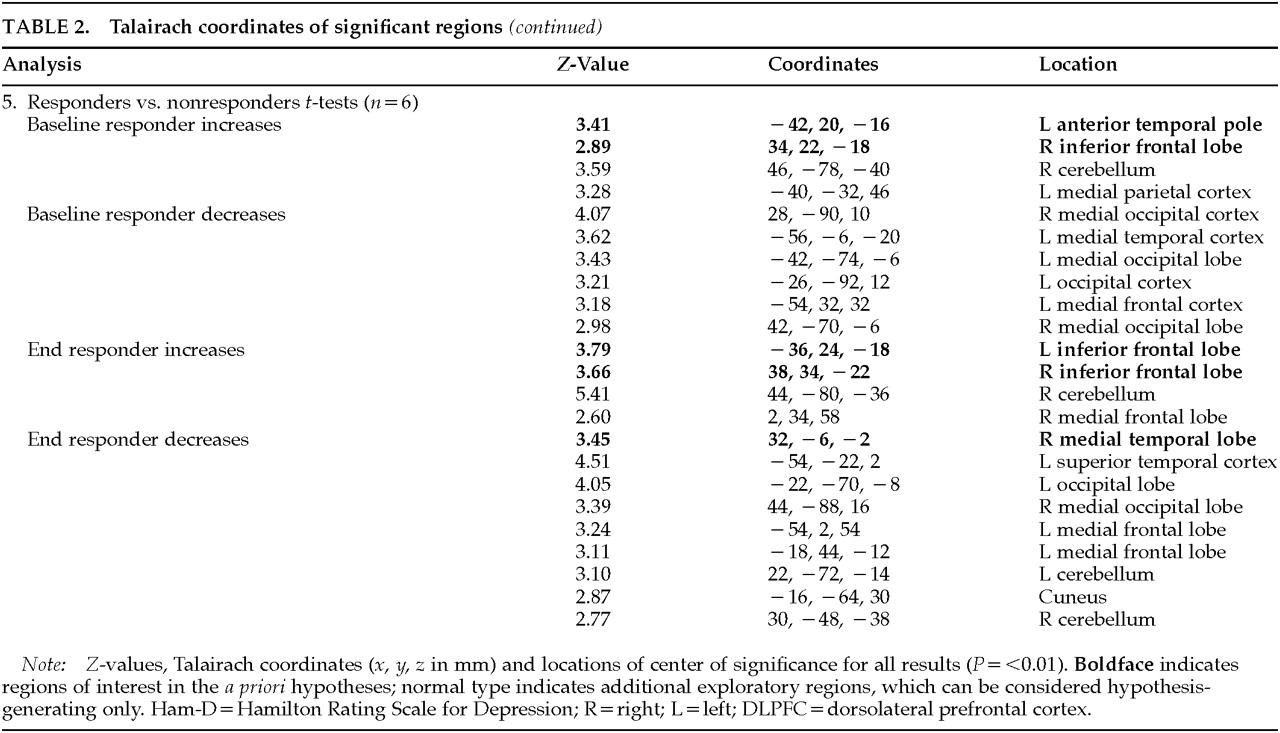
This was the full extent of the hypothesis-driven analyses. These analyzed regions are listed in bold in Table 2A and Table 2B. Because SPM performs analyses on all regions irrespective of a priori hypotheses, we report changes in other regions (shown in the table in medium type) as well for all contrasts performed. Because these were not hypothesis-driven, they must be considered exploratory and await further testing in later studies.

RESULTS

Correlational Analysis of Regional Activity and Depression Severity

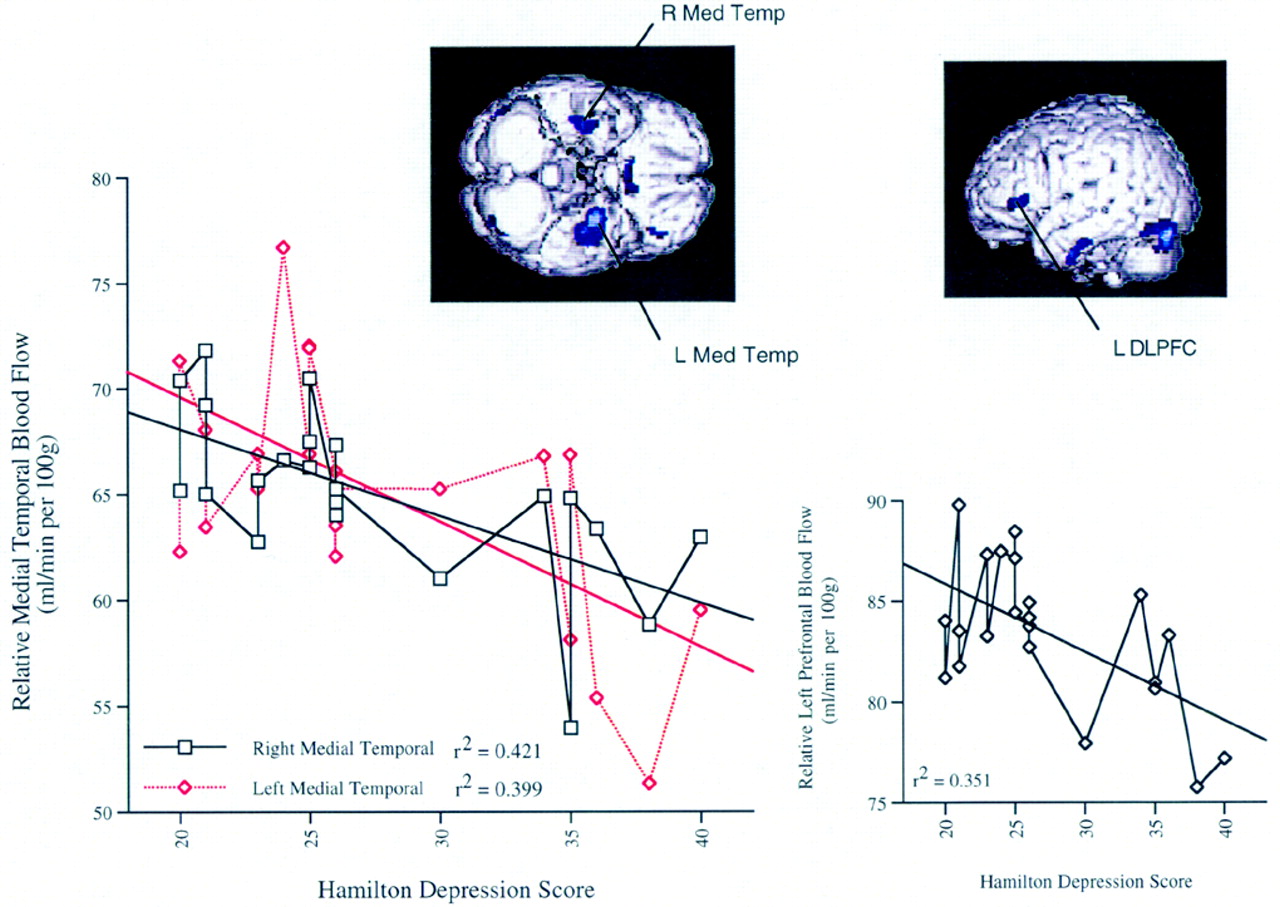
Confirming the pre-study hypothesis, depression severity across all depressed subjects (N=22) at baseline was inversely correlated with activity in the bilateral medial temporal lobes, left DLPFC, and caudate (Figure 1 and Table 2A and Table 2B). Ham-D did not significantly correlate with blood flow at baseline in the orbitofrontal cortex or other predefined regions. Following treatment, severity of depression (Ham-D, end) in these same subjects (n=22) was inversely correlated with activity in the caudate only.

Changes Following TMS

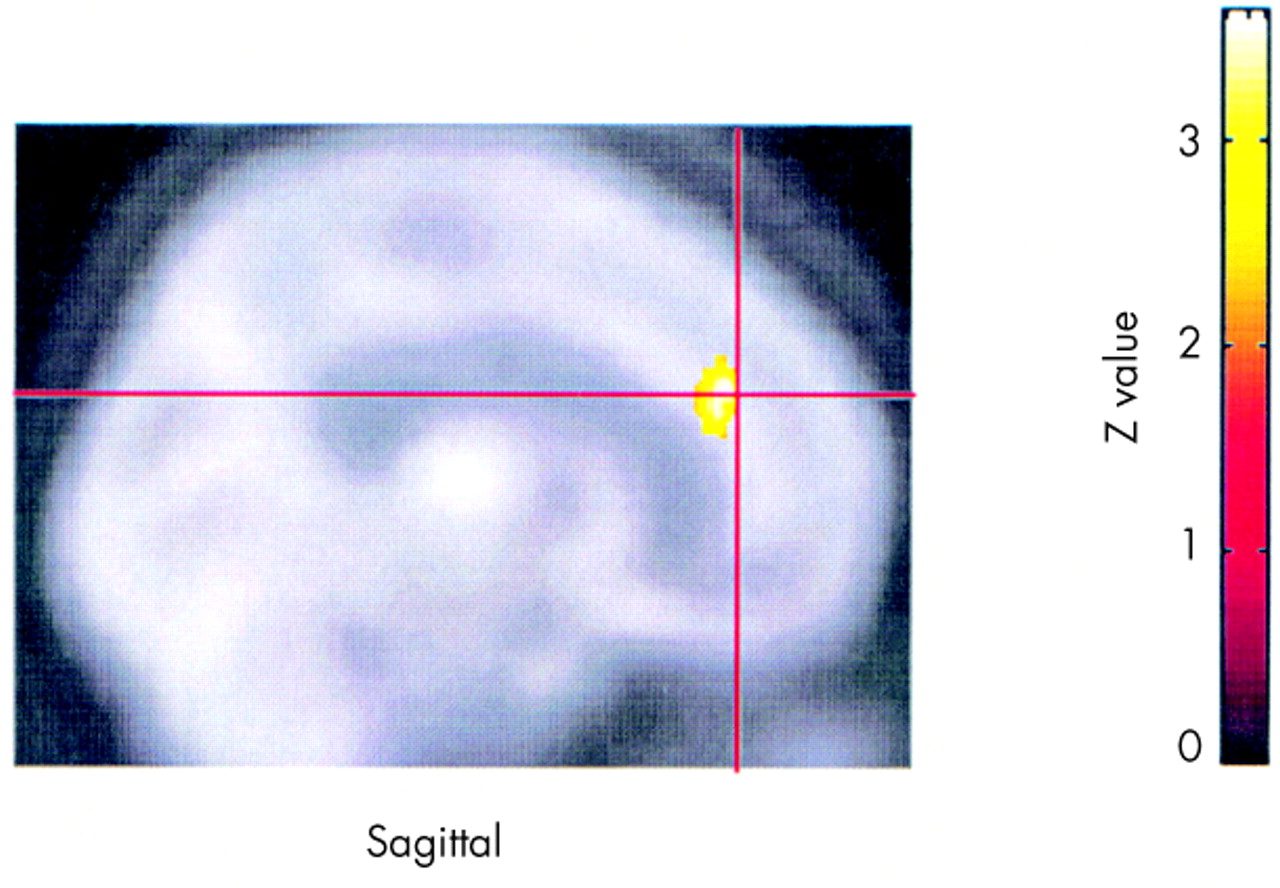
TMS responders showed increased activity, at end compared with baseline, in the cingulate (Figure 2). Nonresponders showed no changes in the hypothesized regions across the same time interval. Subjects receiving placebo (n=9) showed increased activity, at end compared with baseline, in the medial temporal and inferior frontal lobes and left DLPFC, and decreased activity in other regions of the medial temporal lobes.

Differences Between Responders and Nonresponders

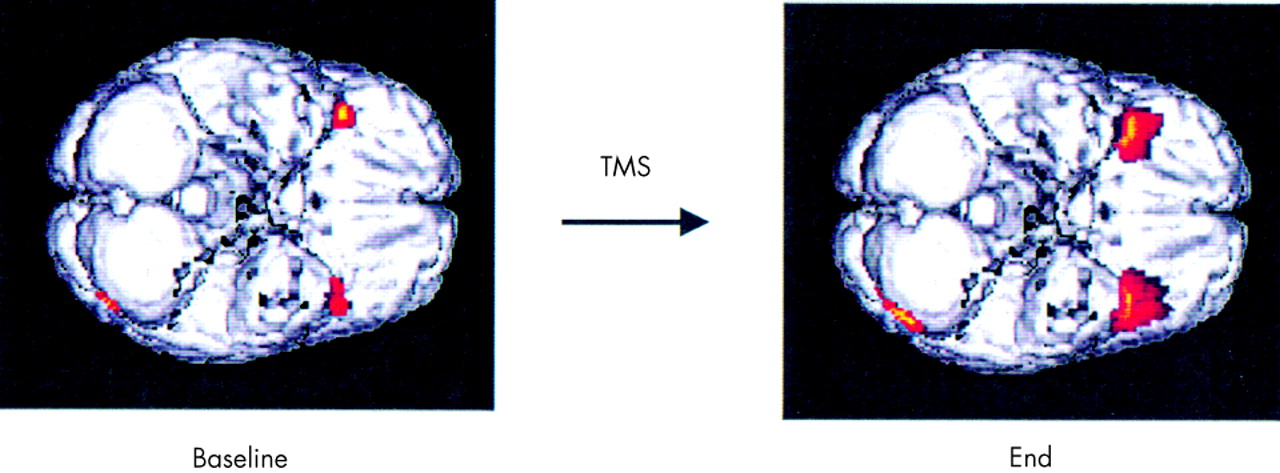
At baseline, responders compared with nonresponders had increased activity in the bilateral anterior temporal lobes. Following treatment, there was an even greater between-group difference in anterior temporal and cortical blood flow in responders compared with nonresponders (Figure 3). At the end, responders also showed decreased activity in the right medial temporal lobe. To further understand these between-group differences, we plotted the actual mean values by group at the anterior temporal poles (right, 42,20,–16; left, –34,22,–18), which differed significantly between groups. At both baseline and after treatment, responders compared with nonresponders had increased rCBF bilaterally in these anterior temporal regions. After treatment, compared with baseline, within-groups anterior temporal rCBF was decreased, except in the left anterior temporal pole in responders only, where it was unchanged (baseline, right, and left in responders [76.765, 73.011] and nonresponders [70.887, 66.069]; end, right, and left in responders [76.399, 73.579] and nonresponders [69.509, 63.215]).
To further investigate the potential role of several of the variables that are known to affect regional brain activity and that were not completely matched across the between-group comparisons of responders versus nonresponders, we performed between-group t-tests (using baseline scans) separating individuals first by gender, then by medication status (on mood stabilizers or not), and finally by primary diagnosis (unipolar versus bipolar). We also performed a correlational analysis across all subjects with age as the external variable. Results were inspected for differences only in the regions that differed between responders and nonresponders and that changed across treatment or correlated with depression severity. No significant correlations or between-group differences were found in these regions. However, women did show increased limbic activity compared with men, but not in the regions found to be significant in the primary analyses of this study.

DISCUSSION

This is the first study examining regional brain activity before and after TMS used as a potential antidepressant treatment. As such, it has several limitations that are discussed in detail below. However, this study had four key findings, some of which require replication before firm acceptance:
1. Confirming several other studies, baseline Ham-D inversely correlated with prefrontal and limbic activity.
2. These Ham-D correlations were not seen across the group as a whole immediately following treatment.
3. Regional cerebral blood flow changed in limbic regions as a function of mood improvement, both with TMS and with placebo.
4. TMS antidepressant responders differed from nonresponders in inferior frontal activity, at baseline and even more following treatment.
This study in a largely treatment-refractory outpatient sample confirms previous studies that have implicated DLPFC and the limbic system in mood dysregulation.20,35 Several previous studies have found that as depression severity worsened, there was less activity in the prefrontal lobes and caudate.3638 Here, the left DLPFC region that negatively correlated with severity of depression was not the site of direct TMS stimulation but was approximately 4 cm inferior. The fact that these negative correlations (except caudate) were no longer significant after treatment across all subjects might suggest that 2 weeks of left DLPFC TMS may alter brain activity in these regions and the relationship to mood. However, as these findings are correlational in nature, they should not be viewed as causal and must await replication in noncorrelational analyses.
The finding that responders showed increased activity in the cingulate at end compared with baseline also supports the hypothesis of changes in paralimbic activity in association with improvement of mood in general. The cingulate is an important structure mediating both attention3941 and other higher behavior.4246 It has been shown to be blunted in depressed subjects undergoing a neuropsychological challenge.47 Further, increased cingulate activity has been shown to predict antidepressant response to sleep deprivation48,49 or fluoxetine50 and to predict who among a group of remitted depressed subjects will relapse with a pharmacological challenge.51
Interestingly, we also found significant changes in rCBF in important limbic and prefrontal regions in the group receiving placebo. The placebo group did have a small improvement in mood (Ham-D scores decreased by an average of 20.5%; range 7.7–45), and these regional brain activity changes most likely reflect a state change away from a more severe depression. These findings in the placebo group show that one should use caution when attributing changes specifically to TMS rather than to state changes associated with depression. It is also possible that the placebo treatment actually directly affects the brain. Lisanby and Sackeim12,52 have shown in primates with temporal lobe depth electrodes that prefrontal TMS, even with an angled coil as used in our placebo arm, can cause immediate changes in EEG signal from those deep regions.
Responders compared with nonresponders had increased inferior frontal activity at baseline, suggesting that it may be possible at baseline to identify potential TMS responders. However, the small number of subjects in this analysis argues for caution and the need for replication before acceptance. The differences between responders and nonresponders increased in the same regions at the end, suggesting that perhaps responders had undergone a further normalization of activity in these regions. Responders also had decreased medial temporal activity following treatment.
Although the finding of decreased medial temporal activity in responders following treatment seems paradoxical, it is consistent with the pre-study hypothesis that prefrontal TMS produces changes in paralimbic regions and that these changes are linked in a complex way to the antidepressant effects. Studies in animals have recently shown that the prefrontal cortex has a negative, inhibitory effect on limbic structures (particularly the amygdala).53 Thus, repeated prefrontal TMS that boosts prefrontal cortex activity might cause secondary reciprocal inhibition over time in limbic projections. Differential effects of prefrontal cortex TMS locally compared with limbic regions may also explain the lack of correlation of depression severity with paralimbic regions at the end of treatment.
This study has several limitations that bear on proper interpretation of the findings as a whole. These images provide only a snapshot (before and after TMS treatment over 2 weeks) of activity of processes that are dynamic in nature, most likely as part of a larger system. A further complicating matter is that even small structures in the limbic system are composed of multiple smaller nuclei, many of which act discretely, sometimes antagonistically. A SPECT camera with a 7-mm initial resolution rising to 20 mm after smoothing and transformation into Talairach space must sum activity over these discrete areas.
Additional limitations include the relative rather than absolute nature of the data that SPECT imaging provides. Moreover, the study lacks a control group and suffers from small sample sizes, especially in analysis of differences between responders and nonresponders. Because of the small sample size, subjects were pooled across the two active treatment arms with different frequencies (5 Hz and 20 Hz) and could not be matched on some factors known to affect blood flow (including age, gender, and depression type). Although it is unlikely that these differences could account for changes within the same person over time, they pose a potential confound for between-group comparisons. The post hoc examinations, which are also limited by small sample sizes, provide some soft evidence that, within this particular sample, these factors did not contribute significantly to the findings.
Lastly, the possibility that the changes and deficits in activity originated in structural differences cannot be ruled out, although it is unlikely that such changes would occur over a 2-week period. Volumetric structural MRI scans were acquired on all subjects, at baseline and end of study. Measurements of prefrontal cortical volume before and after 2 weeks of TMS did not show any significant differences.54
In spite of these limitations, this study provides an important first look at the potential antidepressant mechanisms of TMS. It supports the previously hypothesized involvement of left DLPFC in depression. In addition, the more profound changes appear to take place in deeper regions, implying that TMS acts secondarily on these areas, perhaps through hypothesized prefrontal cortex governance of limbic structures. These findings suggest that the antidepressant mechanisms of TMS may differ from those of ECT, which appears to cause a reduction in prefrontal activity that is associated with treatment response.18,55,56 TMS, in contrast, appears to increase relative activity, especially in the cingulate, in responders only. Using various forms of functional imaging to investigate the regional brain effects of TMS appears to have potential for understanding the pathogenesis and regional neurobiology of pathological mood regulation.6,5661

ACKNOWLEDGMENTS

The authors thank DuPont Pharma for donating the radiotracer used (ECD); the National Alliance for Research on Schizophrenia and Depression (NARSAD) for a Young Investigator Award to M.S.G. for the TMS clinical trial; and Drs. Jeremy Young, James Ballenger, and George Arana for administrative support of this project. This work was previously presented in abstract form.62,63
FIGURE 1. Lower medial temporal and left prefrontal blood flow with greater severity of depressionInferior (left image) and left lateral (right image) views of the brain show regions in which activity is negatively correlated with depression severity in 22 depressed adults at baseline (P<0.01). The left graph displays data points and correlation coefficients for the most significant regions in the left and right medial temporal lobes (Med Temp). The right graph displays the same information for left dorsolateral prefrontal cortex (DLPFC). Higher Hamilton Depression scores indicate more severe depression.
FIGURE 2. Changes within respondersSignificant increases in activity within responders over time (at end vs. baseline) are displayed on a Talairach template at P<0.01, with a midline view of the brain. Areas in red are significant increases; areas in yellow are highly significant increases.
FIGURE 3. Regions more active in responders compared with nonrespondersSignificant areas of between-group difference are displayed on a Talairach template at P<0.01, with an inferior view of the brain. Areas in red are significant increases; areas in yellow are highly significant increases.
TABLE 1. Subject demographics
TABLE 2A. Talairach coordinates of significant regions
TABLE 2B. Talairach coordinates of significant regions

References

1.
Barker AT, Jalinous R, Freeston IL: Non-invasive magnetic stimulation of the human motor cortex. Lancet 1985; i:1106–1107
2.
Saypol JM, Roth BJ, Cohen LG, et al: A theoretical comparison of electric and magnetic stimulation of the brain. Ann Biomed Eng 1991; 19:317–328
3.
Roth BJ, Saypol JM, Hallett M, et al: A theoretical calculation of the electric field induced in the cortex during magnetic stimulation. Electroencephalogr Clin Neurophysiol 1991; 81:47–56
4.
George MS, Lisanby SH, Sackeim HA: Transcranial magnetic stimulation: applications in neuropsychiatry. Arch Gen Psychiatry 1999; 56:300–311
5.
Fox P, Ingham R, George MS, et al: Imaging human intra-cerebral connectivity by PET during TMS. NeuroReport 1997; 8:2787–2791
6.
Shastri A, George MS, Bohning DE: Performance of a system for interleaving transcranial magnetic stimulation with steady state magnetic resonance imaging. Electroencephalogr Clin Neurophysiol (in press)
7.
Pascual-Leone A, Valls-Sole J, Wasserman EM, et al: Responses to rapid-rate transcranial magnetic stimulation of the human motor cortex. Brain 1994; 117:847–858
8.
Wassermann EM, Kimbrell TA, George MS, et al: Local and distant changes in cerebral glucose metabolism during repetitive transcranial magnetic stimulation (rTMS) (abstract). Neurol 1997; 48:A107–P02.049
9.
Amassian VE, Maccabee PJ, Cracco RQ, et al: Measurement of information processing delays in human visual cortex with repetitive magnetic coil stimulation. Brain Res 1993; 605:317–321
10.
Flitman SS, Grafman J, Wassermann EM, et al: Linguistic processing during repetitive transcranial magnetic stimulation. Neurol 1998; 50:175–181
11.
Jahanshahi M, Profice P, Brown RG, et al: The effects of transcranial magnetic stimulation over the dorsolateral prefrontal cortex on suppression of habitual counting during random number generation. Brain 1998; 121:1533–1544
12.
Lisanby SH, Sackeim HA: TMS in major depression, in Transcranial Magnetic Stimulation in Neuropsychiatry, edited by George MS, Belmaker RH. Washington, DC, American Psychiatric Press, 1998, pp 189–257
13.
George MS, Avery D, Nahas Z, et al: rTMS studies of mood and emotion. Electroencephalogr Clin Neurophysiol (in press)
14.
Hoflich G, Kasper S, Hufnagel A, et al: Application of transcranial magnetic stimulation in treatment of drug-resistant major depression: a report of two cases. Human Psychopharmacology 1993; 8:361–365
15.
Kolbinger HM, Hoflich G, Hufnagel A, et al: Transcranial magnetic stimulation (TMS) in the treatment of major depression: a pilot study. Human Psychopharmacology 1995; 10:305–310
16.
Grisaru N, Yarovslavsky U, Abarbanel J, et al: Transcranial magnetic stimulation in depression and schizophrenia. Eur Neuropsychopharmacol 1994; 4:287–288
17.
George MS, Wassermann EM: Rapid-rate transcranial magnetic stimulation (rTMS) and ECT. Convulsive Therapy 1994; 10:251–253
18.
Nobler MS, Sackeim H: Mechanisms of action of electroconvulsive therapy. Psychiatric Annals 1998; 28:23–29
19.
George MS, Ketter TA, Post RM: Prefrontal cortex dysfunction in clinical depression. Depression 1994; 2:59–72
20.
Ketter TA, George MS, Kimbrell TA, et al: Functional brain imaging in mood and anxiety disorders. Current Review of Mood and Anxiety Disorders 1997; 1:96–112
21.
George MS, Wassermann EM, Williams WA, et al: Daily repetitive transcranial magnetic stimulation (rTMS) improves mood in depression. NeuroReport 1995; 6:1853–1856
22.
George MS, Wassermann EM, Williams WE, et al: Mood improvements following daily left prefrontal repetitive transcranial magnetic stimulation in patients with depression: a placebo-controlled crossover trial. Am J Psychiatr 1997; 154:1752–1756
23.
Pascual-Leone A, Rubio B, Pallardo F, et al: Beneficial effect of rapid-rate transcranial magnetic stimulation of the left dorsolateral prefrontal cortex in drug-resistant depression. Lancet 1996; 348:233–237
24.
Klein E, Kreinin I, Chistyakov A, et al: Therapeutic efficacy of right prefrontal slow repetitive transcranial magnetic stimulation in major depression: a double-blind controlled study. Arch Gen Psychiatry 1999; 56:4650–4655
25.
George MS, Wassermann EM, Williams WA, et al: Changes in mood and hormone levels after rapid-rate transcranial magnetic stimulation (rTMS) of the prefrontal cortex. J Neuropsychiatry Clin Neurosci 1996; 8:172–180
26.
Kimbrell TA, George MS, Danielson AL, et al: Changes in cerebral metabolism during transcranial magnetic stimulation (abstract). Biol Psychiatry 1997; 41:108S-#374
27.
George MS, Stallings LE, Speer AM, et al: Prefrontal repetitive transcranial magnetic stimulation (rTMS) changes relative perfusion locally and remotely. Human Psychopharmacology 1999; 14:161–170
28.
Stallings LE, Speer AM, Spicer KM, et al: Combining SPECT and repetitive transcranial magnetic stimulation (rTMS): left prefrontal stimulation decreases relative perfusion locally in a dose dependent manner (abstract). Neuroimage 1997; 5:S521
29.
Nahas Z, Speer AM, Molloy M, et al: Role of stimulation frequency in the antidepressant effect of left prefrontal rTMS (abstract). Biol Psychiatry 1999; 54:59–69
30.
Endicott J, Spitzer RL: A diagnostic interview: the Schedule for Affective Disorders and Schizophrenia. Arch Gen Psychiatry 1978; 35:837–844
31.
Hamilton M: A rating scale for depression. J Neurol Neurosurg Psychiatry 1960; 12:56–62
32.
Keller MB, Harrison W, Fawcett JA, et al: Treatment of chronic depression with sertraline or imipramine: preliminary blinded response rates and high rates of undertreatment in the community. Psychopharmacol Bull 1995; 31:205–212
33.
Ackerman DL, Greenland S, Bystritsky A, et al: Characteristics of fluoxtine versus placebo responders in a randomized trial of geriatric depression. Psychopharmacol Bull 1997; 33:707–714
34.
Friston KJ, Passingham RE, Nutt JG, et al: Localisation in PET images: direct fitting of the intercommissural (AC-PC) line. J Cereb Blood Flow Metab 1989; 9:690–695
35.
George MS, Ketter TA, Kimbrell TA, et al: Neuroimaging approaches to the study of emotion, in The Neuropsychology of Emotion, edited by Borod J. New York, Oxford University Press (in press)
36.
Baxter LR Jr, Schwartz JM, Phelps ME, et al: Reduction of prefrontal cortex glucose metabolism common to three types of depression. Arch Gen Psychiatry 1989; 46:243–250
37.
Andreason PJ, Altemus M, Zametkin AJ, et al: Regional cerebral glucose metabolism in bulimia nervosa. Am J Psychiatry 1992; 149:1506–1513
38.
Drevets WC, Videen TO, Preskorn SH, et al: A functional anatomical study of unipolar depression. J Neurosci 1992; 12:3628–3641
39.
Pardo JV, Pardo PJ, Janer KW, et al: The anterior cingulate cortex mediates processing selection in the Stroop attentional conflict paradigm. Proc Natl Acad Sci USA 1990; 87:256–259
40.
George MS, Ketter TA, Parekh PI, et al: Regional brain activity when selecting a response despite interference: an H215O PET study of the Stroop and an emotional Stroop. Hum Brain Mapp 1994; 1:194–209
41.
Carter CS, Braver TS, Barch DM, et al: Anterior cingulate cortex, error detection, and online monitoring of performance. Science 1998; 280:747–749
42.
Vogt BA, Sikes RW, Vogt LJ: Anterior cingulate cortex and the medial pain system, in Neurobiology of Cingulate Cortex and Limbic Thalamus, edited by Vogt BA, Gabriel M. Boston, Birkhauser, 1993, pp 313–345
43.
Devinsky O, Luciano D: The contributions of cingulate cortex to human behavior, in Neurobiology of Cingulate Cortex and Limbic Thalamus, edited by Vogt BA, Gabriel M. Boston, Birkhauser, 1993, pp 527–556
44.
Maclean PD: Introduction: perspectives on cingulate cortex in the limbic system, in Neurobiology of Cingulate Cortex and Limbic Thalamus: A Comprehensive Handbook, edited by Vogt BA, Gabriel M. Boston, Birkhauser, 1993, pp 1–19
45.
Ketter TA, Andreason PJ, George MS, et al: Anterior paralimbic mediation of procaine-induced emotional and psychosensory experiences. Arch Gen Psychiatry 1996; 53:59–69
46.
George MS, Ketter TA, Parekh PI, et al: Brain activity during transient sadness and happiness in healthy women. Am J Psychiatry 1995; 152:341–351
47.
George MS, Ketter TA, Parekh PI, et al: Blunted left cingulate activation in mood disorder subjects during a response interference task (the Stroop). J Neuropsychiatry Clin Neurosci 1997; 9:55–63
48.
Ebert D, Feistel H, Barocka A, et al: Increased limbic flow and total sleep deprivation in major depression with melancholia. Psychiatry Res 1994; 55:101–109
49.
Wu JC, Gillin JC, Buchsbaum MS, et al: Effect of sleep deprivation on brain metabolism of depressed patients. Am J Psychiatry 1992; 149:538–543
50.
Mayberg HS, Brannan SK, Mahurin RK, et al: Cingulate function in depression: a potential predictor of treatment response. NeuroReport 1997; 8:1057–1061
51.
Bremner JD, Innis RB, Salomon RM, et al: PET Measurement of cerebral metabolic correlates of tryptophan depletion-induced depressive relapse. Arch Gen Psychiatry 1997; 54:364–374
52.
Lisanby SH, Sackeim HA: Therapeutic brain interventions and the nature of emotion, in The Neuropsychology of Emotion, edited by Borod J. New York, Oxford University Press (in press)
53.
Morgan MA, Romanski L, LeDoux JE: Extinction of emotional learning: contribution of medial prefrontal cortex. Neurosci Lett 1993; 163:109–113
54.
Nahas Z, Speer AM, Lorberbaum JP, et al: Safety of rTMS: MRI scans before and after 2 weeks of daily left prefrontal rTMS for depression (abstract). Biol Psychiatry 1998; 43:95S-#316
55.
Nobler MS, Sackeim HA, Prohovnik I, et al: Regional cerebral blood flow in mood disorders, III: treatment and clinical response. Arch Gen Psychiatry 1994; 51:884–897
56.
Nobler MS, Teneback CC, Nahas Z, et al: Structural and functional neuroimaging of ECT and TMS. Prog Neuropsychopharmacol Biol Psychiatry (in press)
57.
George MS, Nahas Z, Bohning DE, et al: Transcranial magnetic stimulation and neuroimaging, in Transcranial Magnetic Stimulation in Neuropsychiatry, edited by George MS, Belmaker RH. Washington, DC, American Psychiatric Press (in press)
58.
Bohning DE, Shastri A, McConnell K, et al: A Combined TMS/fMRI study of intensity-dependent TMS over motor cortex. Biol Psychiatry 1999; 45:385–394
59.
Bohning DE, Shastri A, Nahas Z, et al: Echoplanar BOLD fMRI of brain activation induced by concurrent transcranial magnetic stimulation (TMS). Investigative Radiology 1998; 33:336–340
60.
Bohning DE, Pecheny AP, Epstein CM, et al: Mapping transcranial magnetic stimulation (TMS) fields in vivo with MRI. NeuroReport 1997; 8:2535–2538
61.
Ilmoniemi RJ, Virtanen J, Ruohonen J, et al: Neuronal response to magnetic stimulation reveal cortical reactivity and connectivity. NeuroReport 1997; 8:3537–3540
62.
Nahas Z, Stallings LE, Speer AM, et al: Perfusion SPECT studies of rTMS on blood flow in health and depression (abstract). Biol Psychiatry 1998; 43:19S-#63
63.
Teneback C, Nahas Z, Speer AM, et al: Baseline paralimbic activity declines with depression severity and is associated with rTMS response (abstract). Biol Psychiatry 1999; 45:S132

Information & Authors

Information

Published In

Go to The Journal of Neuropsychiatry and Clinical Neurosciences
The Journal of Neuropsychiatry and Clinical Neurosciences
Pages: 426 - 435
PubMed: 10570754

History

Published in print: November 1999
Published online: 24 January 2015

Authors

Details

Charlotte C. Teneback, B.S.
Received January 28, 1999; revised April 20, 1999; accepted May 26, 1999. From the Functional Neuroimaging Research Division and Departments of Radiology, Psychiatry, and Neurology, Medical University of South Carolina, Charleston, South Carolina; and the Ralph H. Johnson Veterans Hospital, Charleston, South Carolina. Address correspondence to Dr. George, MUSC Department of Radiology, Room D297, 171 Ashley Avenue, Charleston, SC 29425; e-mail: [email protected]
Ziad Nahas, M.D.
Received January 28, 1999; revised April 20, 1999; accepted May 26, 1999. From the Functional Neuroimaging Research Division and Departments of Radiology, Psychiatry, and Neurology, Medical University of South Carolina, Charleston, South Carolina; and the Ralph H. Johnson Veterans Hospital, Charleston, South Carolina. Address correspondence to Dr. George, MUSC Department of Radiology, Room D297, 171 Ashley Avenue, Charleston, SC 29425; e-mail: [email protected]
Andrew M. Speer, M.D.
Received January 28, 1999; revised April 20, 1999; accepted May 26, 1999. From the Functional Neuroimaging Research Division and Departments of Radiology, Psychiatry, and Neurology, Medical University of South Carolina, Charleston, South Carolina; and the Ralph H. Johnson Veterans Hospital, Charleston, South Carolina. Address correspondence to Dr. George, MUSC Department of Radiology, Room D297, 171 Ashley Avenue, Charleston, SC 29425; e-mail: [email protected]
Monica Molloy, R.N. M.S.N.
Received January 28, 1999; revised April 20, 1999; accepted May 26, 1999. From the Functional Neuroimaging Research Division and Departments of Radiology, Psychiatry, and Neurology, Medical University of South Carolina, Charleston, South Carolina; and the Ralph H. Johnson Veterans Hospital, Charleston, South Carolina. Address correspondence to Dr. George, MUSC Department of Radiology, Room D297, 171 Ashley Avenue, Charleston, SC 29425; e-mail: [email protected]
Laurie E. Stallings, Pharm.D.
Received January 28, 1999; revised April 20, 1999; accepted May 26, 1999. From the Functional Neuroimaging Research Division and Departments of Radiology, Psychiatry, and Neurology, Medical University of South Carolina, Charleston, South Carolina; and the Ralph H. Johnson Veterans Hospital, Charleston, South Carolina. Address correspondence to Dr. George, MUSC Department of Radiology, Room D297, 171 Ashley Avenue, Charleston, SC 29425; e-mail: [email protected]
Kenneth M. Spicer, M.D., Ph.D.
Received January 28, 1999; revised April 20, 1999; accepted May 26, 1999. From the Functional Neuroimaging Research Division and Departments of Radiology, Psychiatry, and Neurology, Medical University of South Carolina, Charleston, South Carolina; and the Ralph H. Johnson Veterans Hospital, Charleston, South Carolina. Address correspondence to Dr. George, MUSC Department of Radiology, Room D297, 171 Ashley Avenue, Charleston, SC 29425; e-mail: [email protected]
S. Craig Risch, M.D.
Received January 28, 1999; revised April 20, 1999; accepted May 26, 1999. From the Functional Neuroimaging Research Division and Departments of Radiology, Psychiatry, and Neurology, Medical University of South Carolina, Charleston, South Carolina; and the Ralph H. Johnson Veterans Hospital, Charleston, South Carolina. Address correspondence to Dr. George, MUSC Department of Radiology, Room D297, 171 Ashley Avenue, Charleston, SC 29425; e-mail: [email protected]
Mark S. George, M.D.
Received January 28, 1999; revised April 20, 1999; accepted May 26, 1999. From the Functional Neuroimaging Research Division and Departments of Radiology, Psychiatry, and Neurology, Medical University of South Carolina, Charleston, South Carolina; and the Ralph H. Johnson Veterans Hospital, Charleston, South Carolina. Address correspondence to Dr. George, MUSC Department of Radiology, Room D297, 171 Ashley Avenue, Charleston, SC 29425; e-mail: [email protected]

Metrics & Citations

Metrics

Citations

Export Citations

If you have the appropriate software installed, you can download article citation data to the citation manager of your choice. Simply select your manager software from the list below and click Download.

For more information or tips please see 'Downloading to a citation manager' in the Help menu.

Format
Citation style
Style
Copy to clipboard

View Options

View options

PDF/EPUB

View PDF/EPUB

Get Access

Login options

Already a subscriber? Access your subscription through your login credentials or your institution for full access to this article.

Personal login Institutional Login Open Athens login
Purchase Options

Purchase this article to access the full text.

PPV Articles - Journal of Neuropsychiatry and Clinical Neurosciences

PPV Articles - Journal of Neuropsychiatry and Clinical Neurosciences

Not a subscriber?

Subscribe Now / Learn More

PsychiatryOnline subscription options offer access to the DSM-5-TR® library, books, journals, CME, and patient resources. This all-in-one virtual library provides psychiatrists and mental health professionals with key resources for diagnosis, treatment, research, and professional development.

Need more help? PsychiatryOnline Customer Service may be reached by emailing [email protected] or by calling 800-368-5777 (in the U.S.) or 703-907-7322 (outside the U.S.).

Media

Figures

Other

Tables

Share

Share

Share article link

Share