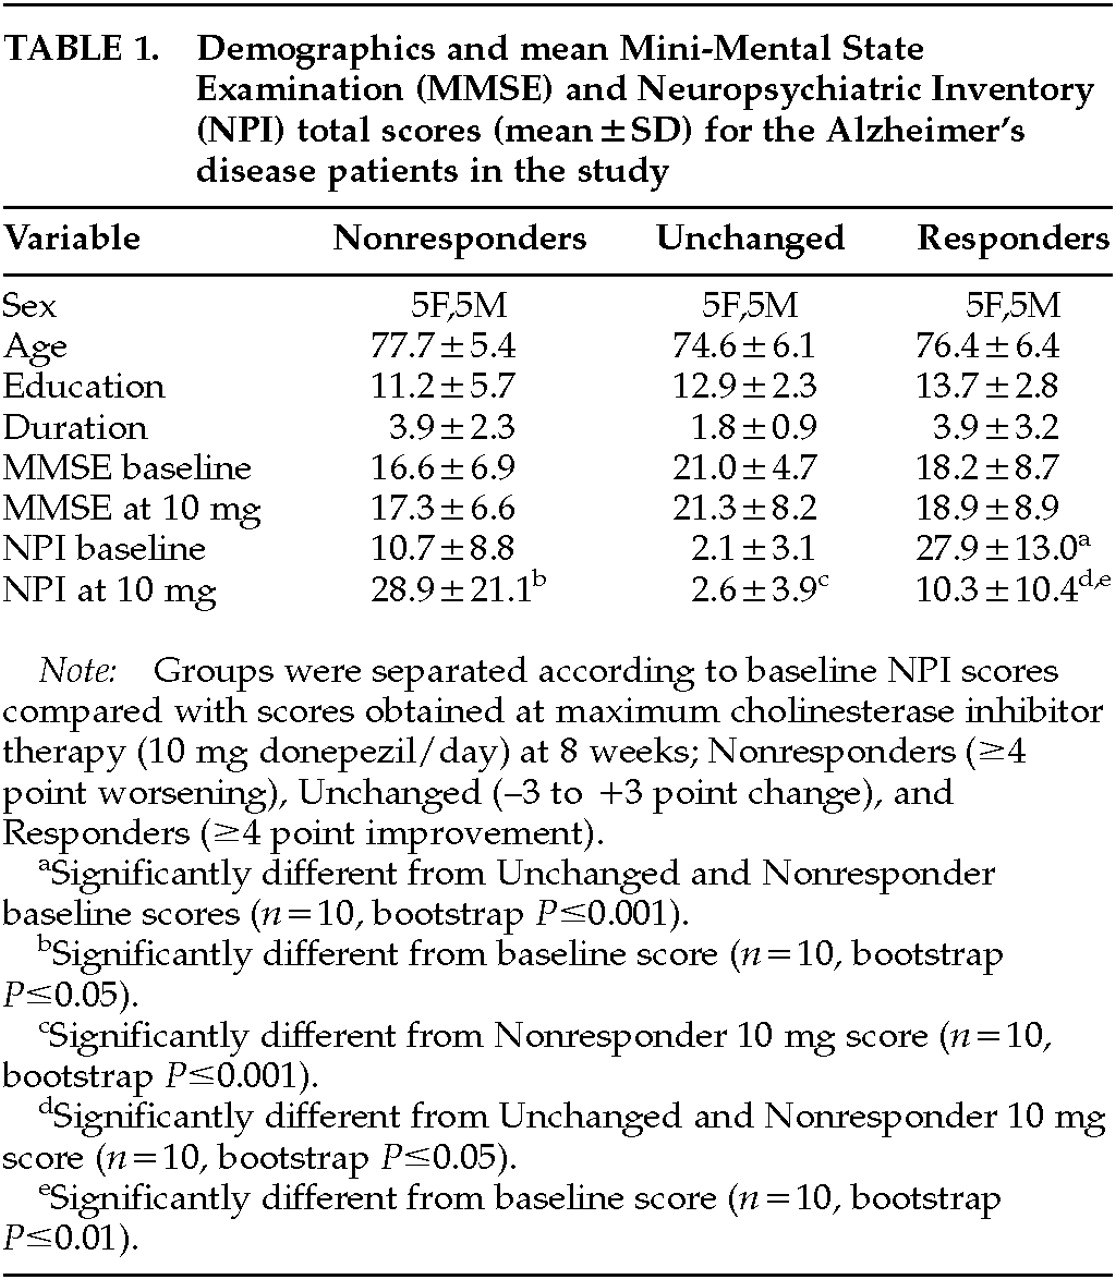
Table 1 shows the demographic makeup of the groups based on their treatment response to donepezil after 8 weeks of therapy. Total NPI scores were, of course, lower after treatment in the Responders—and higher in the Nonresponders—compared with baseline, since this was the criterion whereby the groups were separated. No significant change in MMSE with treatment occurred in any group. Concomitant psychotropic medications may influence the behavioral response to a cholinesterase inhibitor; thus, we documented the use of antipsychotics, antidepressants, anxiolytics, anticholinergics, estrogens, vitamin E, and anti-inflammatory agents. No significant differences between the Responders and Nonresponders were found for these agents during the treatment period, except for anxiolytic use only at week 4 (5 mg donepezil/day), with 3 Nonresponders and only 1 Responder (
P=0.03) being treated. The Unchanged group significantly differed from the Responders in both pre- and post-treatment NPI scores, and from the Nonresponders in post-treatment NPI score (see
Table 1). The Unchanged group served as a demographically similar group to further test the perfusion findings of the Responders versus Nonresponders comparison.
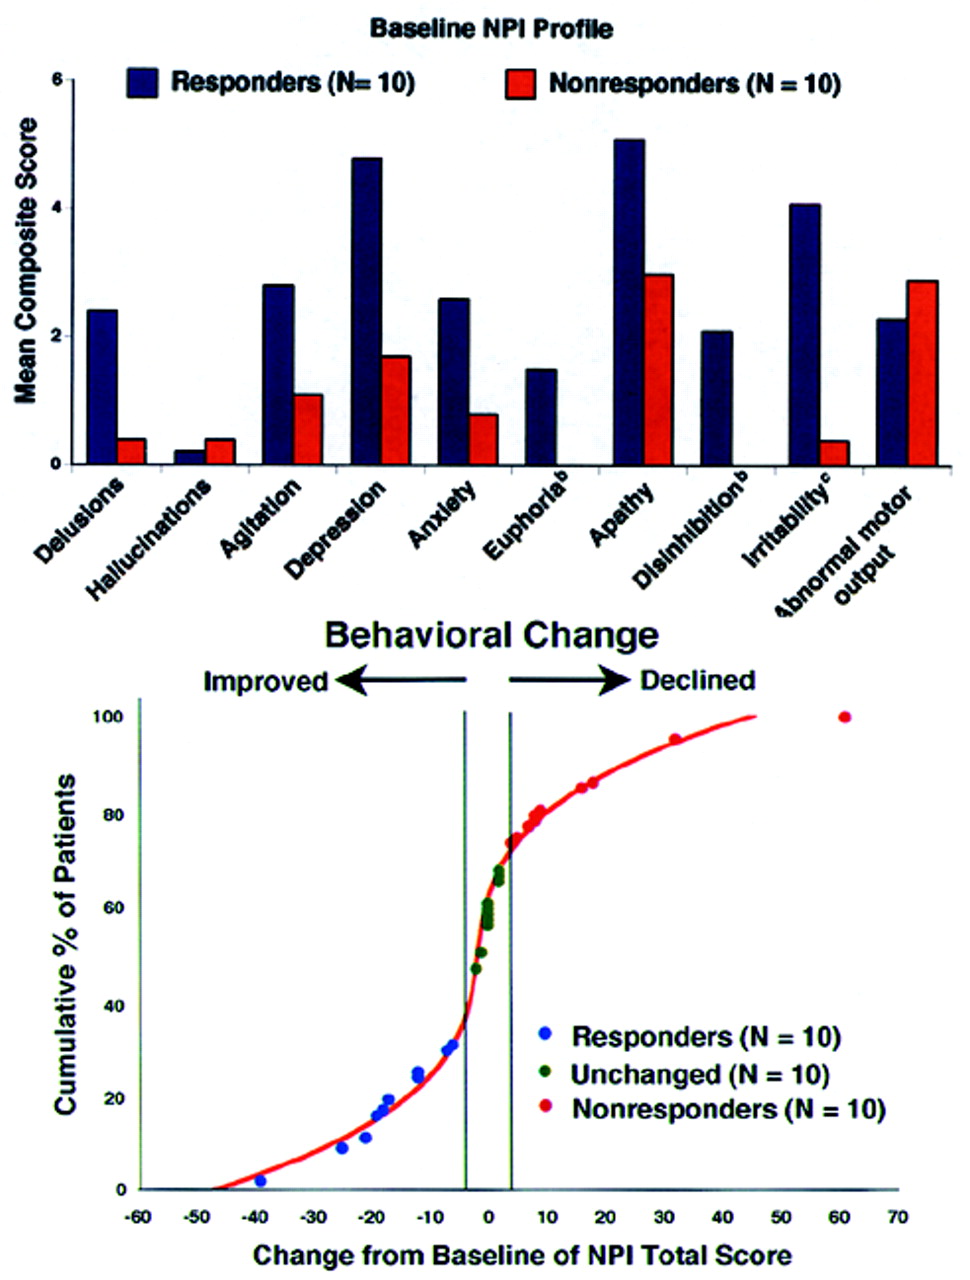
Figure 1 (top) shows the profile of scoreable baseline NPI domains for both the Responder and Nonresponder groups.
Figure 1 (bottom) shows where the AD patients used in the current study fell on the treatment curve derived from a larger study of the spectrum of behavioral response to donepezil.
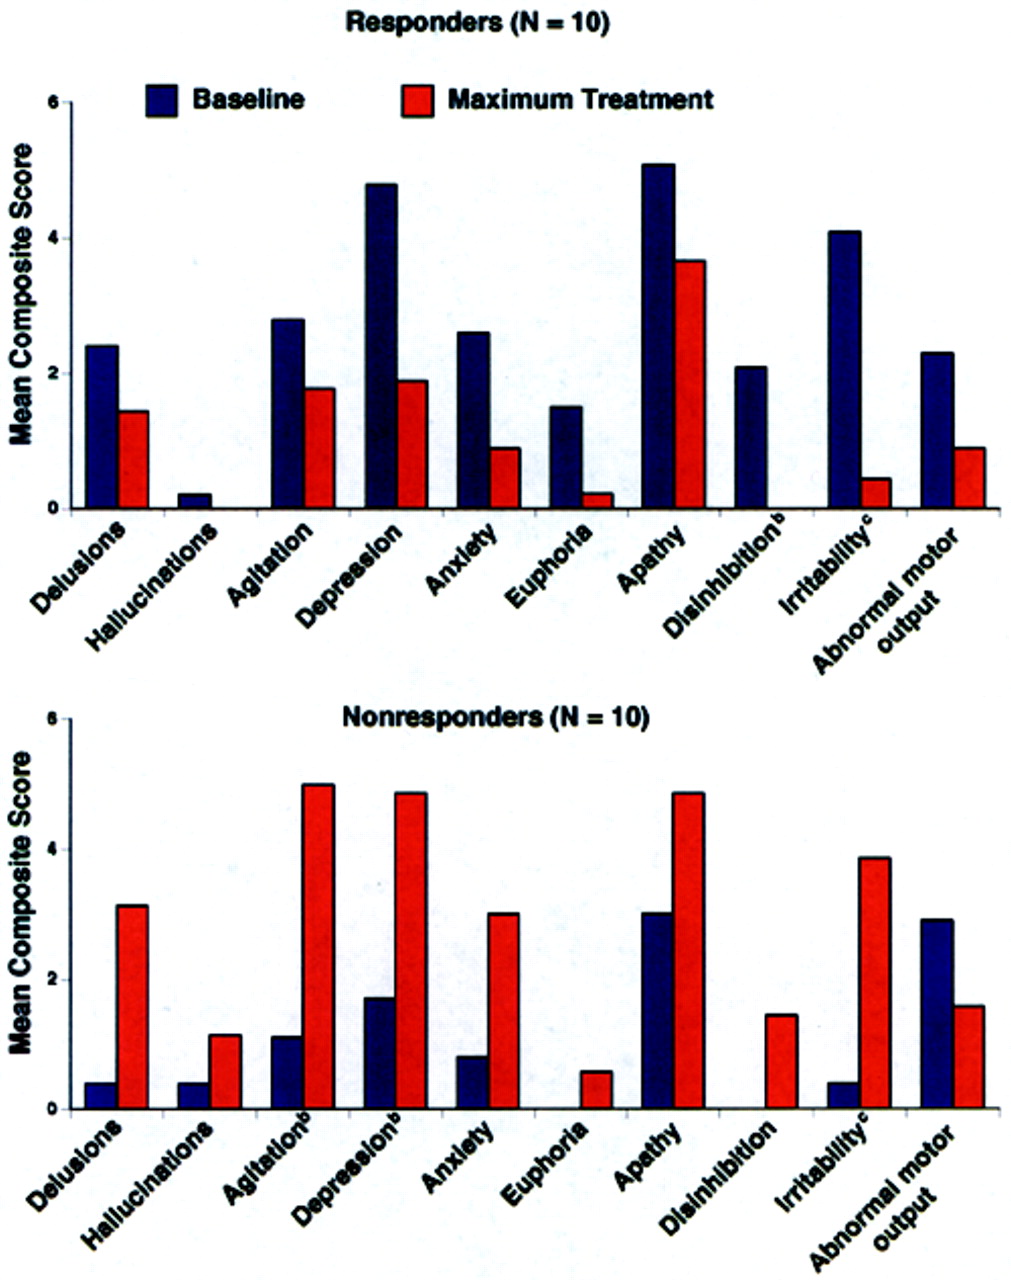
4 Because we were blind to a group's specific behavioral profile at baseline, a statistical analysis was conducted to determine which behaviors significantly improved or declined following cholinesterase inhibitor therapy (
Figure 2). Alzheimer's disease patients with significantly greater baseline disinhibition (
P<0.05) and irritability (
P<0.01) were more likely to improve with donepezil treatment; euphoria was also significantly higher (
P=0.05) in Responders at baseline than Nonresponders. When only those subjects with behaviors present at baseline were analyzed (two Nonresponders had no pretreatment behaviors), significantly greater irritability (
P<0.01) and disinhibition (
P<0.05) continued to be the behaviors that distinguished Responders from Nonresponders.
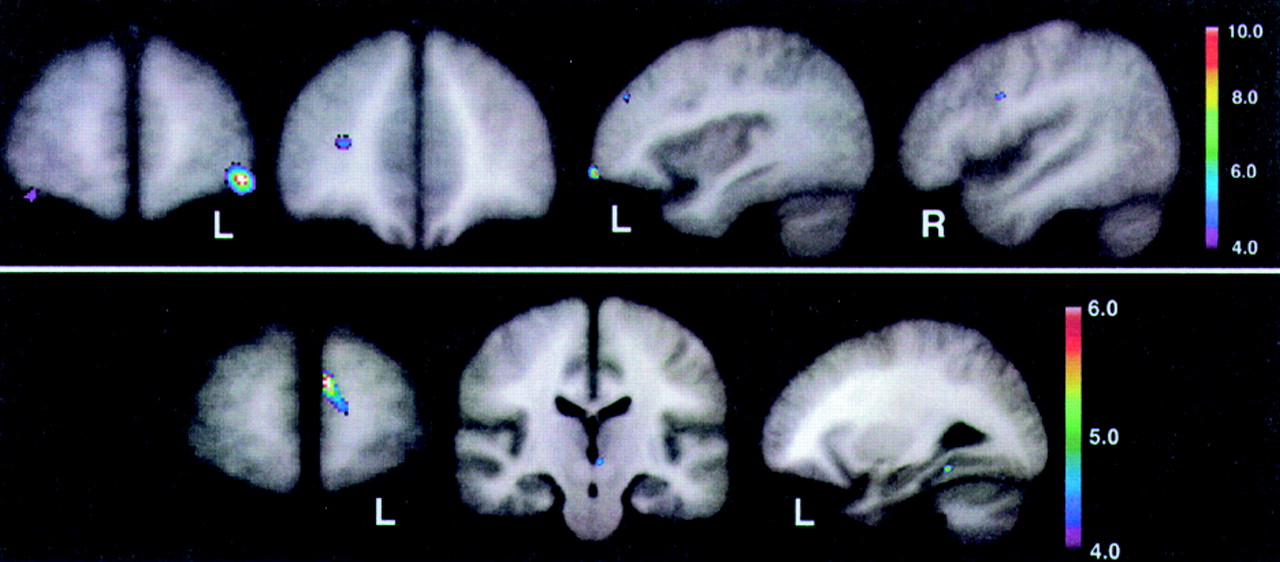
Figure 3 (top) shows the peak significance for regions with significantly lower baseline perfusion in the behavioral Responders compared with the Nonresponders. These regions were the lateral orbitofrontal and dorsolateral frontal cortex bilaterally.
Figure 3 (bottom) shows the regions with significantly higher baseline perfusion in the behavioral Responders compared with the Nonresponders. These regions were the left medial frontal cortex, left subthalamic nucleus, and left inferior temporal cortex. Talairach atlas
26 locations of brain regions' peak significance for the two statistical maps shown are listed in
Table 2.
On the basis of the orbitofrontal findings of the experiment shown in
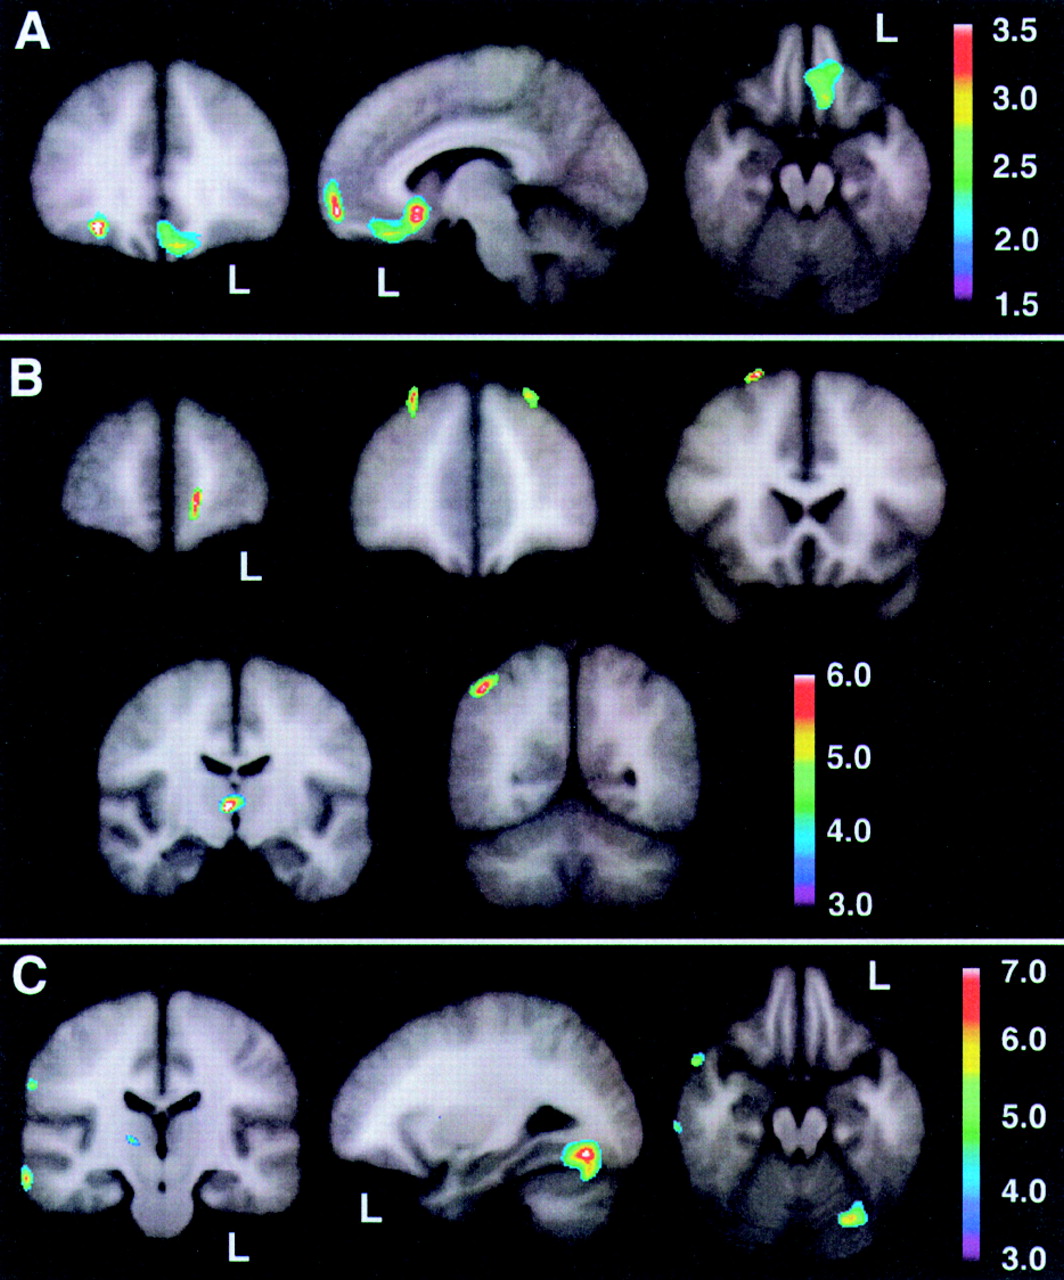
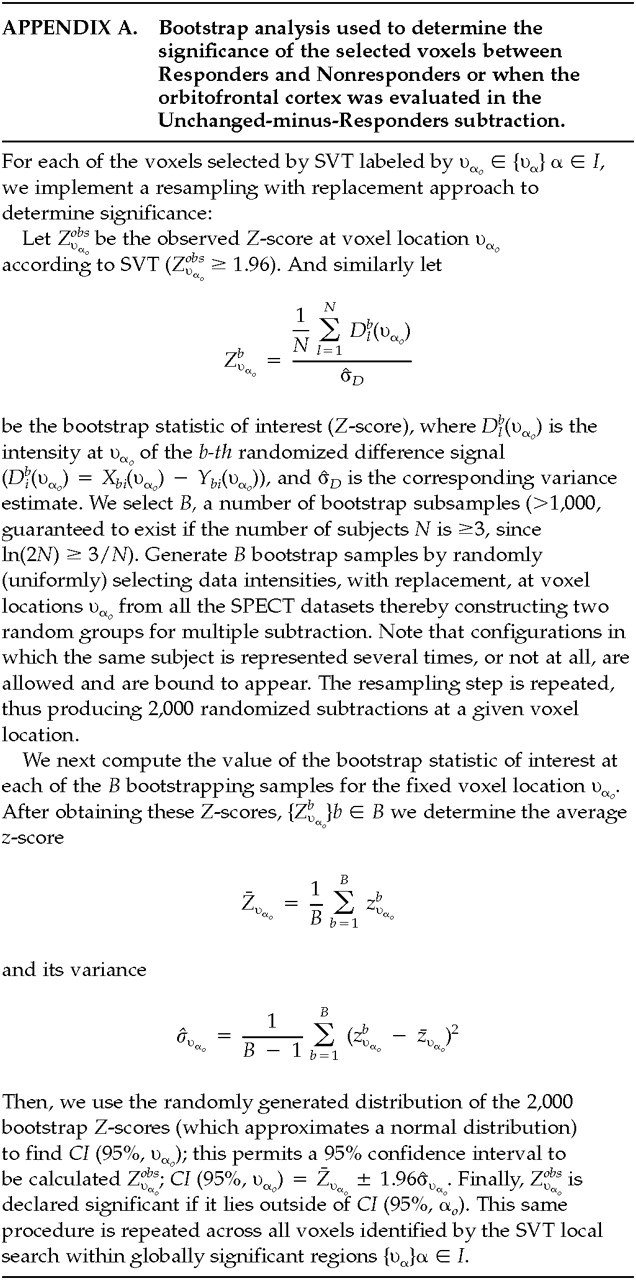
Figure 3, we tested the hypothesis that the orbitofrontal cortex would also be significantly hypoperfused in Responders compared with the Unchanged group.
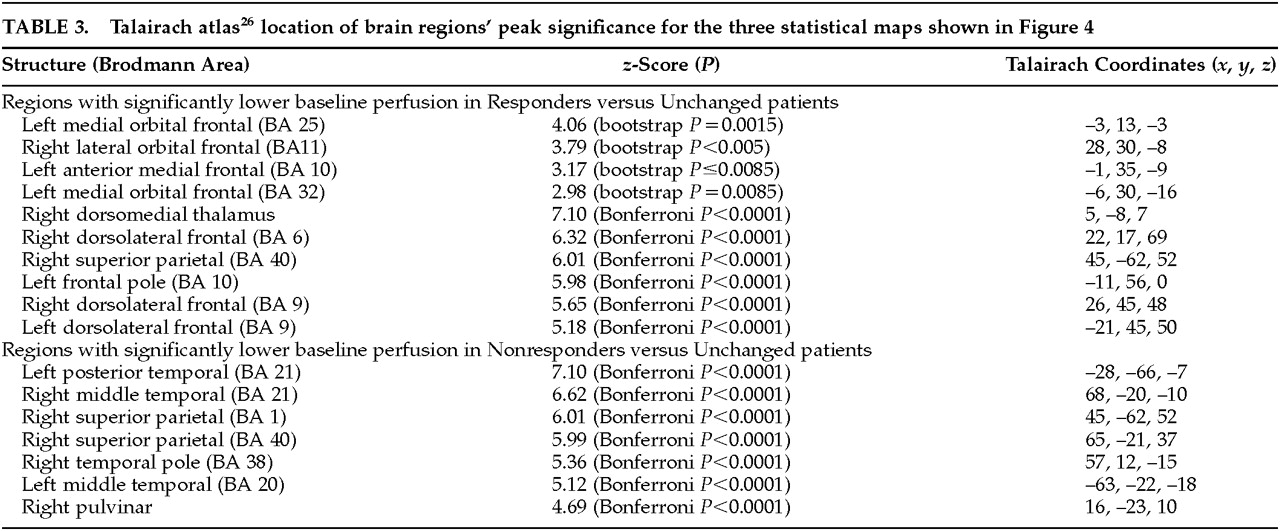
Figure 4 shows the peak significance for regions with significantly lower baseline perfusion in the behavioral Responders (4a: hypothesis-driven bootstrap assessment; 4b: non–hypothesis-driven Bonferroni assessment) and Nonresponders (4c: non–hypothesis-driven Bonferroni assessment) compared with the Unchanged group. Orbitofrontal cortices, medially on the left and laterally on the right, were significantly hypoperfused in the Responders compared with the Unchanged group. Additional regions of hypoperfusion included the right dorsomedial thalamus, bilateral dorsolateral frontal, left frontal polar, and right superior parietal cortices.
Figure 4c shows significant bilateral temporal, right parietal, and right pulvinar hypoperfusion in Nonresponders compared with the Unchanged group. No hyperperfused regions were found for Responders or Nonresponders compared with the Unchanged group. Talairach atlas
26 locations of brain regions' peak significance for the three statistical maps shown are listed in
Table 3.
