Concerns about generalizability also apply to evidence from these three data sources about factors that predict employment outcomes for persons with schizophrenia. Evidence about such predictors is important for understanding the nature and magnitude of barriers to employment as well as factors that promote employment and work outcomes.
In this article, we present recent data from a large prospective national study of persons with a medical-record diagnosis of a schizophrenia-related disorder. These persons were selected from the patient populations of organized systems of care. Because the study included more than 2,300 persons from six regions of the United States who were followed for three years, it is an unusually rich source of data about persons currently under treatment in organized care systems.
We present descriptive data on employment rates, days and hours of work, and earnings. We also discuss the influence of several types of predictors of employment outcomes that have been investigated in recent reports, including clinical status measures and conditions in local labor markets. Results of the analysis are compared with results from previous studies that used the three types of data sources noted above.
Methods
Study setting and data
We analyzed data from the U.S. Schizophrenia Care and Assessment Program (US-SCAP), a multisite three-year longitudinal study of 2,326 adults diagnosed as having a schizophrenia-related disorder. Data collection occurred between July 1997 and September 2003. Additional information on the US-SCAP is provided elsewhere (
5,
6,
7,
8,
9,
10 ).
Participants were recruited from behavioral health care systems in six geographic areas. These systems included community mental health centers, Veterans Affairs mental health providers, university outpatient clinics, and public psychiatric hospitals. The six geographic areas were Baltimore, selected counties in Colorado (including the city of Denver), selected counties in central Florida (including the city of Orlando), New Haven, selected counties in North Carolina (including the city of Durham), and San Diego. These systems were selected after site visits during the initial phase of the US-SCAP study to identify sites with the requisite information system, infrastructure, and patient recruitment capabilities.
Potential study participants were randomly selected from the patient rosters in the information systems maintained by the behavioral health care systems at the sites. In the random selection process, the sites sought to recruit roughly equal numbers of patients who had received inpatient care in the 12 months before enrollment and patients who had received only outpatient treatment during this period. In practice, however, the former group of patients accounted for slightly more than a third of the total patients recruited.
Initial study contact was by telephone, and considerable efforts were made to contact and enroll all randomly selected patients. Enrollment and informed consent procedures were usually carried out at the providers' sites. When possible, these procedures were scheduled to coincide with the participant's visit to the provider for care. Patients who were not scheduled for visits were contacted by telephone or mail and were enrolled and gave consent in person at other times or locations.
To participate in the study, patients were required to be at least 18 years old, to have a medical-record DSM-IV diagnosis of schizophrenia or of schizophreniform or schizoaffective disorder, to have a reliable mail or telephone point of contact, and to be able to communicate with project staff and consent to study procedures. Patients who participated in a clinical drug trial in the month before enrollment were excluded.
Data were obtained in baseline and follow-up interviews every six months for up to three years and from reviews of participants' medical records. Baseline and annual follow-up interviews included a clinical assessment by a trained clinical assessor. Information about employment, days and hours of work, and earnings was obtained at baseline and each follow-up interview. Our analysis was restricted to data from the baseline interviews and the annual follow-up interviews that included the clinical assessment. Thus the maximum number of observations for an individual in our analysis was four (baseline and 12-, 24-, and 36-month follow-ups), and the minimum number was one.
Because data collection occurred over a six-year period and in six geographic regions, it provided an opportunity to examine the relationship between labor market conditions and community-based employment and to test the general hypothesis that the employment situation of persons with disabilities is particularly sensitive to changes in market conditions (
11 ). To this end, we merged into our data set labor market statistics for each of the 14 counties included in the six regions of the US-SCAP.
Measures of work and earnings
Six different work and earnings measures were used as outcome variables. An indicator of community employment (coded 0 or 1) was coded 1 if an individual reported having done any work at a job for pay that was not in a sheltered workshop in the four weeks preceding the interview. For those who reported community employment, days worked in the past four weeks and hours worked in the past four weeks (equal to the product of reported work days and reported hours on the days when working) were used as work intensity measures. In addition, an indicator coded 1 for 40 or more hours of community employment in the past four weeks and coded 0 otherwise was used as an indicator of substantial work attachment (
11,
12 ). (In this report, the term "monthly earnings" is used, even though the measure was for four weeks.)
The final two measures incorporated information on self-reported earnings per hour. By comparing this figure with the prevailing minimum wage, we created an indicator (0 or 1) coded 1 for persons working in community employment and earning at or above the minimum wage. This is one indicator of competitive employment used in the supported-employment literature (
11 ). Our final measure was earnings from community employment in the past four weeks, computed as the product of earnings per hour, hours per day, and days of work.
Predictor variables
Our choice of predictors was dictated by several factors. First, although recent studies have tested a variety of sociodemographic predictors of employment for persons with severe mental illness (
13 ) and for persons with schizophrenia (
6,
14 ), the most consistent evidence of predictive power has been found for age and education. Also, a previous analysis of preliminary data from the US-SCAP study indicated a strong relationship between gender and employment, with males having a higher probability of employment (
6 ). Thus in the study reported here we focused on these three sociodemographic predictors, with some exceptions as noted below.
Second, annual clinical assessments from the US-SCAP provided relevant predictors related to symptoms, side effects, comorbid conditions, and treatment course. Four assessment instruments were used: the Positive and Negative Syndrome Scale (PANSS) (
15 ), the Montgomery-Åsberg Depression Scale (MADRS) (
16 ), the Abnormal Involuntary Movement Scale (AIMS) (
17 ), and the Simpson-Angus Scale for extrapyramidal symptoms (
18 ). These instruments allowed construction of five clinical status variables that were modified versions of the original scales. For each scale, to correct for missing items we combined all reported items for that scale into an average per item score. Missing items were ignored when less than half of all relevant items were missing. When half or more of the items for any scale were missing, the data corresponding to that assessment period and respondent were dropped from the analysis. We also included a binary variable (coded 0 or 1) for inpatient treatment in the previous 12 months as an indicator of course of clinical treatment. The presumption is that hospitalized respondents were experiencing an unstable phase in their illness course that was not managed effectively by treatment.
Third, the influence of conditions in the local labor market as predictors of employment is of particular interest. Many observers, including the President's New Freedom Commission (
1 ), have emphasized the importance of labor market conditions, whereas researchers have noted "a dearth of … evidence [on] the specific effects of the local economy on … labor force participation [of persons with severe mental illness]" (
11 ).
As in other studies (
11,
14 ), we used the local area unemployment rate as our summary labor market measure. This was defined at the county level and for the month in which each interview was conducted. Data were obtained from the U.S. Bureau of Labor Statistics (
19 ) for each of the 14 counties represented in our data.
Statistical methods
We used regression methods to examine bivariate relationships between each outcome variable and predictor. For dichotomous outcome variables probit regression was employed, and for continuous outcome variables we used tobit regression. Regression methods accounted for clustering of observations on the same respondent and for clustering at the county level. We then examined multiple regression relationships between all predictors and each outcome variable using probit or tobit methods.
In most analyses, we controlled for county-specific intercepts; this accounts for both county-level clustering and possible bias resulting from the influence of county characteristics not explicitly included in our analyses. We followed this procedure because the study counties are diverse, ranging from large central cities to rural areas. Although it is reasonable to suppose that these counties differ widely in terms of available supportive services and other factors that influence employment, detailed county-level information on such factors was not available to us. Correlation of these factors with predictors explicitly included in our analyses would result in omitted-variable bias. The usual variance components procedures (that is, hierarchical modeling) account for county-level clustering but are more susceptible than the approach used here to omitted-variable bias.
The inclusion of county-specific intercepts also affects our interpretation of results for the county unemployment rate. Because these intercepts controlled for all cross-sectional intercounty variation in unemployment rates, observed results for this measure reflect only the influence of intracounty variation in unemployment over time. The distinction between intercounty variation and intracounty variation over time approximates the distinction drawn in labor economics between structural and cyclical unemployment (
20 ). The former is viewed as the result of long-term factors that persist throughout the ups and downs of the business cycle, and the latter refers to the consequences of cyclical upturns or downturns in the economy.
Tobit regression was used for continuous outcome variables because the empirical distributions of these variables had large concentrations at zero and no negative values. Because standard linear regressions of predictor variables on these dependent variables produce biased and inconsistent results, censored regression techniques such as tobit regression are commonly applied (
21 ).
All regression analyses were conducted with Stata (
22 ) by using panel data commands and clustering on individual persons. Reported regression results include regression coefficients and two-tailed p values. For the probit regressions, we also computed odds ratios implied by the regression coefficients evaluated at the mean value of the dependent variable, as well as the analogous odds ratios corresponding to the upper and lower bounds of the 95% confidence intervals for each regression coefficient.
Results
Measures of work and earnings
A total of 2,326 US-SCAP study participants had at least one of the four annual assessments required for study eligibility. Although most (2,068 participants, or 88.9%) had all four assessments, 258 had three assessments. Of the 9,046 assessments among the 2,326 participants, 78.5% (7,103 assessments) were not missing data on employment status; all of the 2,326 participants had employment data available for at least one assessment. Also, 69.1% (N=1,607) of these participants did not report community-based employment in at least one assessment. Conversely, 7.0% of the participants (N=162) reported community-based employment in all assessments in which they reported employment data. (This included 57 individuals with reported employment data in only one assessment.)
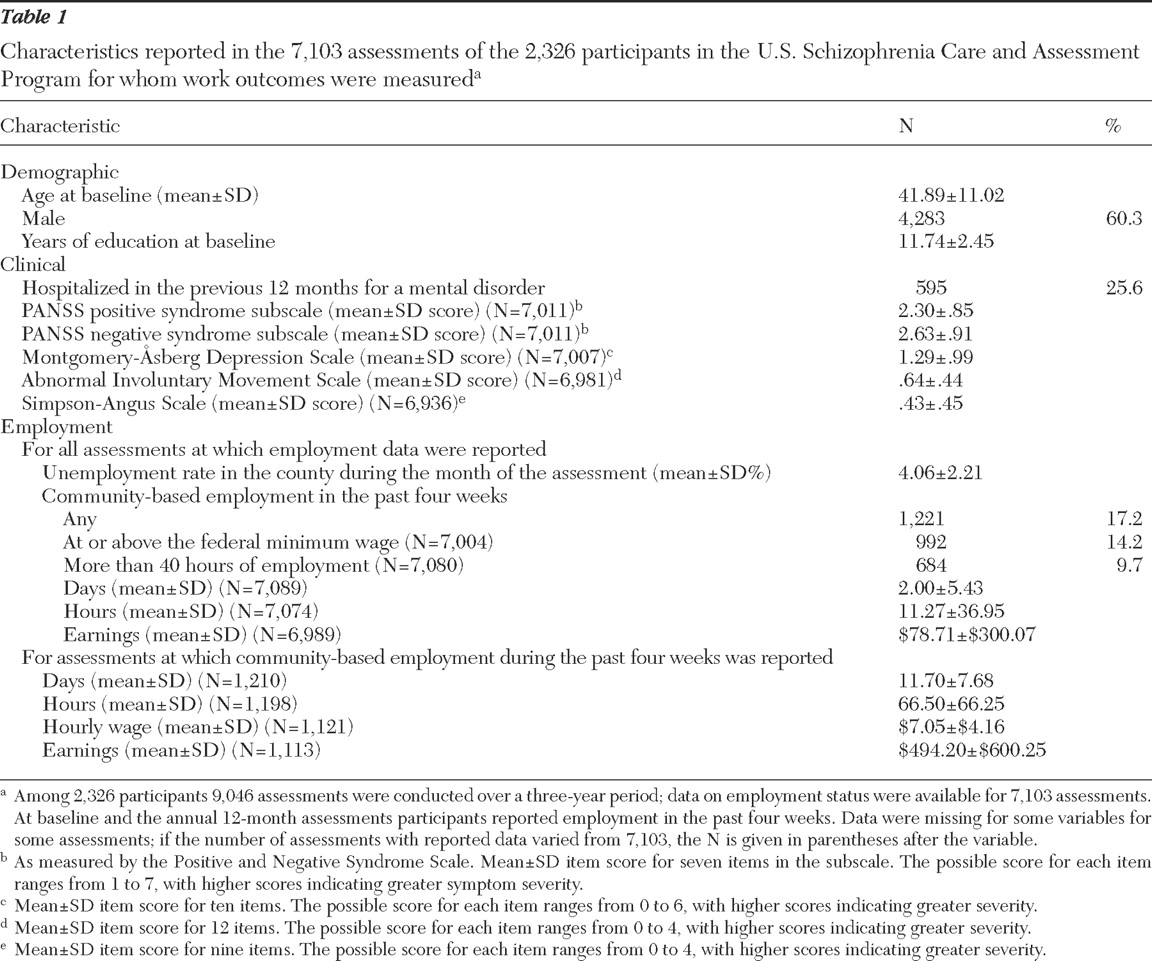
Table 1 presents descriptive statistics for assessments in which employment data were reported. Community-based employment was reported in 17.2% (N=1,221) of the 7,103 assessments; an hourly wage was reported for 1,121 of these assessments. Although this wage was at or above the federal minimum for 88.5% (992 of 1,121 participants), the mean±SD wage was still very low ($7.05).
For the 1,210 assessments in which days worked in community-based employment in the past four weeks were reported, the mean number of days worked was 11.7. For the 1,198 assessments in which hours per day were reported, the mean of hours was 5.25±7.12. In 57.1% of the assessments (N=684) participants met or exceeded the criterion of substantial work attachment (40 or more hours per month). The median computed monthly earnings were $300, with a mean of $494.20.
Predictor variables
As shown in
Table 1, the mean age of participants at baseline was slightly less than 42 years. A majority of participants (60%) were male, and the mean number of years of education level was 11.7. Average item scores on the symptom scales could be computed for nearly all the assessments in our analysis. Hospitalization rates over a 12-month recall period averaged just over 25%.
The mean county rate of unemployment (averaged over all assessments) was 4.06%, but considerable changes in this rate occurred over the six-year time span of data collection on the study (1997–2003). The trend for the mean rate (averaged across assessments by year) was relatively flat from 1997 through 2000; in later years this mean rate moved upward, reflecting the general loosening of the national labor market, from approximately 3.7% to more than 5.5% by 2002 and 2003. Differences across the 14 counties were large; means (averaged across assessments) ranged from less than 1.34% to 8.57%. Some variation in the year-to-year means was due to intercounty differences, because the time pattern of recruitment varied among study sites.
Bivariate regression results
Bivariate probit regression results are reported in
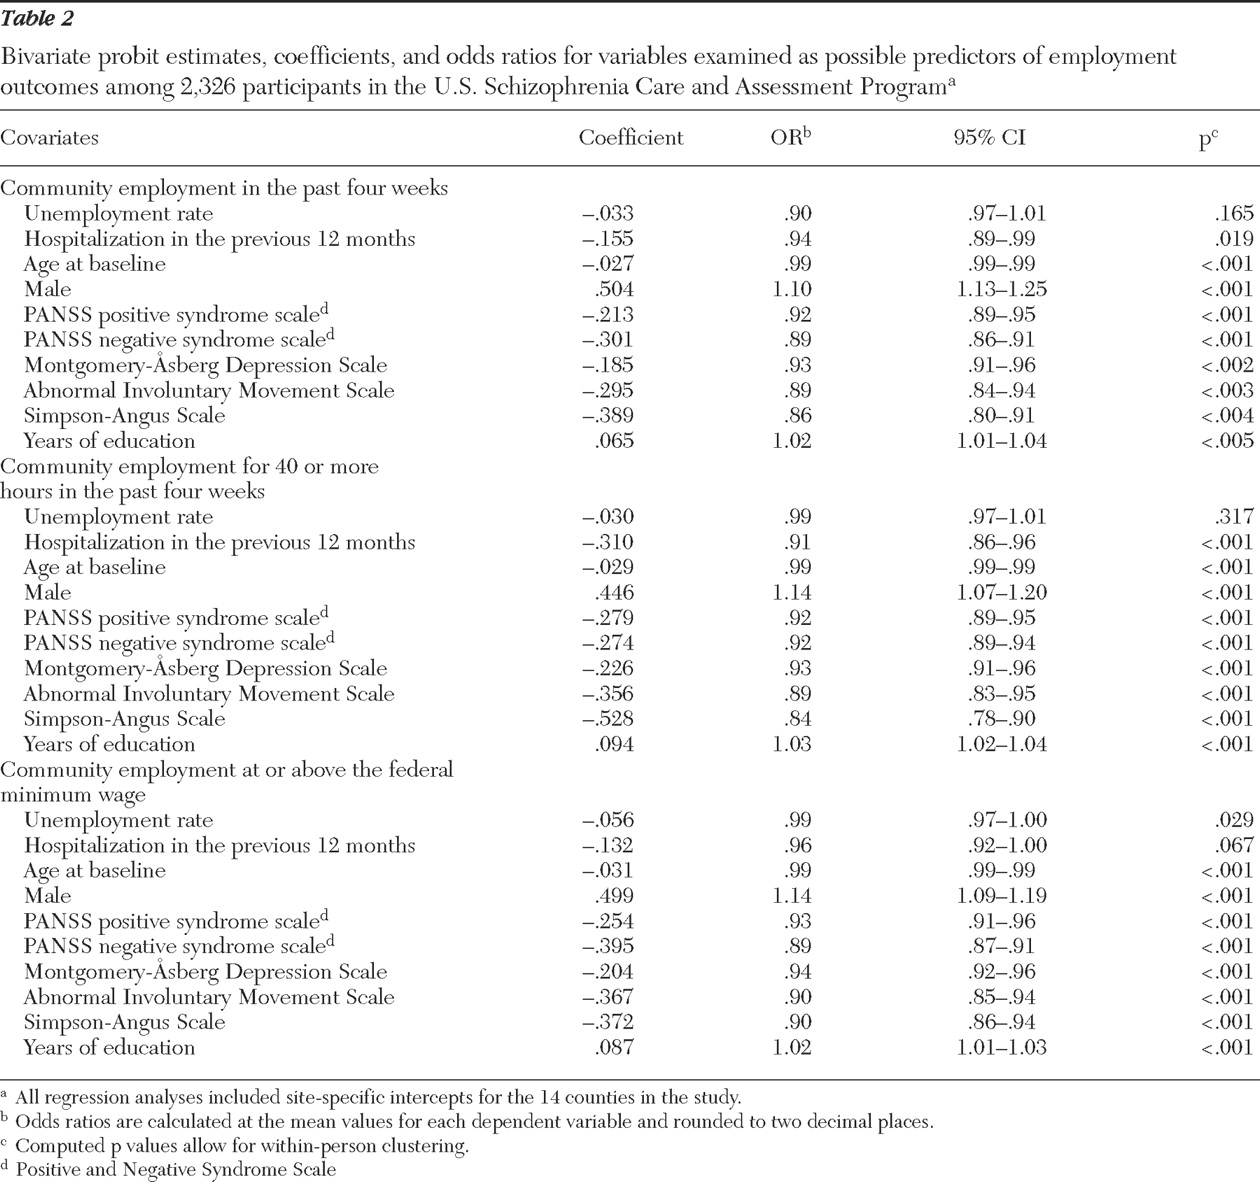
Table 2 . Education, male gender, and baseline age were consistently significant predictors of outcomes; the direction of the relationship was positive for education and gender and negative for age. Among the clinical variables, each symptom variable had a significant negative relationship to each of the outcomes. The hospitalization indicator also had a significant negative relationship to each outcome, except in the probit regression on employment at or above the minimum wage, in which hospitalization showed only a trend toward significance. In contrast, the only significant result for the local unemployment rate was its negative relationship to the probability of working at or above the minimum wage.
Bivariate tobit results are reported in
Table 3 . These results generally parallel the results in
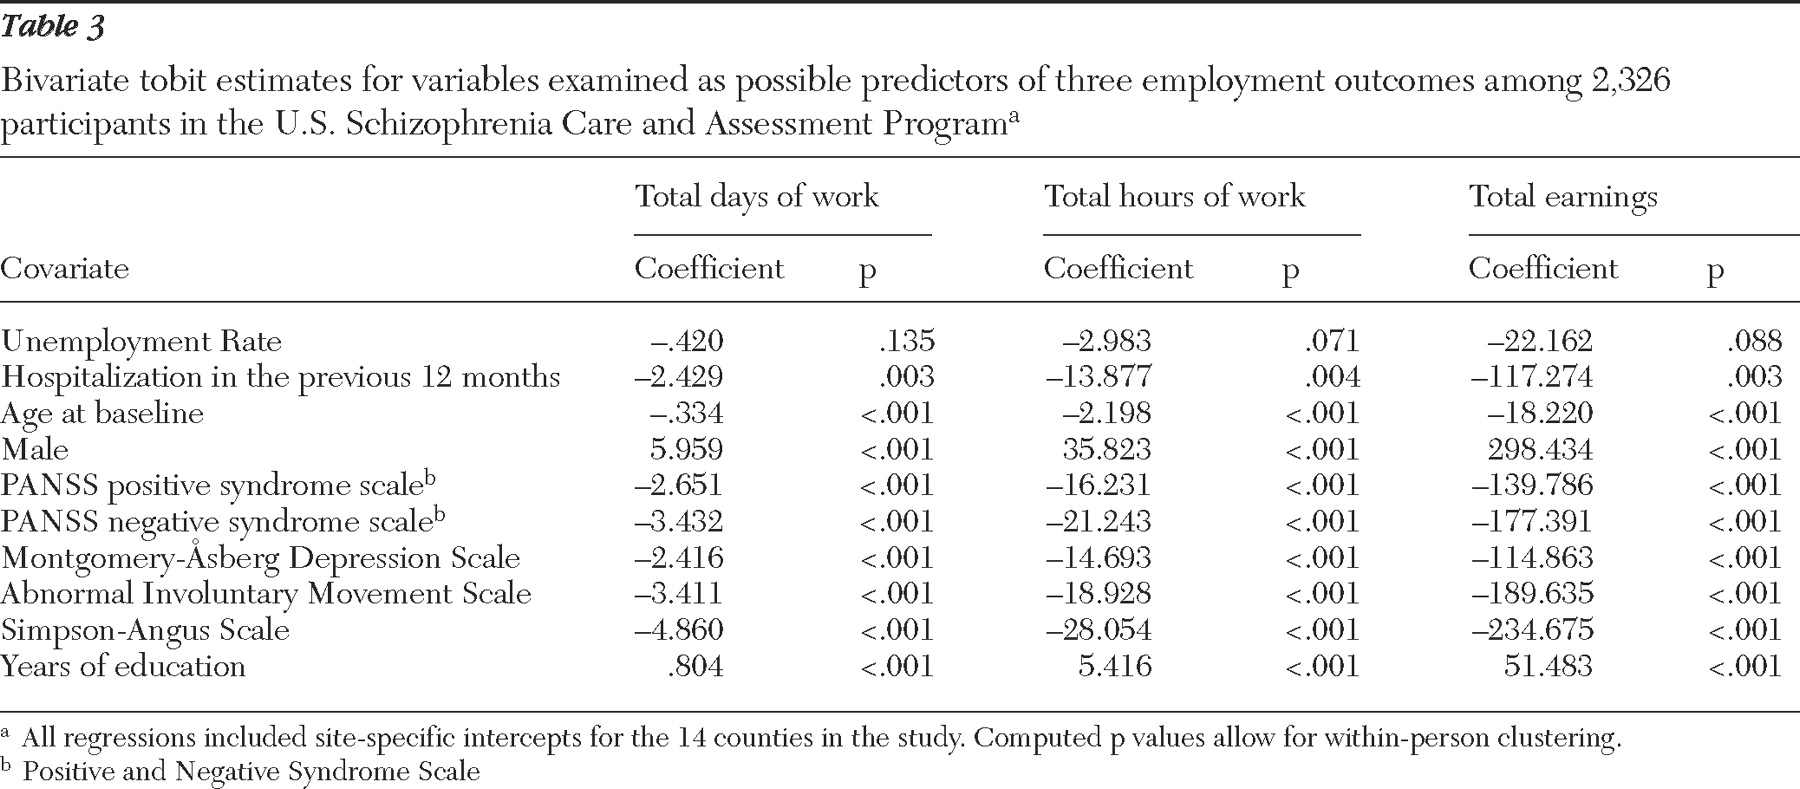
Table 2, which is to be expected because the dependent variables in the two tables are closely related. (Workdays, hours, and earnings can exceed zero only for persons who are employed.) One interesting difference is the trend toward significance of the relationship between unemployment and hours of work and between unemployment and earnings. Overall, however, the evidence of a relationship between cyclical variations in local labor markets and employment, work, or earnings is weak.
Also note that the magnitude of the tobit coefficient, when multiplied by the average probability of employment of .172, gives the change in the expected value of the dependent variable corresponding to a one-unit change in the dependent variable. For example, a one-year increase in educational attainment is associated with an increase of $8.86 (.172× 51.483) in expected monthly earnings from employment.
Multiple regression results
Multiple probit regression results are shown in
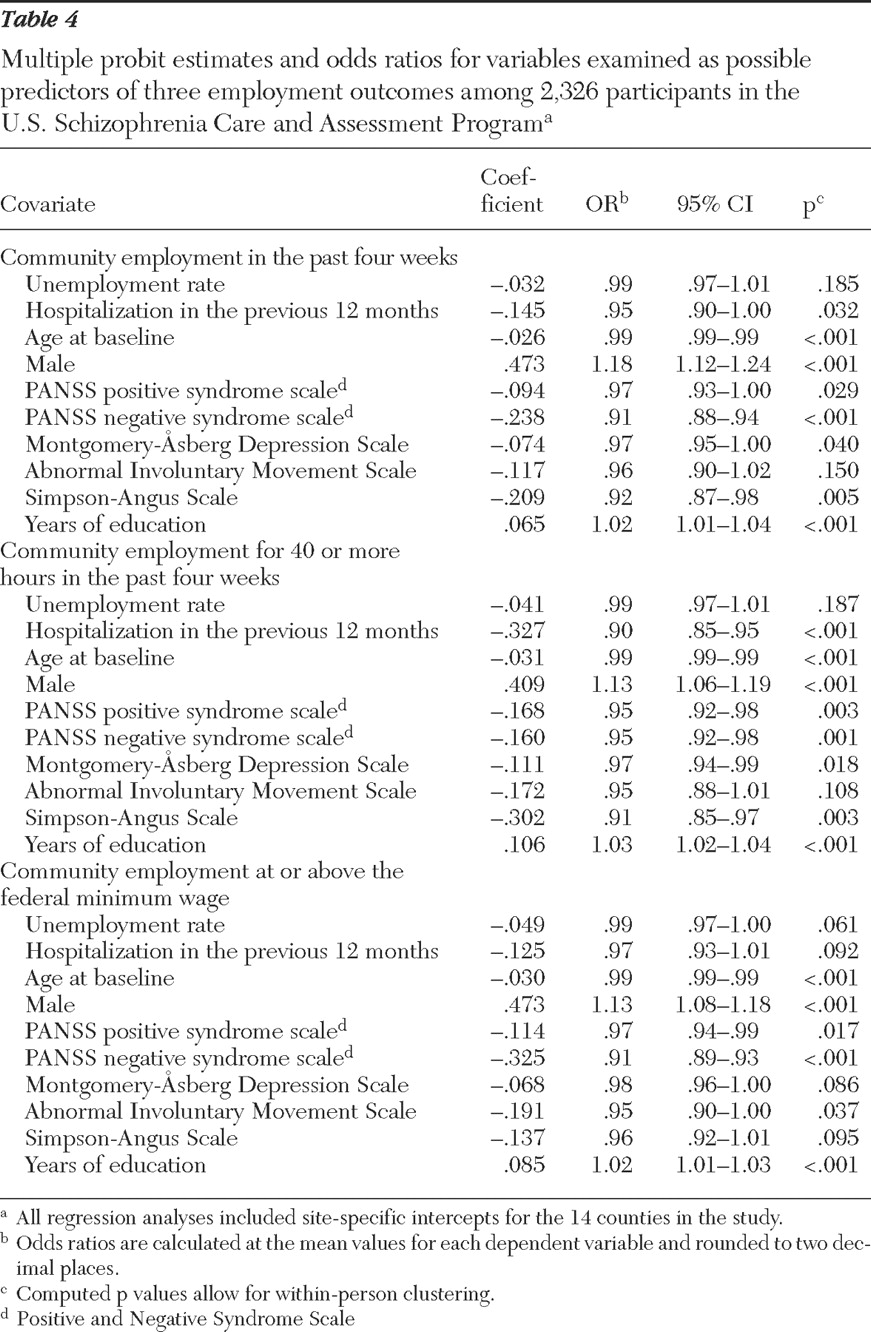
Table 4 . More years of education and male gender were significantly related to better employment outcomes, whereas older age and more severe symptoms (especially positive and negative PANSS scores) were consistently significant predictors of poorer outcomes. Results for three other clinical indicators—hospitalization, the MADRS score, and the Simpson-Angus score—also showed significant relationships between poorer clinical status and poorer employment outcomes except in the regression on employment at or above the minimum wage. Conversely, the AIMS score is only significant in the regression on employment at or above the minimum wage. The results for the unemployment rate are in the expected direction but only approached significance (p<.10) for employment at or above the minimum wage.
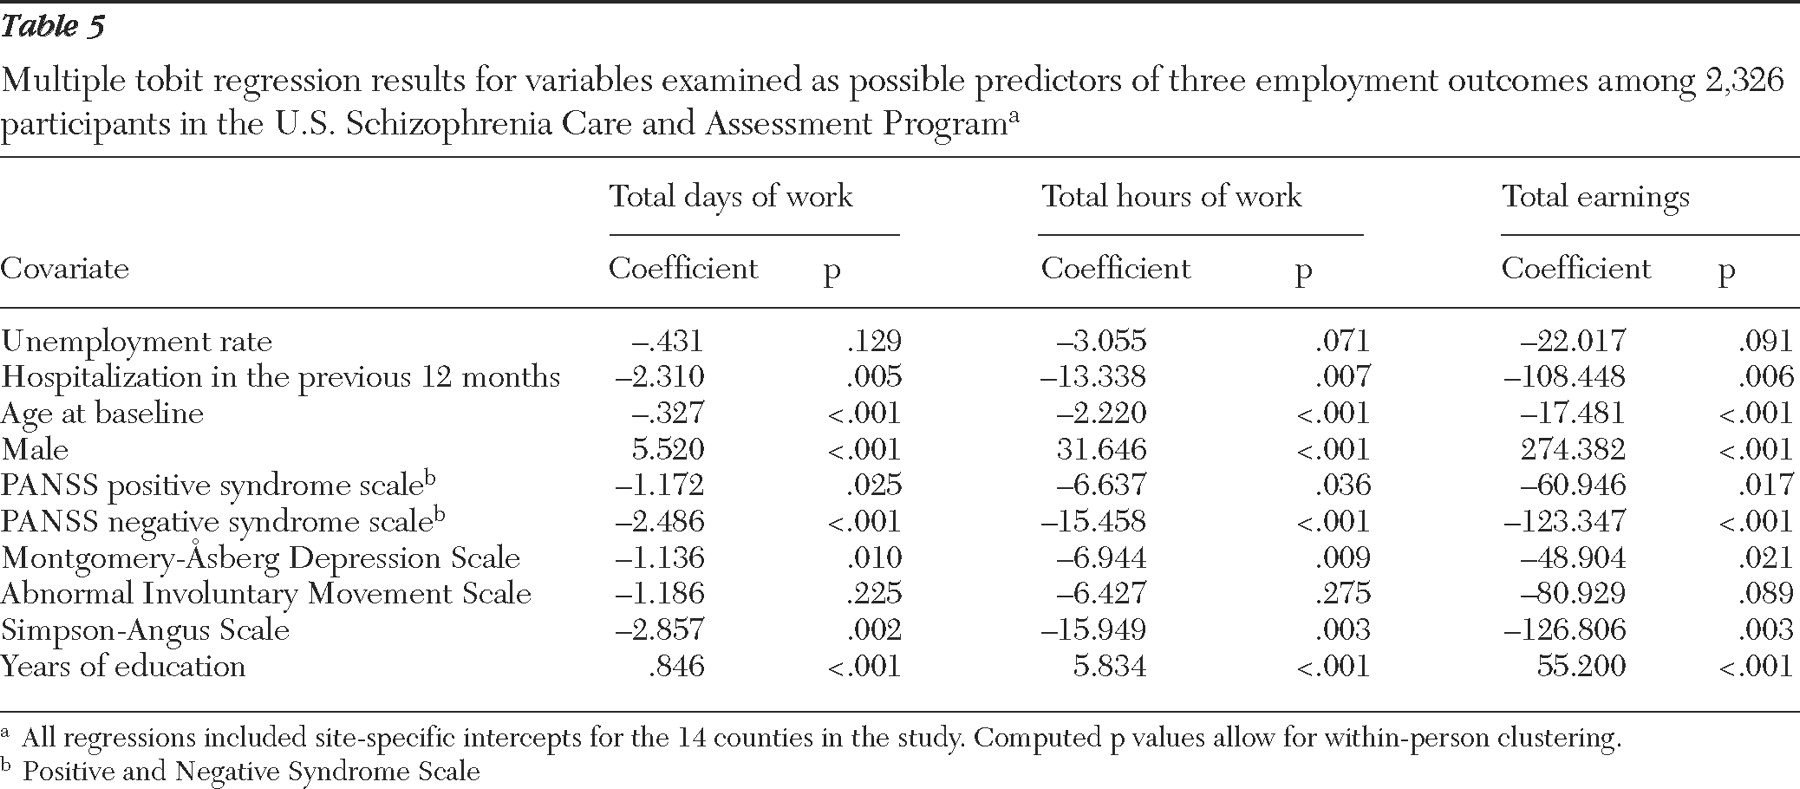
Multiple tobit regression results, shown in
Table 5, are similar to the probit results. The most notable differences are the slightly stronger relationships to poorer outcomes for the unemployment rate, for the MADRS score, and for the Simpson-Angus scale. The bivariate and multiple regression results are very similar. The most marked difference is the decline in significance of the coefficients for the AIMS score in multiple regressions. The similarity in results is consistent with the fact that correlations between the predictors were generally low; the largest is .393 between the AIMS and Simpson-Angus scores.
We also consistently found substantial and significant differences among the county-specific regression intercepts, which suggests that certain characteristics, such as the nature and extent of available vocational services and the structure of local job markets, varied by site and were strongly correlated with employment outcomes. (Variation in unadjusted mean employment rates for study assessments, by county, was large, with a median [of the mean rates] of 15.8%, a minimum of 10.2%, and a maximum of 50.0%. The extremes were observed for the two counties with the fewest data points.)
Sensitivity analyses
We conducted additional multiple regression analyses to test the sensitivity of our results to the specific model employed. (Results are available from the authors upon request.)
First, to incorporate economywide inflation, we deflated earnings by the national Consumer Price Index. This had little effect on the coefficient magnitudes for all predictors but resulted in a modest increase in statistical significance for the negative relationship of unemployment rate to monthly earnings. Second, we added linear and quadratic time trend variables, but these variables did not approach significance, reduced the size and significance of the results for the unemployment rate, and had little effect on other results. Third, we deleted the county-specific intercepts, which caused the estimated unemployment relationships to become positive and less significant. Fourth, on the basis of previous research (
23 ), we included a gender-education interaction variable. Results indicated a weaker relationship of education to employment outcomes for males, with the gender difference being significant or trending toward significance. Including this interaction had little effect on the results for predictors other than education.
Fifth, to allow for the inverted-U shape of age-earnings profiles often reported in the labor economics literature (
26 ), we added the square of the baseline age. This caused essentially no changes in results for other variables. Sixth, we added indicators (coded 0 or 1) for African Americans and for Hispanic ethnicity. The former approached significance in the employment probability regression and was significant in the regressions for employment at or above the minimum wage, workdays, work hours, and earnings. The latter approached significance in the regressions for employment at or above the minimum wage, workdays, and earnings and was significant in the regression for work hours. In all cases, these indicators were predictive of poorer employment outcomes. Their inclusion also increased the p values for the unemployment rate above the .1 level in the work hours and earnings regressions but otherwise did little to alter our results.
Discussion
Results presented here for the US-SCAP study pertain to a population of patients under treatment for schizophrenia in organized systems of specialty mental health care. Comparison of descriptive results with those of other recent studies illustrates differences consistent with the differing populations in these studies. In an analysis of data from participants in the Clinical Antipsychotic Trials of Intervention Effectiveness (CATIE), Rosenheck and colleagues (
14 ) found a 14.5% rate of competitive employment, defined as receiving any earned income in the past month, including pay from sheltered workshop jobs. In contrast, our reported community employment rate of 17.2% does not include persons in workshop jobs. Because the employment rate for sheltered workshop jobs in the US-SCAP data was about one-third of the rate for community employment, the difference between CATIE and the US-SCAP in the overall paid employment rate may be 7 percentage points or more (that is, 14.5% compared with approximately 22%). A plausible explanation is that patients who agree to be recruited into randomized double-blind clinical trials (such as CATIE) are less likely to be in a stable maintenance phase of treatment and thus less likely to be employed. This finding is consistent with previous analyses of data from the US-SCAP, which found a 23.9% community employment rate for persons in stable, maintenance-phase treatment (
24 ).
The exclusion in the CATIE trial of first-episode patients (
25 ) may also have contributed to the difference in findings, because samples of persons experiencing a first episode tend to have higher employment rates (
26 ). It is also possible that there may be systematic differences in recovery orientation (
27 ) between CATIE participants and the general patient population that are attributable to factors other than clinical treatment course. Surprisingly, the mean earnings reported by CATIE participants who worked were well above the mean earnings in the study reported here ($808 versus $494). The difference may be partly explained by inflation (CATIE started in 2001) and by differences between US-SCAP and CATIE in the geographic distribution of study participants.
Our study found lower employments rates, work hours, and wages than were found in a national household survey. Mechanic and colleagues (
28 ) reported employment rates for persons with schizophrenia ranging from 22% to 40%. An analysis of 1994–1995 National Health Interview Survey-Disability data found that more than half of employed persons with schizophrenia worked full-time. In our study, less than 15% of persons reporting hours of work reported 35 hours a week or more over the four-week recall period.
Data on employment rates from randomized trials of supported employment services also provide an interesting comparison (
29,
30 ). Because these studies included persons who expressed interest in work or in receiving vocational services, it is not surprising that baseline employment and work history data indicated much higher rates of previous employment rates than the rates observed in the US-SCAP. Approximately one-quarter to one-half of the participants in these trials did not have schizophrenia-related diagnoses, which may also help to explain the differences between these results and our own.
Results for our covariates are generally consistent with those of previous studies. The positive effects of education and the negative effects of age on employment outcomes have often been reported (
13,
14 ). The significant relationship between male gender and better work outcomes is consistent with some previous research (
11 ) and with analyses of earlier data from the US-SCAP (
6 ). However, literature reviews have noted variability in this relationship (
13 ).
Many studies support our findings of strong associations between greater symptom severity (especially negative symptoms) and poorer employment or occupational functioning (
13,
26 ). Analyses of data from supported employment trials have reported similar findings (
11,
31,
32 ), although one study reported strong evidence of a negative relationship between general psychopathology as measured by the PANSS and work outcomes and a slightly negative relationship for PANSS negative symptoms (
30 ). In CATIE baseline analyses (
14 ), PANSS positive and negative symptoms were significantly associated with employment outcomes, although the result for the negative symptom score diminished the result for the positive symptom score when both were included in the regression model. Also, inclusion of a measure of intrapsychic functioning based on a modified quality-of-life scale yielded a highly significant result and substantially attenuated the associations between PANSS negative and positive symptom scores and work outcomes. The variation in these results as more variables were added to the model suggests strong correlations among the three measures, especially between negative symptoms and intrapsychic functioning, as reported by Swartz and colleagues (
33 ).
In terms of results for other clinical factors, recent hospitalization as an indicator of clinical instability has not been used widely in research on employment outcomes, but our result for this predictor is consistent with results of previous studies (
32,
34 ). The CATIE baseline analysis did not find a significant association between depression and employment, even in a bivariate test (
14 ). The CATIE analysis also found a significant bivariate association (p=.03) between employment and the AIMS score but not the Simpson-Angus score. The latter finding may partly reflect higher Simpson-Angus scores in the sample because first-episode patients were excluded from CATIE. In view of the high rate of elevated depression scores in the US-SCAP data, our own results for depression may warrant further investigation.
Several recent studies have examined the effects of labor market factors, but the influence of other study site characteristics were not taken into account; thus the results reflect either purely cross-sectional variation (
14 ) or a combination of cross-sectional and time-series variation (
11 ) in local unemployment rates. In the CATIE study (
14 ), the bivariate relationship between the county unemployment rate and a participant's employment status was insignificant. In the analysis by Cook and colleagues (
11 ) of supported employment trials, results differed by regression model. In one model the county unemployment rate had a significant negative association with work outcomes for participants in the control group, but no association was found for participants who received individual placement and support. In a second model in which sites were divided on the basis of unemployment rates, treatment groups in areas with high unemployment rates did significantly worse than their counterparts in areas with low unemployment rates; surprisingly, the reverse was found for the control groups. A recent study of participants in employment services programs focused specifically on changes over time in local unemployment rates and found no association between the rates and employment of persons with severe mental illness (
35 ). Our finding that cross-sectional variations in unemployment rates had little or no association with employment outcomes for persons with schizophrenia is consistent with the results of these previous studies. However, unemployment may be correlated with other site-specific factors not measured directly in the analyses.
The limitations on the scope of our data and analyses leave considerable room for further investigation. Although our database has important advantages over data from household surveys and intervention trials, the sample is not statistically representative of all persons in treatment. Further research with more detailed data is also needed to investigate barriers to employment that could not be examined in this study, such as the role of discrimination (related to race, ethnicity, or stigma) or the deterrent effects of disability payment systems.
Further research may be especially important for understanding the role of clinical factors. For example, severe symptoms may be a barrier to employment for many reasons, including lower productivity, greater stigma, employers' inaccurate perceptions of work ability, greater dependence on public or subsidized mental health care, and inadequacy of formal and informal job supports.
Finally, it is hoped that recognition of employment and recovery as important treatment outcomes will encourage researchers to address the effects on work outcomes of treatment characteristics, such as the choice of different medications and adherence to treatment guidelines. Although efforts to assess these effects have been limited (
24,
36,
37,
38,
39 ), future large-scale and long-term naturalistic and randomized studies should reflect the high priority of this line of research for the transformation to a recovery-oriented services system.
Acknowledgments and disclosures
This article extends the work of the US-SCAP study that was supported by Eli Lilly and Company and administered by the Medstat Group. The authors thank the site investigators and others who collaborated in the research. By site, they include the following: Maryland: Anthony F. Lehman, M.D., M.S.P.H., School of Medicine, University of Maryland, and Gerard Gallucci, M.D., M.H.S., Johns Hopkins Bayview Medical Center; Colorado: Courtenay Harding, Ph.D., University of Colorado (formerly); Florida: David Shern, Ph.D., Florida Mental Health Institute, University of South Florida, and Terri Saunders, M.S. (formerly of Florida Mental Health Institute); North Carolina: Jeffrey Swanson, Ph.D., Lawrence A. Dunn, M.D., and Marvin S. Swartz, M.D., Duke University Medical School; California: Richard L. Hough, Ph.D., and Concepcion Barrio, Ph.D., Child and Adolescent Services Research Center and San Diego State University; Connecticut: Robert A. Rosenheck, M.D., and Rani Desai, Ph.D., Department of Veterans Affairs Connecticut Health Care System; Medstat Group: Pat Russo, Ph.D., M.S.W. (formerly), Liisa Palmer, Ph.D., Lito Torres, M.B.A., and Brian Cuffel, Ph.D. (formerly); Eli Lilly and Company: Don Buesching, Ph.D., Brian M. Johnstone, Ph.D., and Thomas Croghan, M.D. (formerly); consultants: David S. Salkever, Ph.D. (formerly of Johns Hopkins University), Eric P. Slade, Ph.D. (formerly of Johns Hopkins University), William Hargreaves, Ph.D., and Martha Shumway, Ph.D., University of California, San Francisco. The authors are also indebted to Lito Torres, M.B.A., of the Medstat Group for programming assistance and advice in facilitating use of the US-SCAP data set.
Dr. Swartz has received speaking honoraria from AstraZeneca Pharmaceuticals. Other than the support from Eli Lilly and Company, the other authors report no competing interests.
