IPS retention
Data from client interviews show that substantial but declining proportions of veterans reported involvement in IPS. Altogether, 82% (N=263) of all veterans in the phase 2 group reported contact with the employment specialist during the first three months of the program, and of these 68% (N=218) were still participating at six months, 56% (N=180) were still participating at nine months, 53% (N=170) were still participating at 12 months, 41% (N=132) were still participating at 15 months, and 28% (N=90) were still participating at 24 months. The median participation rate, as reported by the clients at follow-up interviews, was thus 13 months among those with any reported participation in IPS.
Data from employment specialist administrative records show substantially higher rates of involvement, with 94% (N=302) of clients in the phase 2 group having documented contact with an employment specialist, of whom 90% (N=289) were still involved at six months, 77% (N=247) were still involved at 12 months, and 49% (N=157) were still involved at 24 months, with a median participation rate of just under 24 months. Thus administrative records suggest substantially greater involvement than self-report data from follow-up interviews, although both sources suggest more prolonged involvement than in real-world "high-fidelity" programs (
24 ).
One percent (N=2) of veterans in the phase 1 group reported any contact with an employment specialist.
Face-to-face contacts between employment specialists and veterans were more intensive during the first three months, averaging 86 minutes per week and then plateauing at an average of 34 minutes per week from six months to 24 months.
During the first three months of participation, when many veterans were in residential treatment facilities, only 27% of contacts took place in community settings. The proportion of community contacts rose to 35% at six months and averaged 46% thereafter, demonstrating substantial emphasis on community-based services delivery, one of the hallmarks of IPS.
Employment specialists also documented contacts with mental health clinicians. All nine employment specialists had at least one such contact during the first three months, declining to 72% from nine to 12 months and 49% from 21 to 24 months. They also documented face-to-face contacts with veterans' employers, ranging from 66% of all veterans involved in the first three months, 33% from nine to 12 months, and 23% from 21 to 24 months.
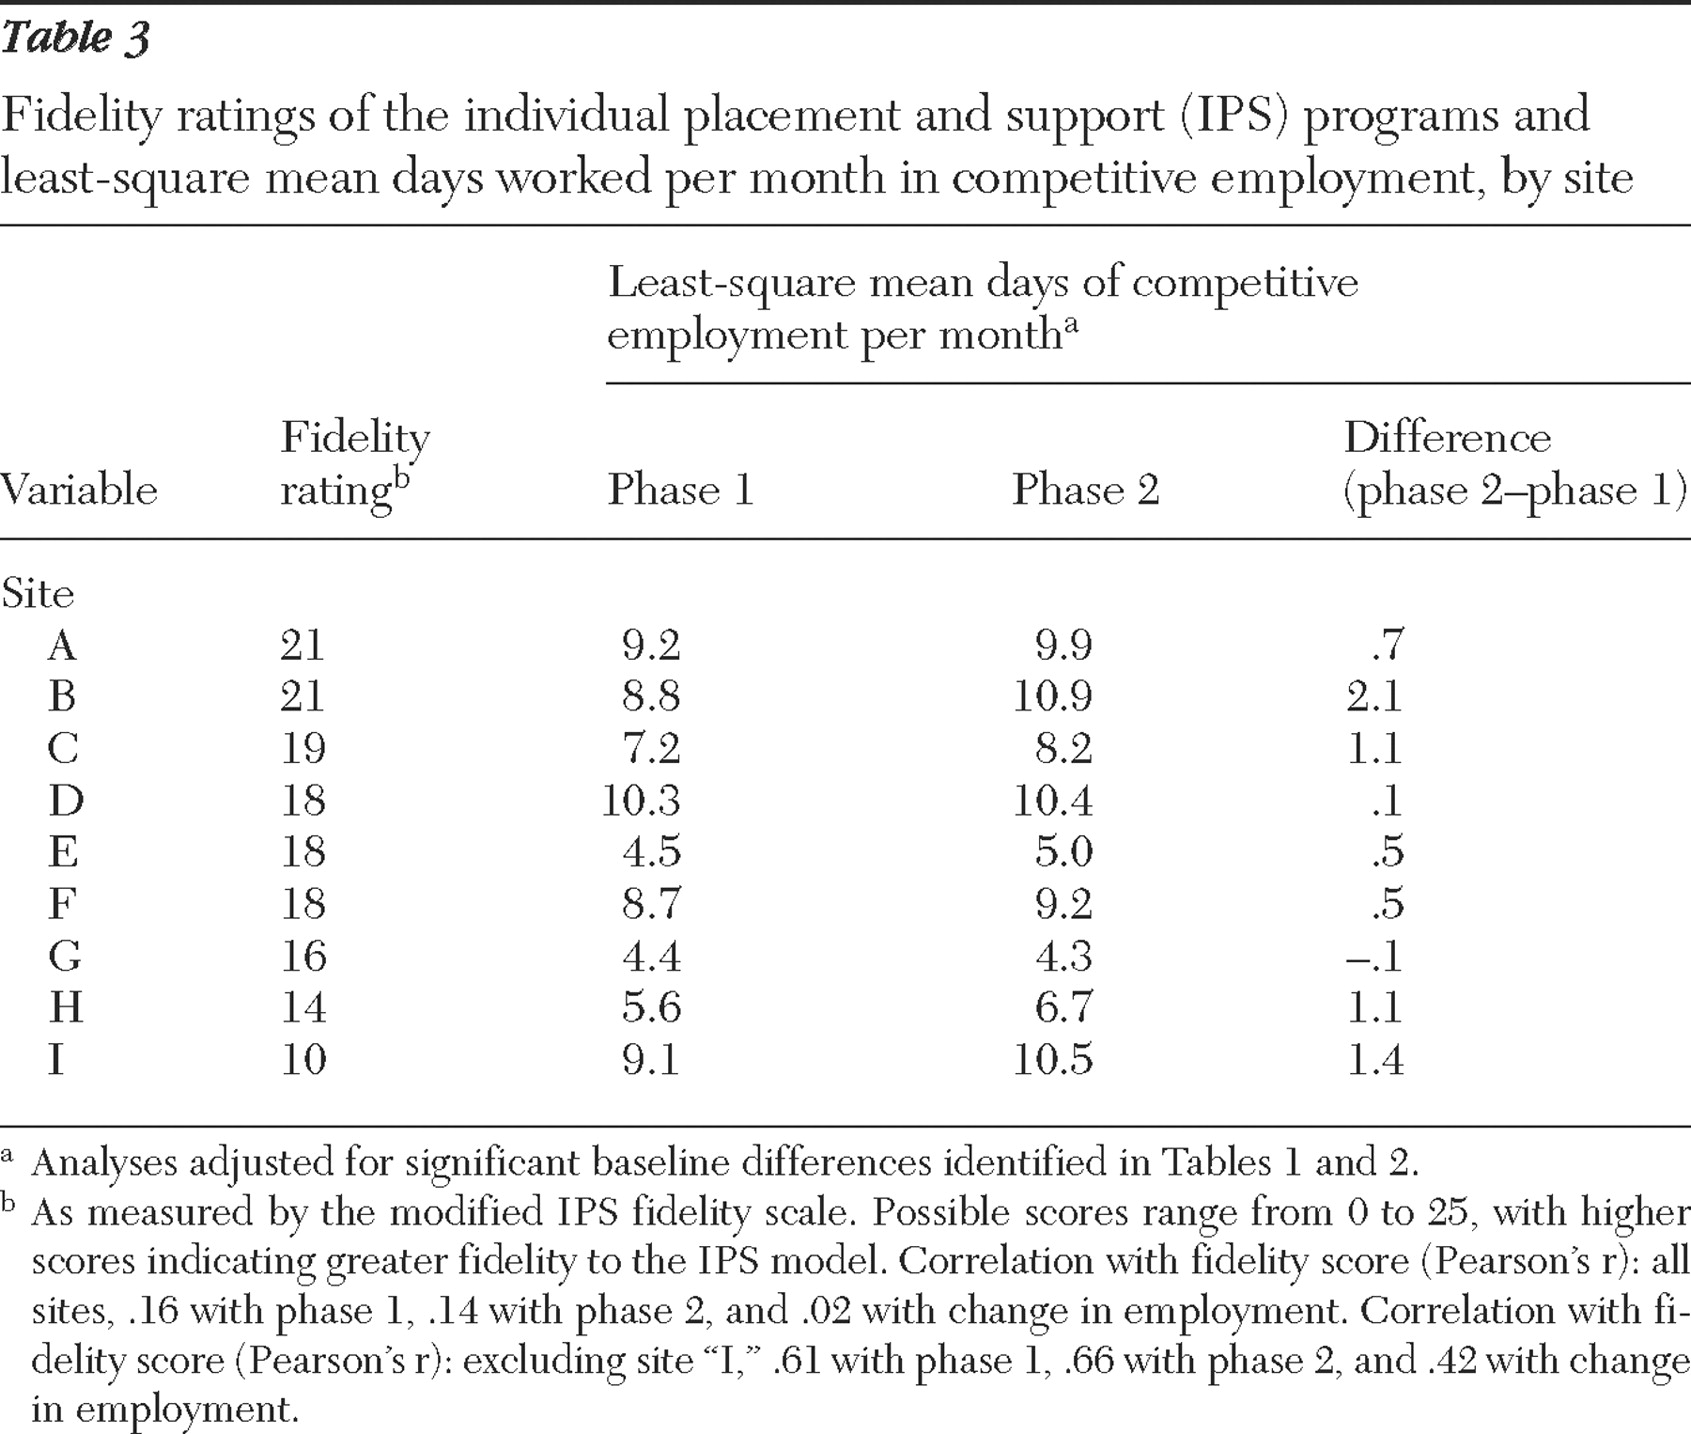
Fidelity ratings. Fidelity ratings (
Table 3 ) were used to classify sites as having no fidelity (8% of all 27 ratings over all three assessment periods), low fidelity (23% of ratings), acceptable fidelity (35% of ratings), or excellent fidelity (35% of ratings). During the final two rating periods only one site (22%) had "no" or "low" fidelity, while the rest (78%) were "acceptable" or "excellent."
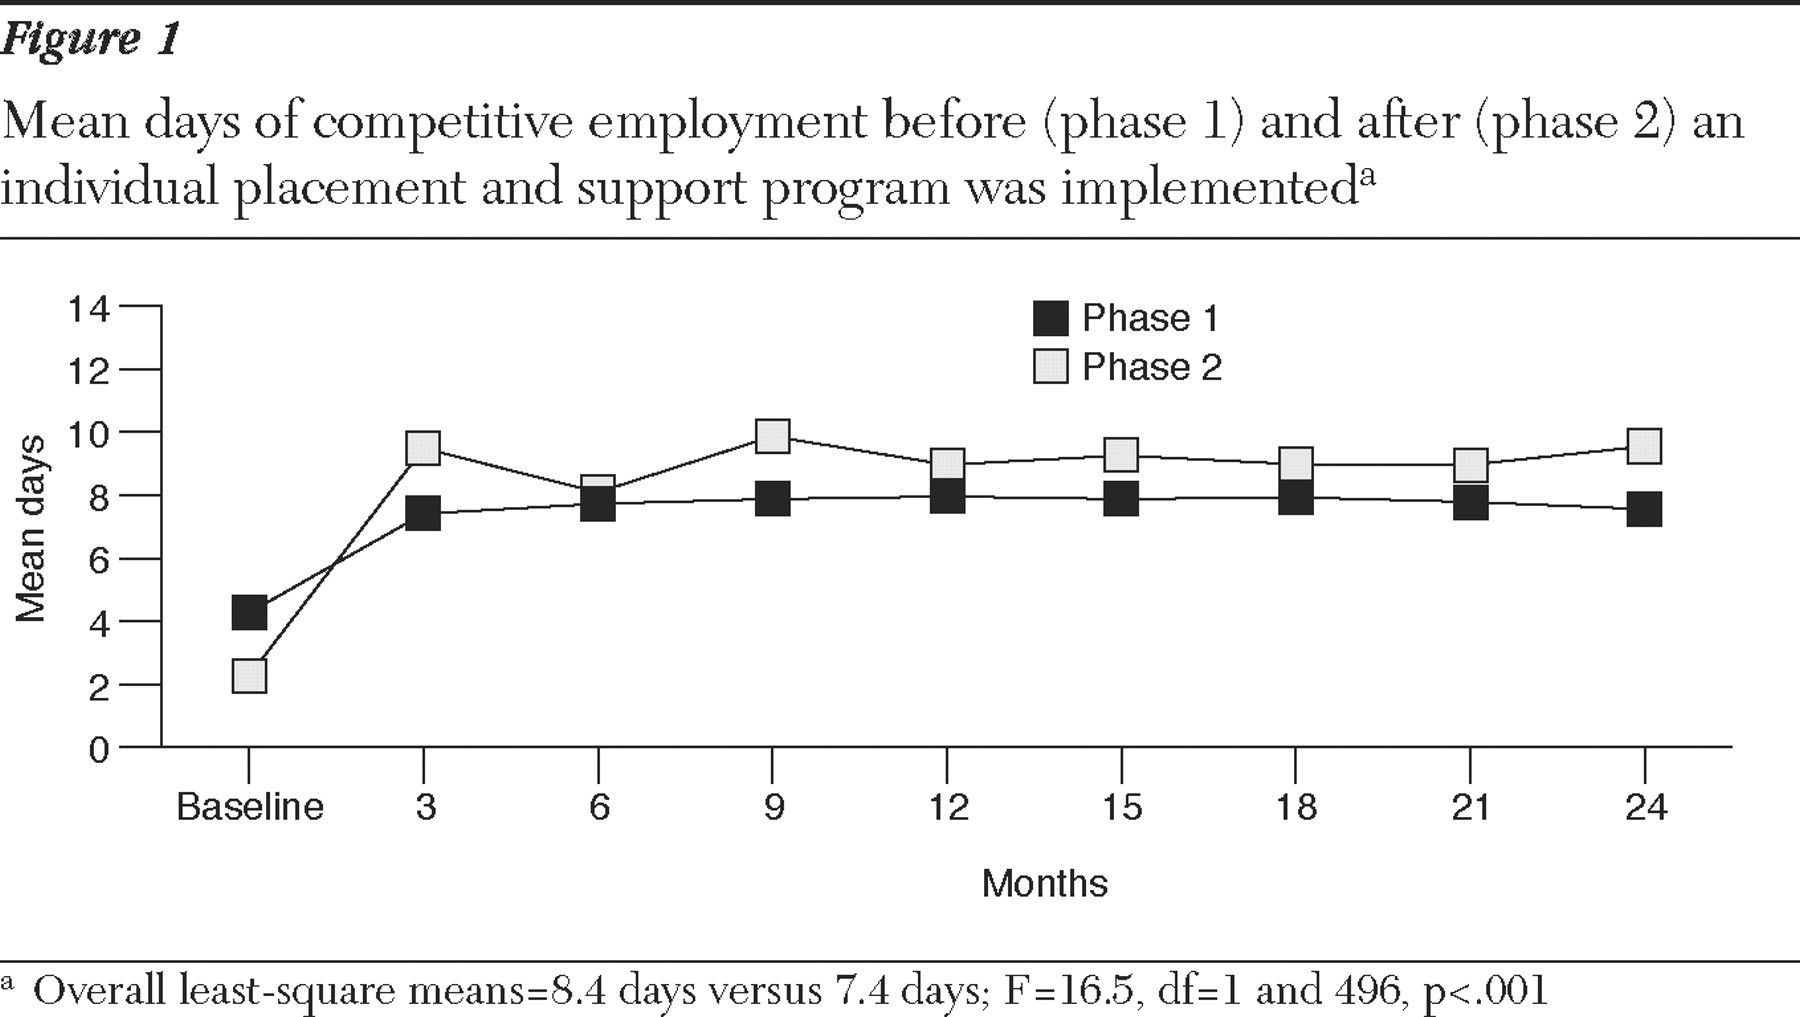
Outcomes. In mixed models without baseline covariates that used all completed follow-up interviews, days of employment were substantially greater for the IPS group (least-square means=8.8 days for the IPS group compared with 5.6 days for the control group, a 57% difference). However in mixed models that also controlled for significant baseline characteristics that were different between the two phases, veterans in phase 2 had only 15% more days per month of competitive employment on average (least-square means [that is, adjusted for baseline differences]=8.4 days compared with 7.3 days; F=14.0, df=1 and 496, p<.001) along with 32% significantly fewer days of noncompetitive employment (for example, CWT) (least-square means=1.5 days compared with 2.2 days; F=8.6, df=1 and 583, p=.004) (
Figure 1 ). Veterans in the phase 2 group had 5% more days per month of any kind of employment, which was not significantly greater than the number of days for the phase 2 group (least-square means=11.6 days compared with 11.0 days; F=2.8, df=1 and 548, p=.09).
Site-level results show small differences in days of competitive employment favoring IPS at eight of nine sites (
Table 3 ). An exploratory analysis of bivariate correlations (Pearson's r) of fidelity ratings and employment outcomes across all sites revealed small correlations (that is, less than .20). However, the site with the lowest fidelity rating (site "I" in
Table 3 ) showed a relatively high level of competitive employment in phase 2 and of improvement from phase 1 to phase 2. Because the number of sites in the sample was small, we reexamined these exploratory relationships with this site excluded. We found a substantial association between fidelity ratings and days of competitive employment in phase 2 (r<.6) and between fidelity ratings and improvement in days of competitive employment (r<.4), although the sample was too small to allow meaningful significance testing.
Paralleling the findings for days employed each month, the proportion of clients with any competitive employment at follow-up interviews was greater for the phase 2 group (44%, compared with 40%; F=15.5, df=1 and 469, p<.001), as was the proportion with any employment (65% compared with 63%; F=3.3, df=1 and 557, p<.04). Smaller percentages of veterans in the phase 2 group participated in noncompetitive employment (10% compared with 14%; F=9.9, df=1 and 578, p=.002). There were no significant between-group differences in hourly wage ($8.52 in the phase 2 group compared with $8.10 in the phase 1 group) or monthly earnings ($1,242 in the phase 2 group compared with $1,150 in the phase 1 group). Average annualized employment income among all participants was $1,299 greater for those in the phase 2 group ($8,889 compared with $7,590; F=4.5, df=1 and 596, p=.01).
Although at follow-up veterans in phase 2 had a greater average number of days housed than veterans in phase 1 (least-square means=34.1 days compared with 29.8 days; F=4.2, df=1 and 644, p=.04), there were no significant differences in other clinical outcomes on any other measure (mental health status, psychiatric symptoms, substance abuse, general health, and social support).
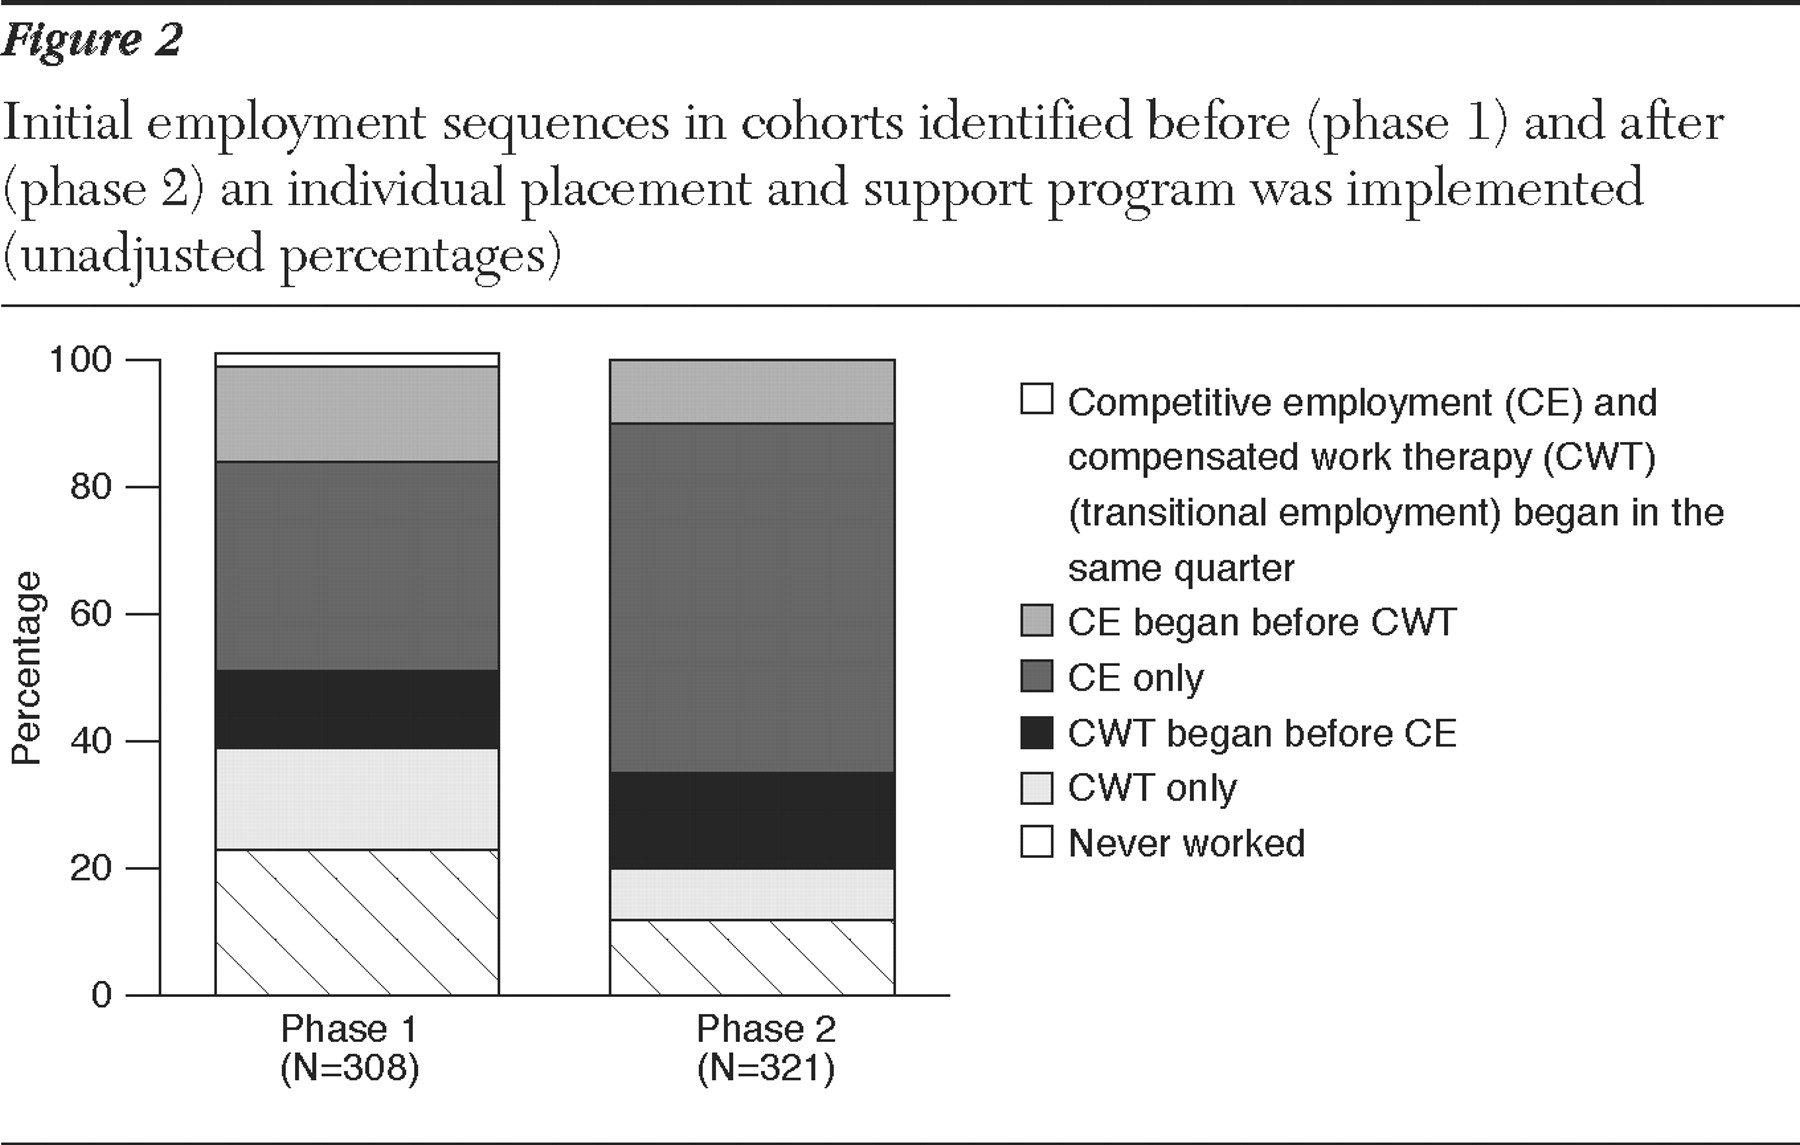
Relationship to transitional employment. Because the VA is a system in which transitional employment was previously well established, we compared employment sequences of transitional employment and competitive employment in phase 1 and phase 2 (
Figure 2 ). According to these unadjusted figures, 23% (N=71) of veterans in the phase 1 group never worked, compared with only 12% (N=39) in the phase 2 group. It is notable that there were similar proportions who were involved in transitional employment only, in transitional employment followed by competitive employment, and competitive employment followed by transitional employment. The greatest difference between phase 1 and phase 2 was in the proportion who worked in competitive employment only (102 clients, or 33%, in phase 1, compared with 177 clients, or 55%, in phase 2). Thus, even when IPS was available, although most veterans went directly into competitive employment, some veterans entered transitional employment before or after entering competitive employment.
Analysis of vocational outcomes by diagnostic subgroups showed that among clients with diagnoses of substance use disorders without psychiatric comorbidity employment gains for persons in the IPS group were significantly greater than those in the control group (least-square means=9.6 days per month for the phase 2 group compared with 8.5 days per month for the phase 1 group), a 14% difference favoring IPS (F=6.8, df=1 and 435, p=.01; N=194). Among patients with diagnoses of serious mental illness, either with or without substance abuse, benefits for IPS in days of competitive employment were slightly smaller, with a statistically significant increase of 9% in days of competitive work per month (least-square means=7.4 days per month for the phase 2 group compared with 6.8 days for the phase 1 group; F=5.0, df=1 and 688, p=.025, N=194).
