Structural abnormalities in schizophrenia are well established, but the focus remains obscure. It has been suggested that schizophrenia is a limbic encephalopathy
(1,
2). Claims have been made for low hippocampal volume, mainly on the basis of magnetic resonance imaging (MRI) studies, although these claims have been disputed and are not supported by some postmortem studies
(3,
4). The fornix, by contrast, has received little attention. This is surprising because it is a well-defined tract through which neurons project to and from the hippocampus. Cytoarchitectural abnormalities of diverse types in the hippocampus have also been found in schizophrenic patients
(5,
6), and it is possible that these would be associated with abnormalities in input and output through the fornix.
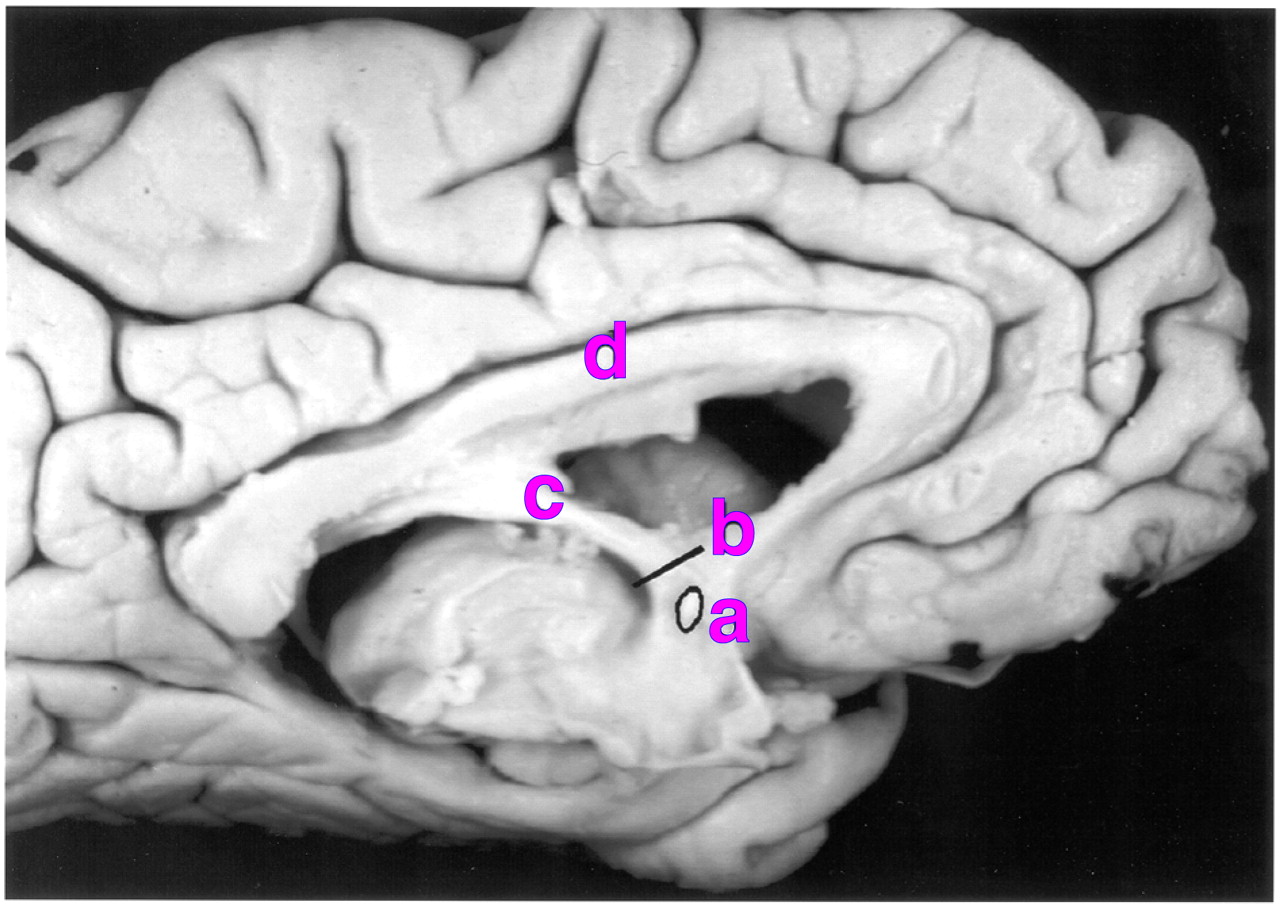
The fornix arises from the fimbria on the anterosuperior curvature of the hippocampus (
Figure 1). Beneath the splenium of the corpus callosum some of its fibers decussate at a point known as the commissure of the fornix (or hippocampal commissure). As they descend, the columns of the fornix divide around the anterior commissure into a postcommissural projection to the mamillary complex and a precommissural projection to the septum.
Asymmetry in the position of the anterior columns has been observed in MRI studies of humans
(7), and a delayed T
2 relaxation time in the left anterior column in male patients with schizophrenia was reported
(8). The latter finding implies an abnormality of fiber number or myelination, but macroscopic imaging findings are difficult to interpret in the absence of corresponding histological information. The principal aim of this study was to clarify whether there is an abnormality in fiber number or density in the left anterior column in male patients, within the more general aim of assessing the structure of the fornix in schizophrenia. Previous findings regarding the hippocampus suggest two hypotheses; the first is that, in keeping with reports of grossly low hippocampal volume and cell number
(9), the total number of fibers is low. The second hypothesis, consistent with abnormal cellular morphology
(10) and orientation in the hippocampus (and elsewhere), is that subtle, e.g., lateralized, abnormalities in the fornix are a consequence of a more global abnormality in brain connectivity. Differentiating between these hypotheses will clarify whether the disease process is focused on the limbic system.
In this study, cross-sectional area, fiber density, and total fiber number were examined in postmortem brains at a point in the descending columns of the fornix. Estimates of fiber density and cross-sectional area were obtained by using stereological methods. The left and right fornices were examined individually, and asymmetry measures were calculated for each case.
METHOD
Postmortem brains were suspended by the basilar artery for fixation in 10% formalin. After diagnostic and pathological assessment the series consisted of 62 brains, from 16 male and 13 female patients with schizophrenia and a comparison group of 19 men and 14 women. The mean age of the women at the time of death was 74.6 years, the mean age of the men was 64.9 years, and an analysis of variance (ANOVA) showed a significant difference in the ages of the two groups (F=8.52, df=1, 58, p<0.01). No difference in age was found between diagnostic groups, but because of the difference between the sexes, all tests included age as a covariate where appropriate.
Brains were collected from patients and comparison subjects for whom the next of kin had consented to use of tissues in medical research. The schizophrenic patients were selected on the basis of the assessment of clinical notes by a psychiatrist (T.J.C. or S.J. Cooper). The DSM-IV criteria for schizophrenia and schizoaffective disorder were used for the selection of cases of schizophrenia. The comparison brains were collected prospectively from individuals who had died without a history of neuropsychiatric disorder and for whom the next of kin had consented to use of tissues in medical research.
Pathological assessment of tissue samples was carried out by a neuropathologist (M.M.E. or B. MacDonald) by using the criteria of the Consortium to Establish a Registry for Alzheimer’s Disease
(11). All brains were confirmed to be free from major neuropathology (including Alzheimer’s disease, Parkinson’s disease, and cerebrovascular disease).
The degree of neuroleptic medication received during each subject’s lifetime was assessed from case notes and was categorized as little, average, or much. This was based on a clinician’s judgment based on the available clinical records. The variability of the information available precluded a more quantitative estimation. Other potentially confounding variables, including age at onset, hospital of origin, postmortem interval, and fixation time, were noted for statistical analysis (
table 1).
All measures were performed by the same researcher (S.A.C.), who was blind to the diagnosis and gender of the subjects. Each brain was bisected in the median sagittal plane to reveal the medial surface of the hemispheres. A section of the descending column of the fornix was removed from each hemisphere, immediately superior to the anterior commissure (
Figure 1). The block was embedded in paraffin wax, and a single 5-µm section was cut from the inferior surface in a plane orthogonal to the trajectory of the fornix. The sections were stained by using Palmgren’s silver stain for nerve fibers.
A cross-sectional area estimate was obtained by stereological point counting by means of a 1-mm
2 point density grid printed on acetate, laid over the cross-section and viewed under 2× magnification on a binocular microscope. A pilot study established that five replacements of the grid were required to obtain a reasonable estimate of cross-sectional area (coefficient of error of 0.1 or less). The stereological principles used in this study were in accordance with those of Gundersen et al.
(12).
For calculation of axonal fiber density the sections were then viewed with a 100× oil immersion objective. Color images were captured from the whole area of the fornix cross-section by using a systematic random rectangular search pattern. A pilot study determined that sampling approximately 20 images from each fornix gave a good estimate of fiber density (a coefficient of error of 0.1 or less). Excess images were discarded in a systematic random manner (i.e., discards were not biased toward any part of the cross-section).
The images were captured by a microscope-mounted video camera and were displayed on a visual display unit by using the XV software package (John Bradley, Bryn Mawr, Pa.) at an eventual magnification of 4600×. Fibers were counted in a stereological counting frame superimposed on the image to fit the scale of a 10 µm × 10 µm square. Over 124 fornices the mean number of fibers counted per fornix was approximately 350.
Cross-sectional area, fiber density, and total fiber number were calculated for the right and left fornices of each subject. The total fiber number was calculated as follows: a × d × 10,000, where a=area, d=density, and 10,000 is the number of 10 µm × 10 µm squares per square millimeter. An average value and an asymmetry measure, (R–L)/(R+L)%, were calculated for each of area, density, and total number for the two fornices in each individual. Statistical analyses were carried out by using the software package SPSS (SPSS, Chicago).
RESULTS
Cross-Sectional Area
Since an abnormality in fornix cross-sectional area was not predicted according to the principal aim of this study, these measures were subjected only to a general analysis by repeated measures ANOVA. Fornix area, by diagnosis and sex, is shown in
table 2. No significant between-subjects effects were found for gender, diagnosis, or the interaction of the two; however, the men had a somewhat larger right fornix area than the women (F=3.99, df=1, 57, p=0.051). For the within-subject variables, no main effects involving side were found. Analysis of covariance (ANCOVA) indicated no effect of age on cross-sectional area.
Fiber Density
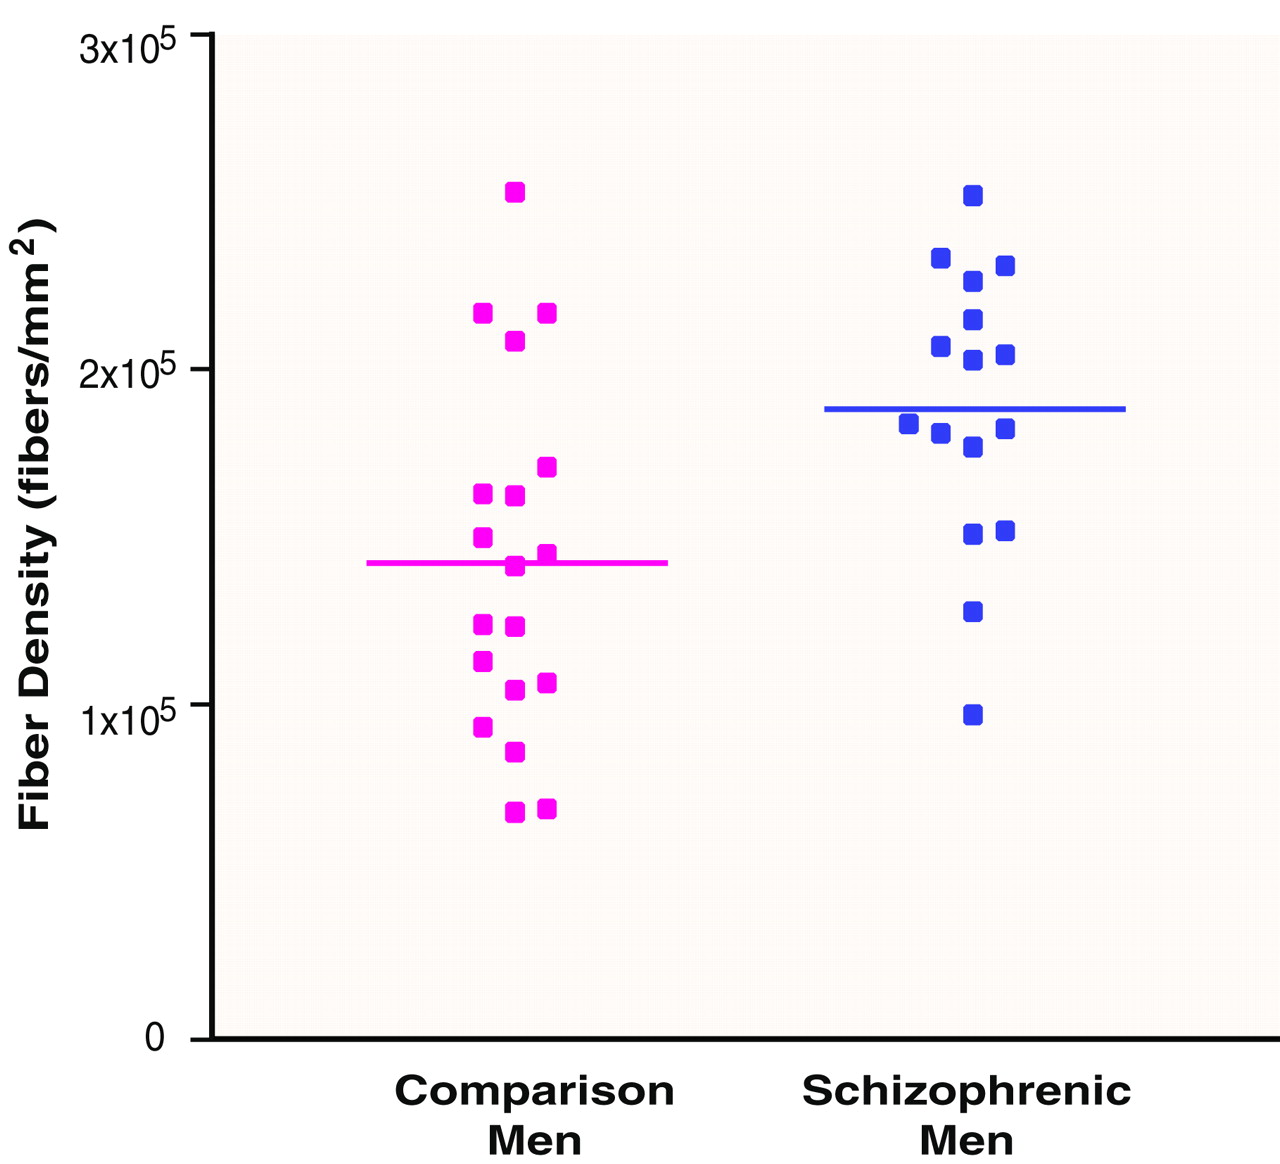
1. In accordance with the principal aim of the study, an independent-samples t test was performed to compare the density of fibers in the left fornix of schizophrenic men with that of men from the comparison group. The density of fibers was significantly greater in the schizophrenic group (
table 2 and
Figure 2).
2. A repeated measures ANOVA for the density of fibers in the fornix showed a between-subjects main effect of gender (F=4.27, df=1, 57, p=0.05), with the men having a lower density than women. There was no between-subjects main effect of diagnosis and no gender-by-diagnosis interaction.
It is notable that the difference in the left fornix in men that was identified by t test revealed itself only in a post hoc repeated measures ANOVA for men as a diagnosis-by-side interaction (F=5.08, df=1, 33, p=0.03). No other within-subject effects were observed. An ANOVA for the asymmetry measure of density illustrated the diagnosis-by-side interaction, whereby the normal right-greater-than-left asymmetry in men was reversed (left greater than right) in the male schizophrenic patients (F=4.09, df=1, 32, p=0.05). ANCOVA indicated no effect of age on fiber density.
Total Fiber Number
1. Total number of fibers, by diagnosis and sex, is shown in
table 2. The predicted abnormality in total fiber number in the left fornix in the male schizophrenic patients was not found (t=1.88, df=33, p=0.07).
2. A repeated measures ANOVA yielded no significant effects of gender (F=0.40, df=1, 57, p=0.53), diagnosis (F=0.26, df=57, p=0.61), side (F=0.09, df=1, 58, p=0.76), or their interactions on total fiber number. ANCOVA revealed no effect of age on total fiber number.
Area-by-Density Interaction
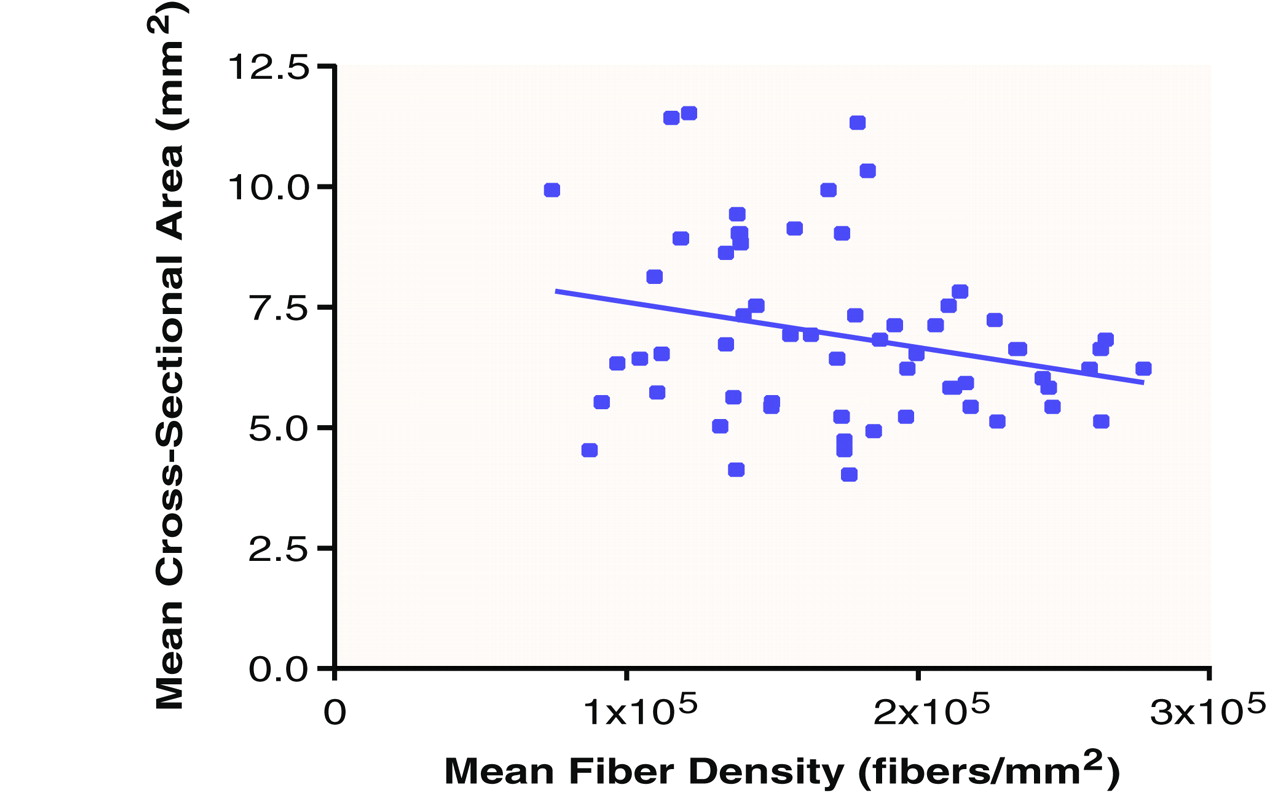
In view of the possible interaction between fiber density and cross-sectional area implied by lower fiber density and a concomitant trend toward a larger area, particularly on the right side, in men, a linear regression was performed to compare average area and average density across all subjects. A negative relationship between the two was found (R
2=0.07) (
Figure 3). For fiber density in the left fornix of the schizophrenic men, a similar negative relationship with area was found (R
2=0.30).
Reliability
The cross-sectional area was estimated twice for 20 randomly selected fornices to test intrarater reliability. This provided an intraclass correlation coefficient of 0.92. For the method of counting fiber density, the captured images from 10 randomly chosen fornices were recounted, and comparison of the means yielded an intraclass correlation coefficient of 0.99.
Artifacts and Covariables
Potential artifacts were formalin fixation time, postmortem interval, age at onset (
table 1), hospital of origin, and degree of neuroleptic medication. Since both the density of fibers and fornix area are affected by gender and schizophrenia to some extent, the influences of hospital of origin and degree of neuroleptic medication were introduced (with age included as a covariate) as factors in repeated measures ANOVAs of these variables. No differences were found between groups on the basis of these factors. The mean level of medication within the schizophrenic group corresponded to a rating of “average.”
ANOVAs determined that there was no difference in postmortem interval between groups analyzed by gender and diagnosis. Age at onset was also analyzed as a variable in an ANOVA, which showed no significant effect of gender. There was a difference in fixation time between the schizophrenic (mean=83 months) and comparison (mean=55 months) groups. Brain weight also differed between groups based on both gender and diagnosis (
table 1). As a result, brain weight was included post hoc as a covariate (with one subject missing owing to lack of data) in the tests of fiber density that had yielded an effect of diagnosis or gender, and in view of its diagnosis sensitivity, fixation time was included in tests showing an effect of diagnosis.
A general repeated measures ANCOVA on the fiber density data showed that although brain weight was not a significant covariate, the effect of sex was reduced below significance (F=3.10, df=1, 55, p=0.08), suggesting that the variable causing a gender difference in fiber density may be part of the cause for overall differences in brain size between genders.
Because of the differences in fixation time and brain weight between groups selected by diagnosis, these variables were included in a repeated measures ANCOVA to test male subjects for the greater fiber density on the left in schizophrenia. Neither brain weight nor fixation time proved to be a significant covariate, and the diagnosis-by-side interaction remained significant (F=4.30, df=1, 32, p=0.05).
DISCUSSION
Following is a summary of the findings from this study.
1. Men have a lower density of fibers in the fornix than women.
2. The density of fibers on the left in men is significantly greater for patients with schizophrenia than for comparison subjects.
3. Total fiber number is not significantly affected by gender or diagnosis.
Fiber density was lower and cross-sectional area was greater in the men than in the women; this gender effect may be related to larger brains in the men. The most striking finding is that this difference between the sexes is less pronounced in schizophrenia—the male schizophrenic patients had a significantly greater density of fibers than the comparison men when the smaller brain size in schizophrenia was taken into account.
The finding of a difference in fiber density is reminiscent of results in other studies of this series of brains (13, 14). Fiber density was low in the anterior commissure and anterior corpus callosum of schizophrenic women. The commissural role played by these structures in relation to the orbitofrontal cortices may explain the similarity of findings in the two areas. However, fiber density in the same areas of the corpus callosum was greater in the male patients with schizophrenia than in the men in the comparison group—a striking and as-yet unexplained sex difference in pathophysiology. In the present study of the fornix there were no significant differences between groups in total fiber number even when gender was taken into account. Thus, our findings are inconsistent with the concept of schizophrenia as a primary encephalopathy of the limbic system.
A process that could account for a change in area and density without a change in total fiber number is myelination. Weinberger
(15) has suggested that myelination may be involved in schizophrenia, and the role myelination could play in psychosis is also highlighted by the review of metachromatic leukodystrophy by Hyde et al.
(16). They found that over 50% of adolescents and adults with early onsets of this progressive demyelinating disease showed psychiatric symptoms in early stages. As demyelination progresses, psychotic symptoms give way to sensorimotor neurological signs.
Applying this explanation to the present findings, one might suggest that myelination in some critical tracts, such as the fornix, occurs later in brains that are larger (e.g., those of males) and later in the hemisphere that goes on developing longest (generally the left). When an arrest or dysynchrony occurs at a late stage of brain development, this may be reflected most clearly in those pathways and that sex in which the process of myelination is most delayed.
In conclusion, it is apparent that schizophrenia and to some extent gender have an influence on the neuroanatomy of the fornix. From the finding that total fiber number shows no difference in schizophrenia, it seems clear that the fornix is not a primary site of neuroanatomical change in the disease. However, the difference in fiber density in men may be interpreted as a delay in late developmental processes, including myelination. Such a delay is consistent with the concept that the primary pathophysiological change is in the development of global connectivity
(17–
19).


