The epidemiology of seasonal affective disorder has been intensively studied in recent years, with three major approaches having been used. One approach has been to examine patient populations by searching case registers for individuals with a clear seasonal pattern in their relapses and remissions. A second approach has been to screen populations for current symptoms at different parts of the year, then examine seasonal changes. A third approach has been to survey populations with an instrument that focuses directly upon seasonal changes in mood and behavior. The Seasonal Pattern Assessment Questionnaire
(1) is such an instrument and has been used to identify subjects with seasonal affective disorder as well as its milder form, subsyndromal seasonal affective disorder
(2,
3).
Most studies have found seasonal affective disorder and subsyndromal seasonal affective disorder to be more common in women than in men and that the incidence of both conditions decreases with age. Several studies have also found that the prevalence of seasonal affective disorder increases with latitude
(4–
8). However, some studies have suggested that people may acclimatize to the long winters experienced at higher latitudes
(7,
9). The question that needs to be addressed is whether the propensity for seasonal affective disorder differs among genetically diverse groups. Seasonal affective disorder and subsyndromal seasonal affective disorder have been studied in Iceland (latitude 64°N –67°N), where, unexpectedly, they were found to be less common than at much lower latitudes along the East Coast of the United States (39°N –42.5°N)
(10,
11). When compared to the rate reported in the Montgomery County study in the United States
(3), the prevalence of seasonal affective disorder has been found to be lower than expected in Japan
(5,
12). Furthermore, in contrast to other populations, seasonal affective disorder is less prevalent among women and the young within the Japanese population
(12–
14). Genetic factors have been suggested as an explanation for these differences
(13).
To test the hypothesis of a significant, etiological genetic component, seasonal affective disorder was studied in a population of immigrants of wholly Icelandic descent in Canada
(10). The prevalence of seasonal affective disorder and subsyndromal seasonal affective disorder was significantly lower in this immigrant population than in the aforementioned East Coast population. We have recently shown a striking difference in the prevalence of seasonal affective disorder between descendants of Icelanders in Winnipeg and other citizens of Winnipeg
(15). All of these studies used the Seasonal Pattern Assessment Questionnaire. The advantage of this tool is that it focuses directly upon seasonal variations in mood and behavior. The disadvantage is that it relies upon the participants’ long-term recall of their seasonal mood swings. The reliability of recall of affective episodes may be poor
(16), and the recall of seasonal pattern of depressive episodes may also be poor
(17).
The aim of the present study was to examine seasonal variations in mood in the Icelandic population by methods that do not depend on the long-term recall of the participants. For this purpose, we used the Hospital Anxiety and Depression Scale
(18) to measure the prevalence of anxiety and depression during summer, autumn, winter, and spring in a representative sample of the Icelandic population. The results are compared to cross-sectional studies from other countries.
METHOD
Four cohorts of 1,000 persons each, aged 20–70 years, were selected at random from the Icelandic National Register. After obtaining necessary ethical approval, each cohort was mailed the Hospital Anxiety and Depression Scale in either January, April, July, or October of 1987. A cover letter and a self-addressed stamped envelope were enclosed. The participants were asked to rate their state of well-being in the week before receiving the questionnaire. The dates were specified. Two follow-up letters were mailed. Only responses from the 4-week period after the first mailing were included in the analysis.
The Hospital Anxiety and Depression Scale is a 14-item self-assessment scale for anxiety and depression
(18–
21). Each item is scored from zero to three. Scores for both depression and anxiety range from 0 to 21, with a score of 11 or higher indicating caseness, a score of 8–10 rated as borderline, and scores below 8 indicating no disorder is present. The Icelandic version of the Hospital Anxiety and Depression Scale has been described elsewhere
(22), and a recent review of its psychometric properties has found it to be both a valid and reliable instrument
(23).
Data Analysis
The software package used was BMDP
(24). The tests used were t test, F test, and chi-square test. Double-sided p values and a significance level of 0.05 were used. Bonferroni correction was used for multiple tests. Analysis of covariance was applied to evaluate seasonal differences in mean Hospital Anxiety and Depression Scale scores for anxiety and depression. The mean values were adjusted for covariates, and the equality of slopes was tested. These analyses were also tested on logarithmic transformed Hospital Anxiety and Depression Scale scores; however, since the results were not appreciably different, they are not presented.
RESULTS
Response Rates
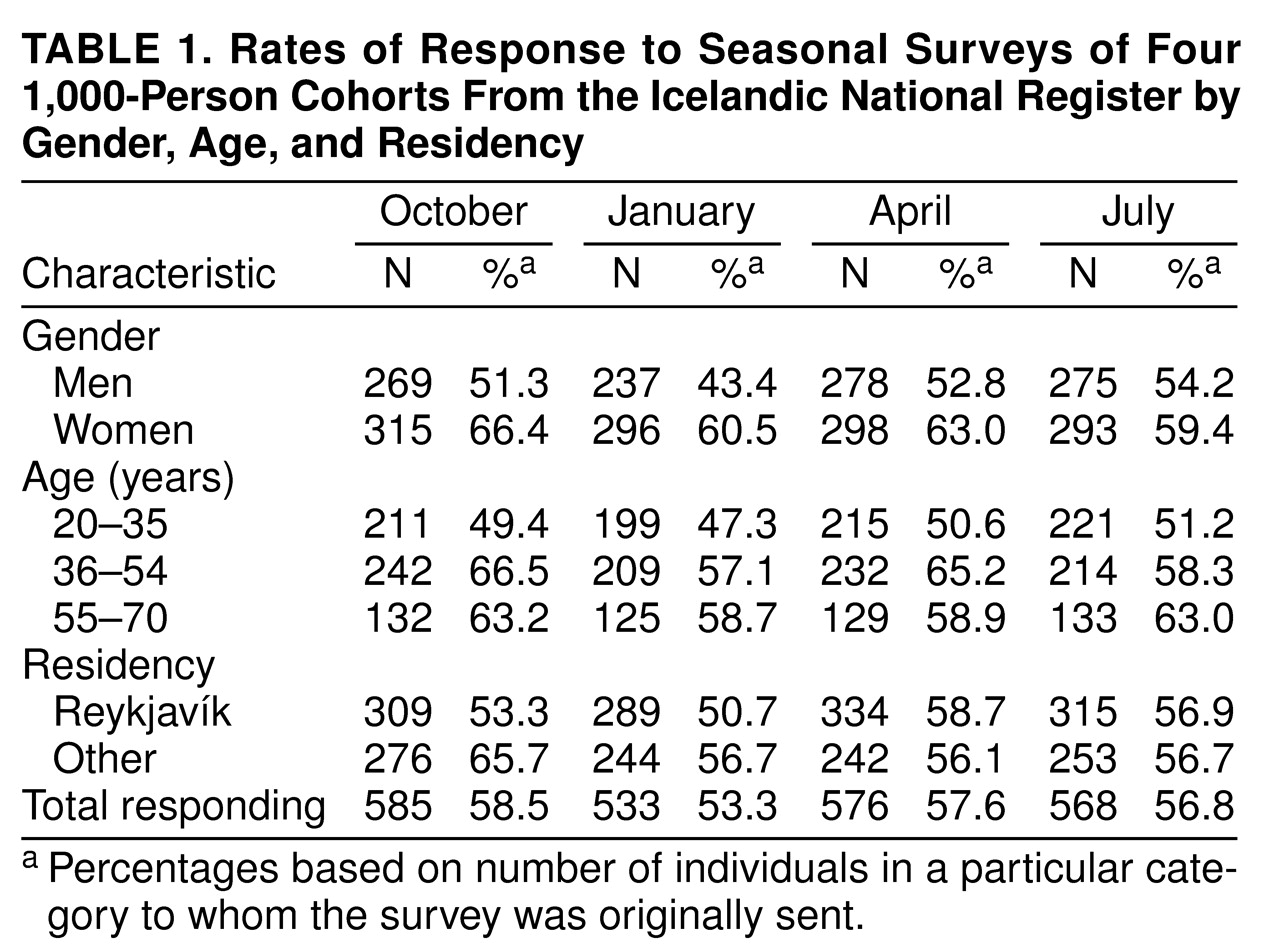
Sixty-one letters were returned unopened. In 29 instances the code number had been removed, which precluded further analysis. Correcting for this, the total response rate was 57.8%. Questionnaires returned later than 4 weeks after the first mailing and questionnaires with less than four items answered for either anxiety or depression were excluded. Thus, a total of 2,262 (56.5%) questionnaires were included in the analysis (
table 1).
There were no significant differences in response rates across seasons for either the total sample or within groups. However, across all four mailings the response rate of the youngest group was lower than that of the oldest group (49.6% versus 60.9%; χ2=34, df=1, p<0.001). Response rates were also lower for men than for women (50.4% versus 62.3%; χ2=45, df=1, p<0.001). The response rate of subjects in the Reykjavík area was marginally lower than that of subjects in rural areas (54.9% versus 58.8%; χ2=4.6, df=1, p<0.03).
Seasonal Variations
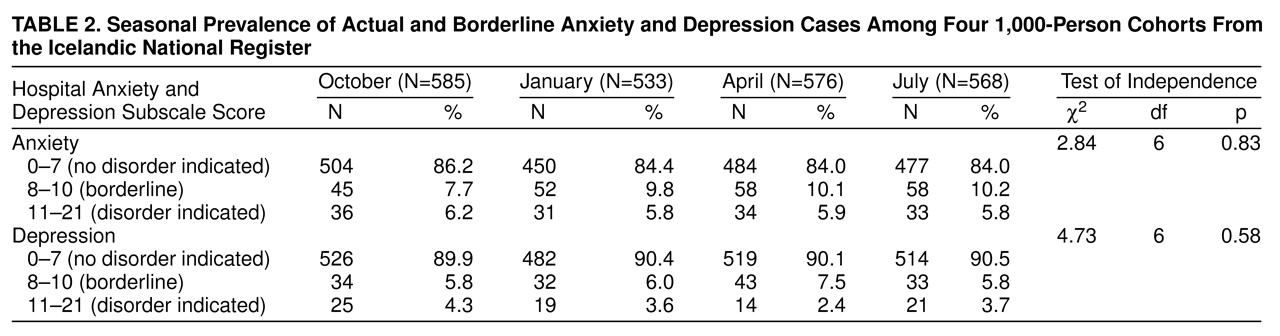
Table 2 shows the pattern of caseness. The rates of anxiety or depression did not show a statistically significant difference between winter and summer, either for actual cases, borderline cases, or for the two categories combined. Covariance analyses of Hospital Anxiety and Depression Scale scores showed 1) a nonsignificant gender effect for anxiety and depression, 2) anxiety scores were higher in the youngest age group (F=104.86, df=1, 2260, p<0.001), and 3) the depression scores were higher in the oldest age group (F=43.8, df=1, 2260, p<0.001) and in the rural population (F=19.1, df=1, 2260, p<0.001).
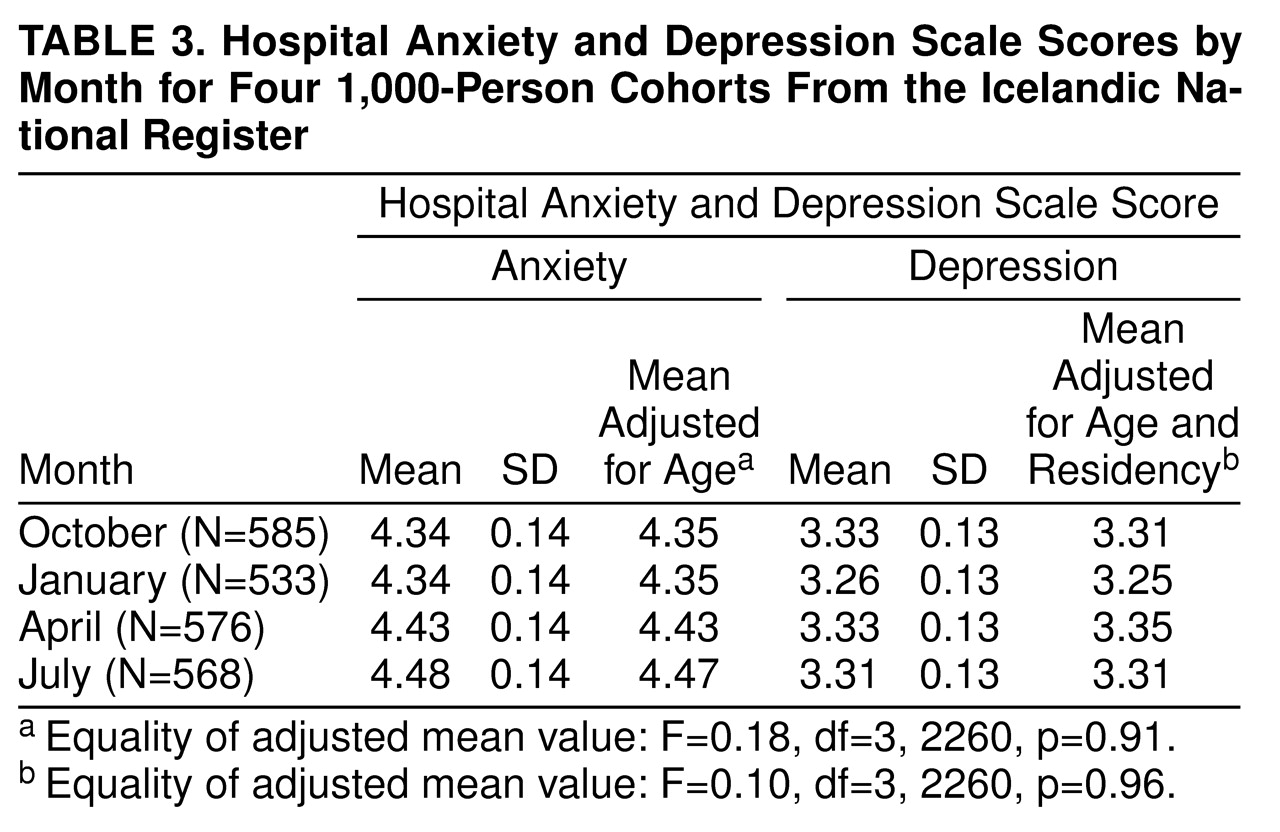
The average Hospital Anxiety and Depression Scale score for each season is shown in
table 3. The mean scores in winter were not higher than those in summer. In fact, after correcting for age and residency (urban versus rural), the only statistically significant difference in mean scores across seasons was that the depression scores in January were lower than those in all other seasons combined. However, this did not remain statistically significant after correcting for multiple tests. We examined specifically whether the youngest age group (20–35 years) had more seasonal variations than the older age groups. Even in this age group, the mean anxiety and depression scores in winter were not higher than those in summer (anxiety: 5.02 in January and 5.34 in July; depression: 2.48 in January and 2.94 in July).
This study would have had a 90% chance of detecting a significant (p<0.05) difference if the real underlying difference in mean scores between summer and winter had been more than 10% for anxiety and 12% for depression.
DISCUSSION
The absence of seasonal anxiety and depression found in the present study contrasts markedly with similar studies from other countries.
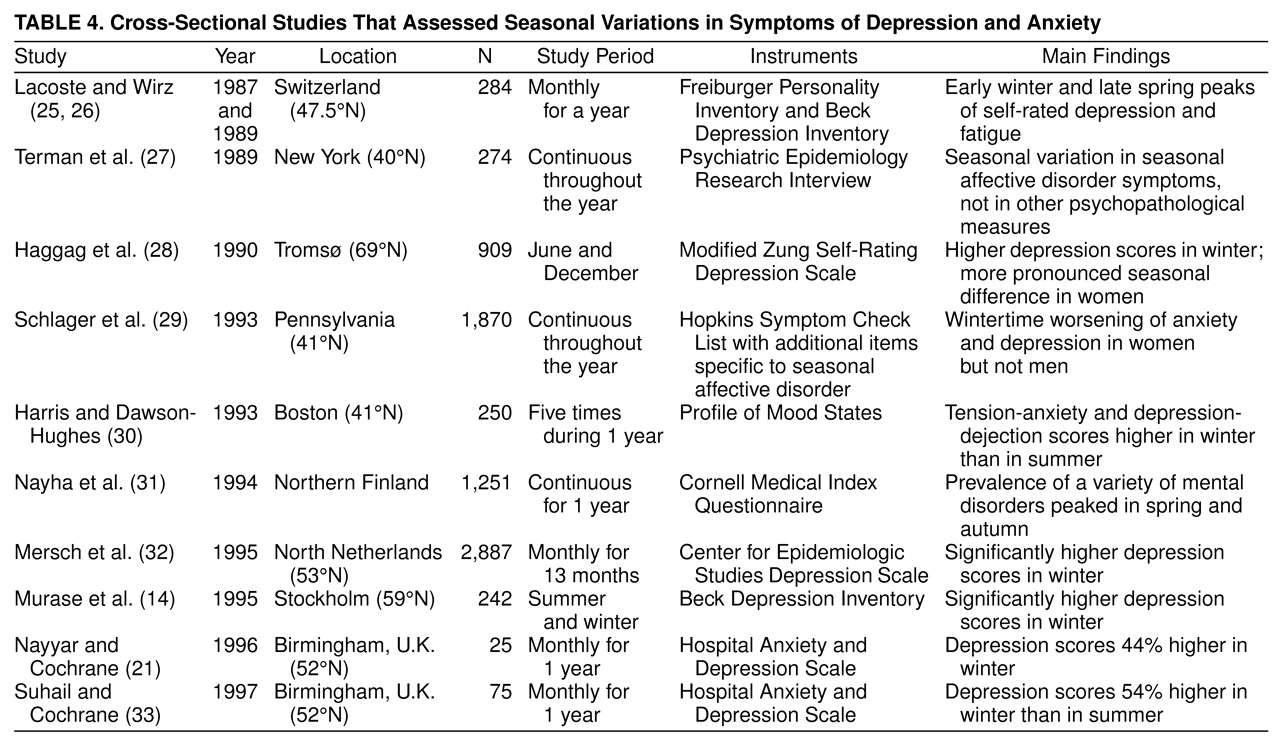
We are aware of 10 studies that have measured mental symptoms sequentially through the year. All had found seasonal variations with a peak for depression or anxiety in autumn or winter (
table 4). The pattern was complex in a few of these studies, but the general trend was quite consistent. Mersch and collaborators
(32) mailed the Center for Epidemiologic Studies Depression Scale to a random sample in the Netherlands at different parts of the year. The average depression score was 8.5 in June and 12.4 in December. Murase and colleagues
(14) had 242 Japanese who were residing in Stockholm fill out the Beck Depression Inventory in summer and winter. The scores were 65% higher in winter than in summer. In the United States, Harris and Dawson-Hughes
(30) found 28% and 16% higher scores in winter than in summer for anxiety and depression, respectively. Two of the studies listed in
table 4 used the same questionnaires as the present study
(21,
33). Furthermore, they were postal surveys with very similar study designs as ours. Both of these studies found higher depressive symptom scores in winter. Thus, our cross-sectional study is one of the few studies that finds no seasonal variations in either anxiety or depression, although it had many more participants than most, as shown in
table 4. It is remarkable that all of the studies listed in
table 4 find seasonal variations in mood even though they use a wide variety of instruments and different study designs.
This report is not a direct study of seasonal affective disorder but rather of seasonal mood variations. However, it is tempting to compare our results with those from a previous survey of seasonal affective disorder in the Icelandic population that used the Seasonal Pattern Assessment Questionnaire
(11). That study found that Icelanders exhibit seasonal affective disorder and subsyndromal seasonal affective disorder, albeit at prevalences that were unexpectedly low given Iceland’s high latitude. By contrast, the present study, which was based upon much shorter recall periods than those of studies that used the Seasonal Pattern Assessment Questionnaire, detected no seasonal variations in anxiety and depression whatsoever in this population.
This discrepancy may have several explanations, such as the long-term recall bias toward magnifying symptoms
(21) and the possibility of populations being artificially sensitized by the media to particular symptoms or disorders, such as seasonal affective disorder
(34).
The low or even absent seasonality of depression is puzzling in itself and may reflect some unique features of the Icelandic population, possibly genetic in nature
(10,
11,
35).
To address these issues a study that is longitudinally following a defined cohort, focusing on seasonal affective disorder, and using both the Hospital Anxiety and Depression Scale and the Seasonal Pattern Assessment Questionnaire is now in progress.