With advancing age, an increasing proportion of older (>40 years) subjects with Down’s syndrome shows a pattern of cognitive decline similar to that observed in patients with Alzheimer’s disease. Initially, there is a slowly progressive memory decline, followed by a linear decline in nonmemory cognitive function with accompanying dementia
(1–
3). Prevalence of dementia in Down’s syndrome subjects has been estimated to reach about 5%–10% up to the fifth decade of life and about 40%–50% by the sixth decade of life
(1,
4). Postmortem studies show that subjects with Down’s syndrome can exhibit significant amyloid deposition in the cerebral cortex by their third or fourth decade of life
(5,
6). At 40 years of age, these studies have shown that virtually all Down’s syndrome subjects have neuropathological lesions that meet the pathological criteria for Alzheimer’s disease
(7–
9). Earliest pathological changes are thought to occur in the medial temporal lobe, after which they are found in neocortical association regions by the age of 40
(10–
13). The laminar and regional cortical distribution of amyloid and neurofibrillary pathology closely resembles that of Alzheimer’s disease, rendering Down’s syndrome a model to study the prodromal stages of Alzheimer’s disease
(14).
Magnetic resonance imaging (MRI)-based measurement of regional brain atrophy can provide an in vivo estimate of neuronal and axonal loss in neurodegenerative disease. In particular, hippocampal atrophy has been established as a measure of allocortical neuronal loss in Alzheimer’s disease
(15–
17). The origin of corpus callosum fibers from layer III and V pyramidal neurons in the cerebral hemispheres, and studies using MRI, suggest that corpus callosum atrophy can be a marker of neocortical neuronal degeneration in Alzheimer’s disease
(18–
23). Several computer-assisted tomography and MRI studies have reported significantly reduced volumes of the hippocampus and adjacent medial temporal lobe structures with advancing age in nondemented subjects with Down’s syndrome
(24–
26), consistent with early allocortical pathological changes and memory loss. Other studies, however, failed to show a significant correlation between hippocampal volume and age in these subjects
(27,
28). The most consistent age-related finding in Down’s syndrome subjects outside of the medial temporal lobe in cross-sectional studies was an increase of ventricular volume with age in nondemented elderly subjects with Down’s syndrome
(24,
29). Age-related total brain and gray matter atrophy, however, was not detected before the onset of dementia
(2,
24,
27,
30,
31). Age-related changes in corpus callosum size in Down’s syndrome subjects have not been studied.
In the current study, we determined with MRI regional corpus callosum area and hippocampal volume in nondemented subjects with adult Down’s syndrome and age- and gender-matched healthy comparison subjects. We hypothesized that both corpus callosum areas and hippocampal volume would be reduced in Down’s syndrome subjects with advancing age, reflecting early Alzheimer’s disease-type neuropathology. We compared the degree of age-related decrease of corpus callosum and hippocampal size, using a previously established statistical model based on receiver operating characteristic curve analysis
(32). This comparison is based on the notion that corpus callosum and hippocampal atrophy reflect neocortical and allocortical Alzheimer’s disease-type neuropathology, respectively. In addition, we investigated correlations between neuropsychological measures of global and domain-specific cognitive performance and corpus callosum size. This study elucidates neocortical and allocortical morphological changes in the predementia stages of Alzheimer’s disease-type neuropathology in Down’s syndrome.
Method
Subjects
Thirty-four subjects with Down’s syndrome (trisomy 21 ascertained through karyotyping) and 31 healthy comparison subjects underwent MRI scans. The ages of the Down’s syndrome and comparison groups were similar (mean=41.6 years [SD=9.1, range=25.3–62.5] and 41.8 years [SD=10.8, range=26.2–64.5], respectively; t=0.08, df=63, p=0.94, two-tailed t test). Gender distributions were similar: 17 women and 17 men in the Down’s syndrome group and 14 women and 17 men in the comparison group (Pearson χ
2=0.15, df=1, p=0.70). Hippocampal data from all subjects have been published previously
(26).
To compare age effects on corpus callosum areas and hippocampal volumes, the Down’s syndrome group was divided into a young (<40 years) Down’s syndrome group (N=19, nine women and 10 men; mean age=34.9 years [SD=4.0]) and an old (>40 years) Down’s syndrome group (N=15, eight women and seven men; mean age=50.2 years [SD=5.8]). Both groups were not different in terms of gender distribution (Pearson χ
2=0.1, df=1, p=0.73) or total intracranial volume (two-tailed t test: t=1.5, df=32, p=0.15). As expected, the groups differed in age (two-tailed t test: t=–9.2, df=32, p<0.001). Overall cognitive ability had been assessed by using the Peabody Picture Vocabulary Test, Revised
(33). Mean test age in the Peabody Picture Vocabulary Test was 6.4 years (SD=3.0) in the young and 4.2 years (SD=2.7) in the old subjects.
All of the Down’s syndrome and comparison subjects underwent medical, neurological, and psychiatric evaluations according to published criteria
(34); the assessment included a structured examination to exclude extrapyramidal diseases
(35). All subjects had Hachinski scale
(36) ischemia scores <5. No subject had a history of significant head trauma, toxin exposure, diabetes, or drug or alcohol abuse. Psychiatric disorders were diagnosed in four subjects with Down’s syndrome: two had obsessive-compulsive disorder, and two had psychotic disorder not otherwise specified. Twelve Down’s syndrome subjects had hypothyroidism treated with levothyroxine, and all 12 had levels of thyroid-stimulating hormone in the normal range. Normal results were observed in all subjects following urinalysis; blood measurements of electrolytes, glucose, minerals, lipids, folate, vitamin B
12, antinuclear antibody, and rheumatoid factor; liver, renal, and thyroid function tests; and tests for HIV and syphilis. Several of the subjects with Down’s syndrome had functional heart murmurs, and subjects who had not previously been evaluated for valvular heart disease were evaluated with echocardiograms as part of our study. A clinical screening evaluation of the MRI, performed independently of the volumetric analyses, showed no evidence of stroke, tumor, or mass effect.
Subjects with dementia were excluded from this study. The exclusion of dementia in Down’s syndrome was made by using modified criteria from DSM-III, which specified an acquired, progressive loss of intellectual function such as loss of daily living and vocational skills, memory impairment, reduced speech and comprehension, and personality change. The diagnosis was based on interviews with caregivers, clinical examination, and bedside mental status tests that used standardized criteria
(37). Diagnoses were made independently of results of neuropsychological testing and MRI and discussed to consensus by a team of neurologists, psychiatrists, and neuropsychologists experienced in the diagnosis of dementia in Down’s syndrome. Interrater reliability for our method of diagnosis of dementia in Down’s syndrome has been previously established
(30).
After describing the study to each subject or to the holder of a durable power of attorney or legal guardian, written informed consent was obtained. Assent to participate in the study also was obtained from the subjects with Down’s syndrome. The research was approved by the National Institute on Aging Institutional Review Board.
MRI
MRI of the brain was performed on a 0.5-T scanner (Picker Instruments, Cleveland) and on a 1.5-T scanner (General Electric Signa II, Milwaukee). Total intracranial volume was measured from 6-mm-thick contiguous coronal slices (TR/TE=2000/20 msec, flip angle=45°, field of view=25 cm, matrix=256×160) obtained perpendicular to the inferior orbitomeatal line on the 0.5-T scanner. Hippocampal volumes were measured on 5-mm-thick contiguous oblique T1-weighted slices (15 slices, TR/TE=530/20 msec, flip angle=90°, field of view=16 cm, matrix=256×256) obtained perpendicular to the Sylvian fissure, as ascertained through sagittal scout slices and encompassing only the temporal lobe from its anterior pole to the end of the lateral sulcus, on the 1.5-T scanner. Several Down’s syndrome subjects could not complete MRI investigations while awake and thus underwent the scan with intravenous sedation while under the care of an anesthesiologist. Corpus callosum areas were determined from volumetric T1 weighted scans obtained on the 0.5-T scanner (sagittal orientation, slice thickness=2 mm, in-plane resolution=1 mm×1 mm, TR/TE=20/6 msec, flip angle=45°) in 17 Down’s syndrome and 17 comparison subjects and on the 1.5-T scanner (coronal orientation, slice thickness=2 mm, in-plane resolution=0.94 mm×0.94 mm) in 17 Down’s syndrome and 14 comparison subjects. The latter sequence was reoriented in the sagittal plane by using trilinear interpolation.
Hippocampus and Corpus Callosum Measurement
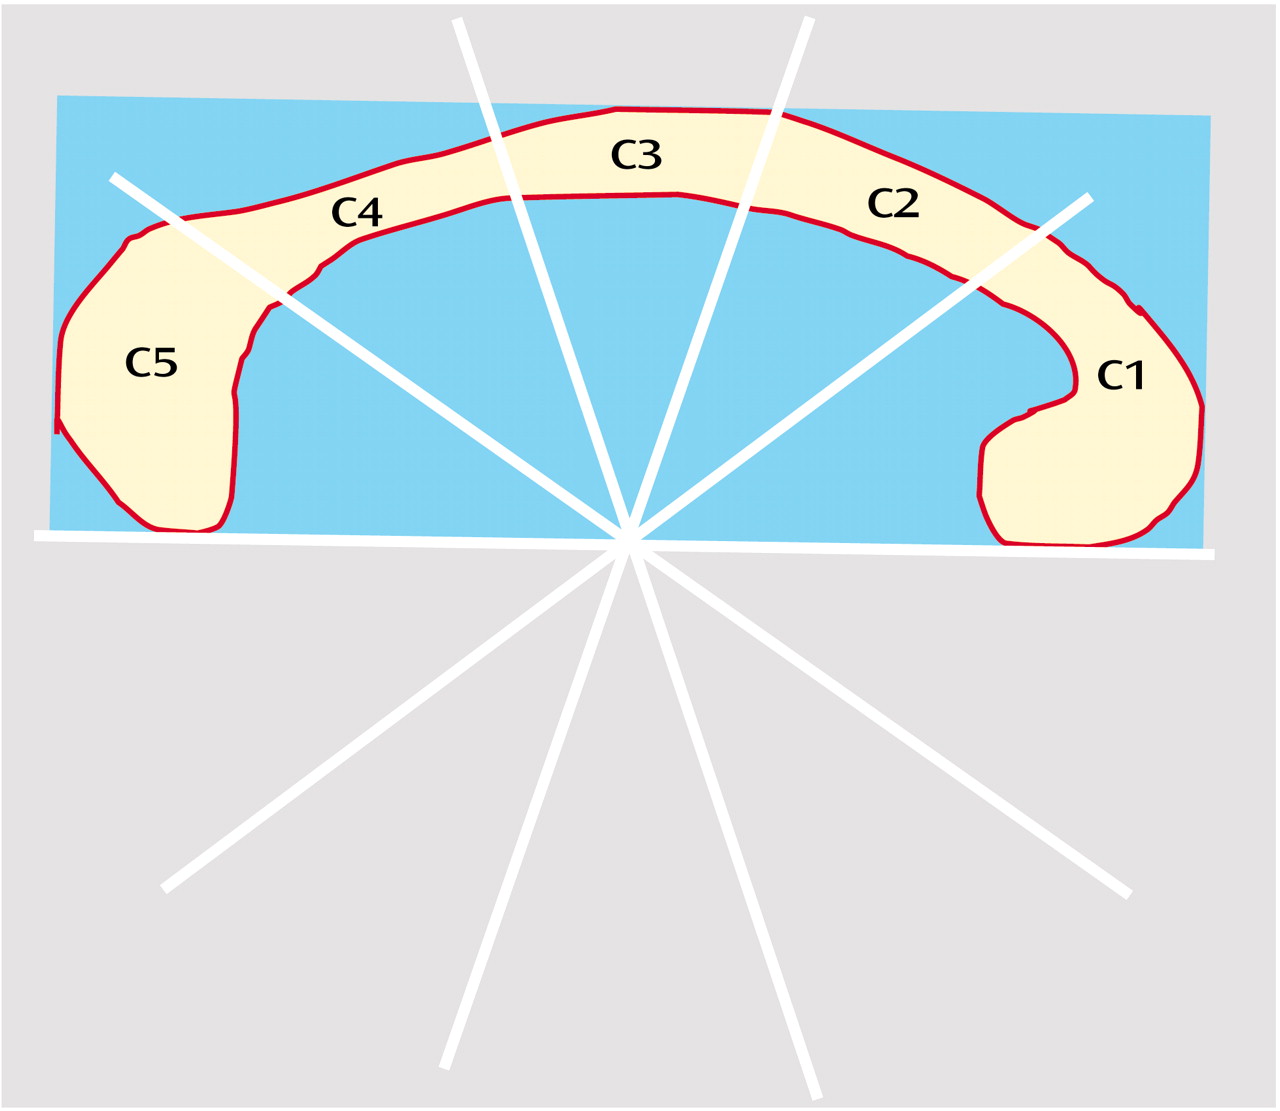
Areas of the corpus callosum and of five callosal subregions were measured in the midsagittal slice of the three-dimensional MRI by using ANALYZE software (Biomedical Imaging Resource, Mayo Foundation, Rochester, Minn.) on a workstation (Silicon Graphics, Palo Alto, Calif.), as described elsewhere
(38) (
Figure 1).
Briefly, total callosal area was obtained by manually tracing the outer edge of the corpus callosum on the midsagittal slice. Subsequently, areas of five callosal subregions were defined by using a simple geometrical construction. Subregions were labeled C1 to C5 in the rostral-occipital direction. Region C1 covers the rostrum and genu; regions C2–C4 the anterior, middle, and posterior truncus, respectively (region C4 also contained the isthmus); and region C5 the splenium. The number of pixels within each region was summed and multiplied by pixel size to obtain absolute values (mm2) for the measured areas.
Left and right hippocampal formations were traced according to the method of Watson et al.
(39) using a workstation (Sun Microsystems, Mountain View, Calif.) with a high-resolution monitor and established tracing software
(40,
41), as previously described
(26). The volume, in cubic centimeters, was calculated by summing the areas (in square centimeters) of the regions of interest across slices and multiplying by slice thickness. One investigator (C.H.) measured the corpus callosum, and one investigator (J.S.K.) measured the hippocampus. Both were blind to subject group, age, gender, and cognitive status.
The intraclass correlation coefficient for interrater reliability (determined from 10 scans measured by two independent researchers) ranged from 0.98 for total corpus callosum area and subregions C1 and C2, to 0.95 for region C3. The intraclass correlation coefficient for intrarater reliability (determined from 10 scans measured twice by the same researcher, blind to scan identity) was 0.98 for total corpus callosum area
(21). The intraclass correlation coefficient for intrarater reliability was 0.96 for hippocampus volumes
(42).
Cognitive Assessment
All Down’s syndrome subjects underwent extensive neuropsychological testing; the applied tests are described in more detail elsewhere
(3). From these tests, we identified a subset of tests that had shown significant differences between young and old Down’s syndrome subjects in a previous study
(3). These were the subtests of the Down Syndrome Mental Status Examination, a range of memory tests and the extended block design test. Since the main focus was not on memory tests (which had been studied before and were hypothesized to primarily correlate with hippocampal but not corpus callosum measurements
[26]) and in order to reduce the number of statistical tests, we selected only the Down Syndrome Mental Status Examination and the extended block design test for correlation analyses with volumetric measures. Overall cognitive ability in the Down’s syndrome subjects was assessed with the Peabody Picture Vocabulary Test
(33).
The Peabody Picture Vocabulary Test is a test of word knowledge, in which the subject indicates a drawing that best depicts the meaning of a spoken word. It is regarded as a measure of verbal intelligence
(43) and spans both very low age ranges and levels of mental ability and levels considerably above average adult ability
(44). The Down Syndrome Mental Status Examination
(45,
46) tests for recall of personal information (name, age, birth date), orientation (day of the week, season of the year), immediate and delayed memory (identity of three objects and location of three hidden objects), language (confrontation naming, sentence repetition, comprehension of one-, two-, and three-step commands), visuospatial performance (three-dimensional block design) and praxis (transitive and intransitive limb movements, sequential task). The extended block design test
(46) is a two-dimensional construction test, derived from the WISC-R Block Design test
(47). The extended block design test has eight items and uses the same blocks as the WISC-R Block Design test. All tests were administered by trained psychometricians.
Statistical Analysis
Differences of hippocampal volumes and corpus callosum areas between Down’s syndrome and comparison subjects were determined by using analysis of covariance, with group as the between-subject factor and age and total intracranial volume as covariates.
To test for the effects of age while controlling for effects of gender and total intracranial volume, we performed linear regressions. Because total intracranial volume and gender were highly collinear within both groups (with larger total intracranial volumes seen in male subjects), we used two separate multiple regression models with the regional volumes as dependent variables: one had gender entered first into the model, the other had total intracranial volume entered first; both were then followed by subject age.
Partial correlation coefficients on rank-transformed data were used to determine correlations between neuropsychological scores and regional volumes while we controlled for the effect of total intracranial volume.
We used binary logistic regression to determine the odds ratios of hippocampal volume and corpus callosum area classifying Down’s syndrome patients as belonging to the young or old Down’s syndrome group. Data were rank transformed to accommodate differences in metrics and variances between hippocampus and corpus callosum measures. Comparing the odds ratios between different measures allows determining differences in classification accuracy between regions. Classification accuracy, on the other hand, is directly related to the degree of atrophy of the specified regions. Additionally, we used analysis of areas under receiver operating characteristic curves, with age group (young Down’s syndrome versus old Down’s syndrome groups) as a dependent variable. As previously described
(32), the area under the receiver operating characteristic curve can serve as a measure of the degree of atrophy and can be directly compared between different regions.
Statistical analyses were conducted by using SPSS for Windows Version 11.0 (Chicago). The statistical significance threshold was set at p<0.05.
Results
As shown in
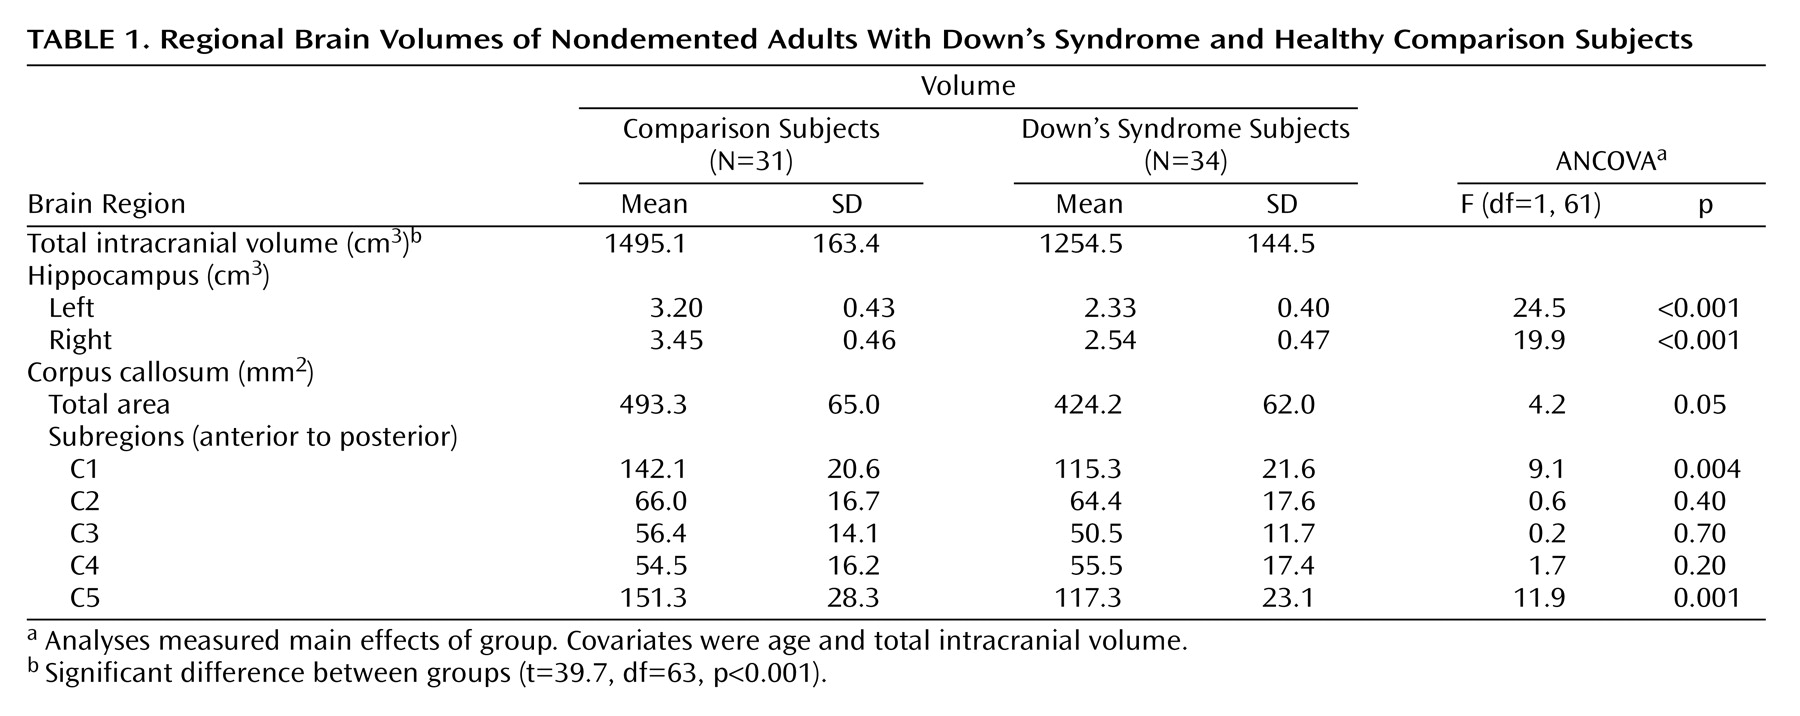
Table 1, there were significant differences between the Down’s syndrome and comparison groups in bilateral hippocampal volumes and in the total, anterior (C1), and posterior (C5) corpus callosum areas after total intracranial volume and age were controlled. Total intracranial volume differed significantly between groups but was not correlated with age in the comparison (r=0.13, df=29, p=0.46) or Down’s syndrome (r=0.17, df=29, p=0.35) groups.
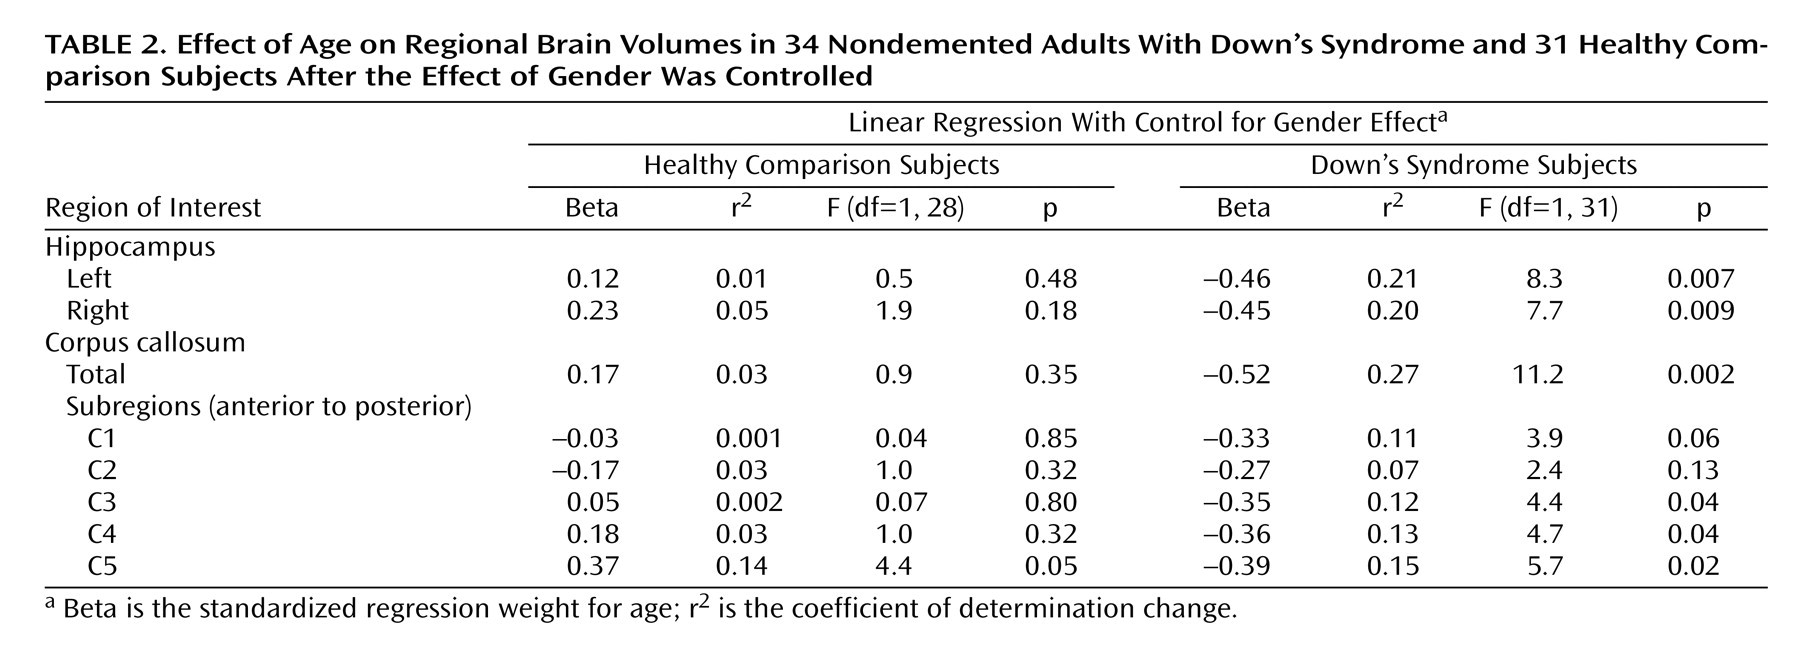
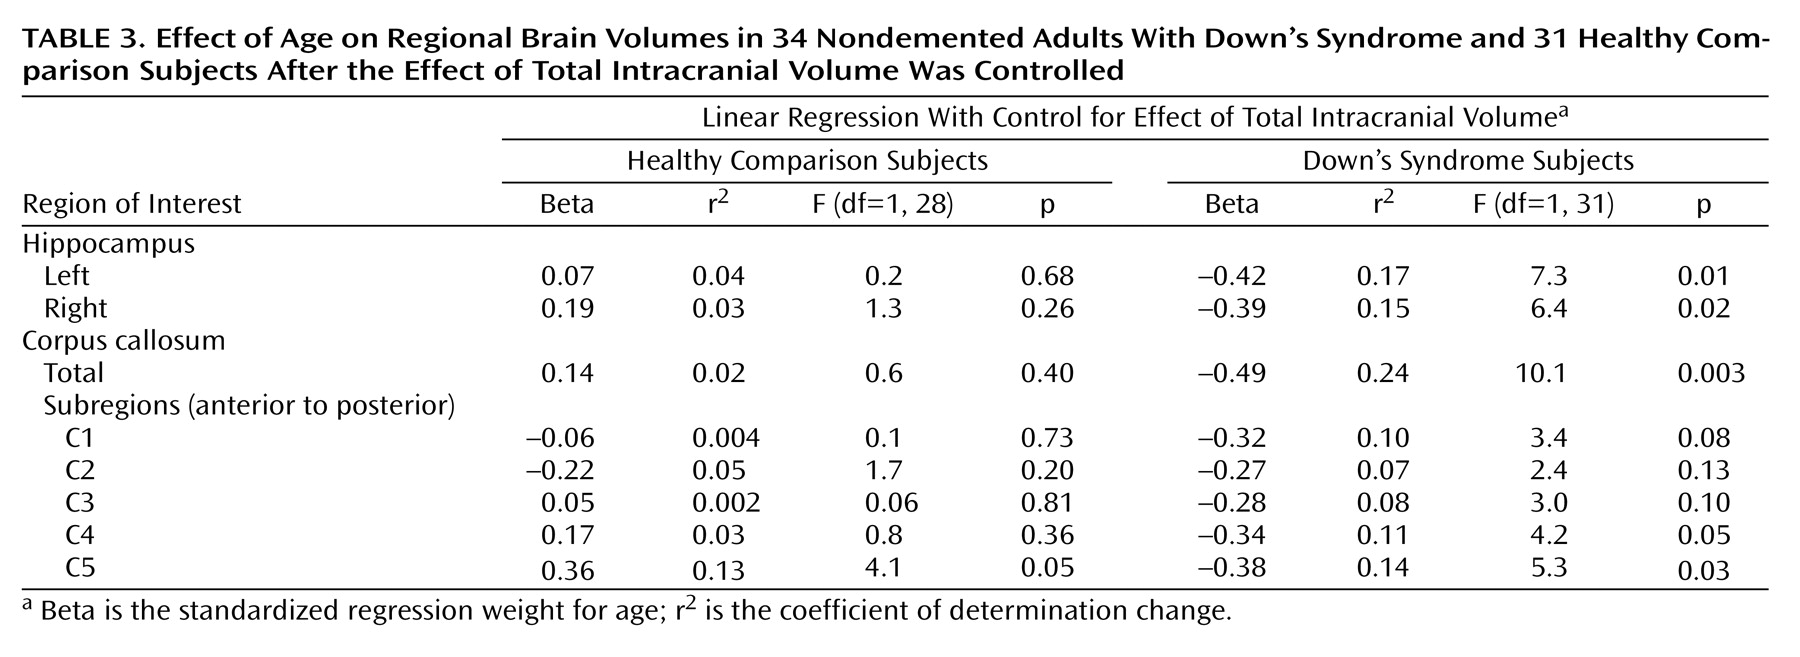
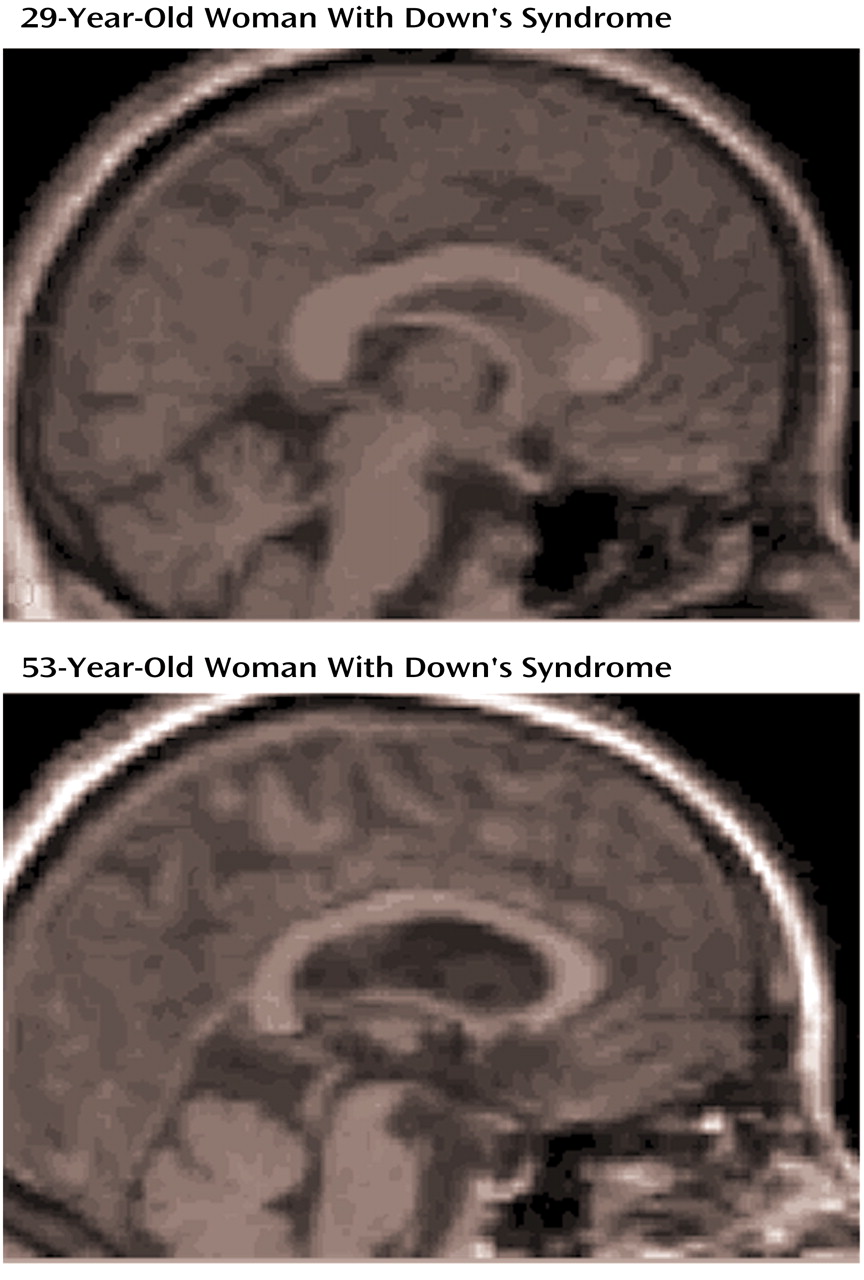
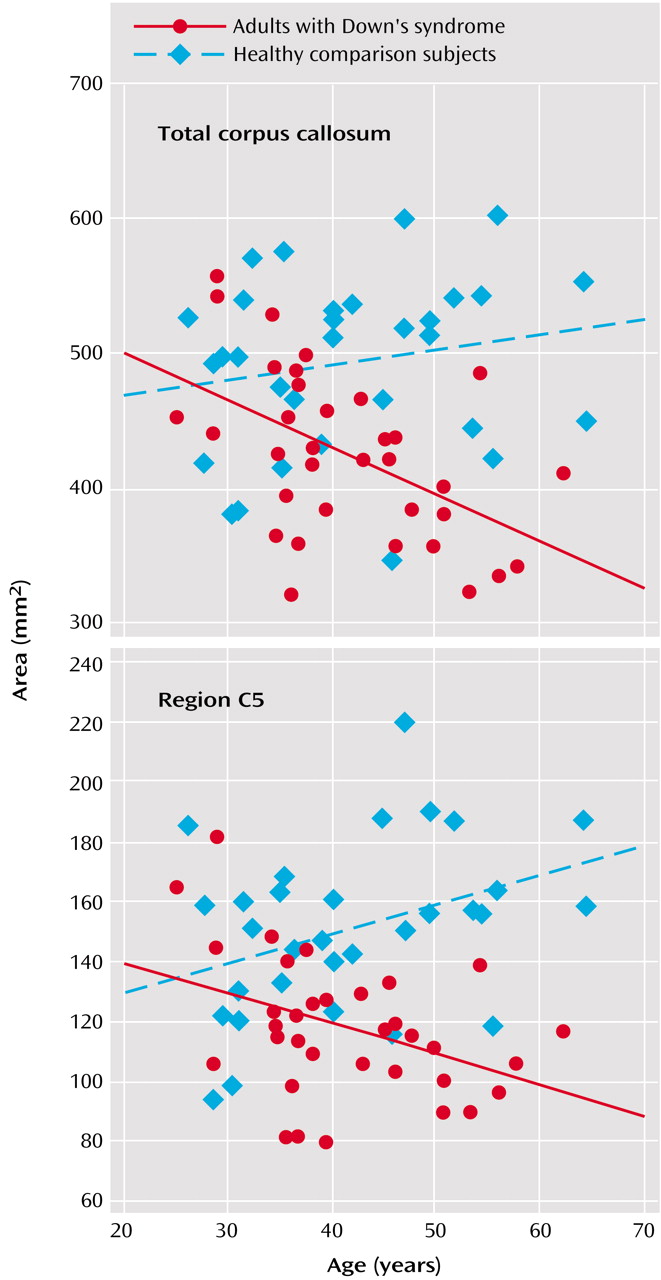
Figure 2 illustrates corpus callosum shape in a young and an old Down’s syndrome subject. In the Down’s syndrome group, there was a significant effect of age on bilateral hippocampal volumes and total corpus callosum area after gender and total intracranial volumes were controlled. Age effects were predominant in posterior corpus callosum subregions (C3 to C5) (
Table 2,
Table 3,
Figure 3). In the comparison group, the only effect of age on a volumetric measure was an increase of posterior corpus callosum area with increasing age (area C5).
A binary logistic regression model was used to compare the extent of atrophy in the hippocampus and corpus callosum. Odds ratios were derived for each volumetric measure to classify Down’s syndrome subjects as belonging to the young or the old group. Odds ratios were 0.90 for reduced left hippocampal volume (95% confidence interval [CI]=0.83–0.98), 0.91 for reduced right hippocampal volume (95% CI=0.84–0.99), and 0.91 for reduced total corpus callosum area (95% CI=0.84–0.99). In accordance with these findings, areas under receiver operating characteristic curves, classifying Down’s syndrome subjects into the young and old Down’s syndrome groups, were nearly identical between bilateral hippocampus and total corpus callosum (left hippocampus: 0.76 [95% CI=0.59–0.92]; right hippocampus: 0.74 [95% CI=0.57–0.91]; total corpus callosum: 0.74 [95% CI=0.57–0.91]). Odds ratios and area under the receiver operating characteristic curves for corpus callosum subregions were not significantly different from random classification.
When total intracranial volume was controlled by using partial correlation, there were significant correlations between area C3 and total Down Syndrome Mental Status Examination (r=0.37, p<0.05), as well as language (r=0.46, p<0.05), and orientation (r=0.37, p<0.05) subscores. C4 area was significantly correlated with total Down Syndrome Mental Status Examination score (r=0.46, p<0.05), as well as language (r=0.41, p<0.05), orientation (r=0.52, p<0.01), visuospatial (r=0.54, p<0.01) and memory (r=0.42, p<0.05) subscores and the extended block design test (r=0.41, p<0.05). There were no other significant correlations between corpus callosum areas and neuropsychological scores.
Discussion
We used MRI to investigate age-related decreases of corpus callosum and hippocampal size in nondemented adult subjects with Down’s syndrome and in healthy age- and gender-matched comparison subjects. As previously reported
(26), Down’s syndrome subjects showed a significant correlation between hippocampus volume and age. We now report correlations between age and corpus callosum areas, most prominent in posterior subregions, in the Down’s syndrome subjects. The age-related decrease of corpus callosum area was comparable to the decrease of hippocampal volume. In contrast, there was no age effect on volumetric measures in the comparison subjects except for increased posterior corpus callosum area C5 with advancing age. These results indicate that neocortical association neurons, whose fibers are represented in the corpus callosum, are lost or otherwise abnormal in the predementia stage of Down’s syndrome. These changes are accompanied by evidence of allocortical neuronal degeneration, suggested by the age-related decrease of hippocampal volumes.
The Down’s syndrome subjects had significantly smaller hippocampal volumes and corpus callosum areas (particularly anterior and posterior) than the comparison subjects, even after intracranial volume and age were controlled. These findings agree with evidence of significant reductions of hippocampus and cerebral gray matter volumes as well as with differences in corpus callosum size and shape in Down’s syndrome subjects younger than 25 years
(48–
51). Therefore, age-related decrease of the corpus callosum and hippocampus in adult nondemented Down’s syndrome subjects appears to be superimposed on initial developmental changes in these structures.
Consistent with earlier imaging studies
(24,
25), we found reduced hippocampal volumes in nondemented Down’s syndrome subjects with advancing age. In clinicopathological studies, MRI-determined hippocampal volume accounted for about 80% of variability of hippocampal neuron density in Alzheimer’s disease
(15–
17). Therefore, consistent with neuropathological studies
(10), our findings suggest an early loss of allocortical neurons caused by Alzheimer’s disease-type neuropathology in the predementia stage of Down’s syndrome.
Corpus callosum atrophy has been suggested as a putative marker for the loss of intracortical-projecting neocortical association neurons in Alzheimer’s disease. The callosally projecting neurons belong to a subset of the large pyramidal neurons in lamina III and V of the association cortex
(52–
54), which are highly susceptible to Alzheimer’s disease degeneration
(55–
57). In agreement with the early involvement of these neurons, several MRI studies have reported corpus callosum atrophy in Alzheimer’s disease that was correlated with PET and EEG measures of neocortical dysfunction but independent of primary subcortical fiber degeneration
(18–
20,
22,
23,
38,
58). Age-related reductions of corpus callosum areas, predominant in posterior regions, in our Down’s syndrome subjects are comparable with reductions noted in Alzheimer’s disease patients
(18).
The posterior corpus callosum contains axonal projections from posterior temporal, parietal, and occipital association cortical areas
(59–
62). This agrees with evidence
(63) that reduced gray matter volumes in the posterior cerebrum correlated with neuritic plaques and neurofibrillary tangles in elderly Down’s syndrome subjects. Therefore, age-related decrease of corpus callosum in nondemented subjects with Down’s syndrome (without cerebrovascular risk factors and in the absence of MRI signs of primary subcortical fiber degeneration) most likely represents involvement of neocortical association neurons by Alzheimer’s disease-type pathology. Size of corpus callosum areas C3 and C4 was correlated with overall cognitive performance and performance in orientation, language, and visuospatial tests in the Down’s syndrome subjects. Areas C3 and C4 contain fibers from posterior temporal and from parietal lobes
(59,
62). These data, although limited because of the small study group size, support the notion that the age-related decrease of corpus callosum size in Down’s syndrome reflects loss of neocortical neuronal projections involved in the maintenance of higher cognitive processes.
In an earlier study, we compared the extent of corpus callosum and hippocampal atrophy in Alzheimer’s disease patients
(32). We had found that patients in mild stages of Alzheimer’s disease already exhibited posterior corpus callosum atrophy to a similar degree as hippocampal atrophy. The current study extends these findings into the predementia stage of Alzheimer’s disease-type pathology. We used a statistical approach based on the analysis of areas under the receiver operating characteristic curves
(64) and odds ratios based on logistic regression analysis to determine statistical differences between the age effects on the corpus callosum and the age effects on the hippocampus. Age effects were not different between the corpus callosum and the hippocampus in the Down’s syndrome subjects. This finding suggests that neocortical neuronal alterations are comparable to those in the allocortex in the predementia stage of Down’s syndrome.
There are several potential mechanisms that might account for the correlation between age and corpus callosum size in Down’s syndrome. One is that corpus callosum development is different from normal in Down’s syndrome. Another is that corpus callosum morphology changes with age because of Down’s syndrome-specific mechanisms of neurodegeneration distinct from those of Alzheimer’s disease. A third is that corpus callosum morphology changes with age because of Alzheimer’s disease-type pathological processes.
The first mechanism most likely would not lead to an overestimation of age effects within a Down’s syndrome group. Rather, developmental abnormalities would increase variability of corpus callosum shape across subjects, thereby reducing the sensitivity of the study to detect age-related effects. This may contribute to the finding that there was no significant age effect on anterior corpus callosum, the subregion that is most affected by the developmental abnormality in Down’s syndrome
(51).
In contrast, the second and third mechanisms cannot be distinguished from each other on the basis of this study. The resemblance between Down’s syndrome and Alzheimer’s disease neuropathology is close, but not perfect. In 1995 Hof et al.
(10) reported that plaque density was higher in many Down’s syndrome subjects compared with Alzheimer’s disease patients and more widely distributed throughout the cortex. Additionally, several studies suggest cytoskeletal abnormalities in Down’s syndrome
(65) and overexpression of proteins other than amyloid that may contribute to neurodegeneration
(66,
67). Therefore, it cannot be excluded that part of the strong age effect on corpus callosum in nondemented Down’s syndrome subjects is related to Down’s syndrome-specific degenerative processes.
We found an increase of posterior corpus callosum area C5 with age in the healthy comparison subjects. There is no final explanation for this finding. Several independent studies found smaller anterior corpus callosum areas with higher age but no correlation between age and posterior corpus callosum areas
(19,
68,
69). In 10 healthy subjects, followed with MRI over an average interval of 24 months, we found an average rate of atrophy of –0.9% per year for total corpus callosum and –1.6% per year for anterior corpus callosum area C1
(21). In contrast, average rate of atrophy for area C5 was 0.7%. On the basis of these earlier findings, there seems to be an age-related decrease of anterior, but not of posterior, corpus callosum in healthy subjects, and on average it may even be possible that there is a slight increase of the measured posterior corpus callosum area with age. These effects may represent changes in the shape of the corpus callosum, leading to an overestimation of posterior relative to anterior corpus callosum with higher age. To further support this interpretation, alternative techniques of corpus callosum measurement would have to be applied, such as deformation-based morphometry
(70,
71). In addition, a relatively larger posterior corpus callosum area has been found in women than in men
(71). This gender effect, however, cannot entirely explain the relative increase of C5 area with age in our subjects, since this effect remained significant after we controlled for gender in the linear model. Finally, there may be age-related changes in the fiber composition of the corpus callosum
(72). All or some of these effects may contribute to the finding of increased posterior corpus callosum with age in healthy subjects, but it will require future study to resolve this question.
In conclusion, our results suggest that with advancing age, neocortical neuronal alterations are profound in the predementia stage of Down’s syndrome and that they are comparable to those that occur in the hippocampus. If older nondemented adults with Down’s syndrome represent a model for the predementia stage of Alzheimer’s disease, our data suggest that neocortical neuronal degeneration will be present in this stage. Future longitudinal studies on morphological changes in Down’s syndrome and Alzheimer’s disease subjects should help to test these ideas.
