Schizophrenia has been associated with several cortical structural abnormalities. Specifically, ventricular enlargement
(1), reduced cortical volume
(2,
3), and structural abnormalities of the frontal cortex have been reported repeatedly (for a review, see Lewis and Jeffrey
[4]).
Because of its role in limbic functions, its significant dopaminergic innervation, and its role in development of human personality, we hypothesized that abnormalities in the prefrontal cortex (in particular the anterior cingulate cortex) might contribute to the pathology of schizophrenia. The anterior cingulate cortex has connections to both cortical and subcortical structures such as other parts of the prefrontal cortex, amygdala, thalamus, and the inferior parietal lobe. These connections enable the anterior cingulate cortex to bridge between the limbic structures and the frontal lobe and provide it with the capacity to integrate cognitive activity with affective experience
(5–
7).
Clinical studies of the anterior cingulate cortex in schizophrenia patients have reported abnormalities, including changed dopaminergic modulation during cognitive activity
(8), reduction in blood flow and metabolism weeks after neuroleptic withdrawal
(9,
10), and dysfunction and selective attention deficits during single-trial Stroop task in PET studies
(11). Abnormalities of the prefrontal cortex and especially the anterior cingulate cortex described in schizophrenia are consistent with the known functions of this cortical region in information processing, attention, and in the expression and modulation of emotion
(12,
13). Neuropathological studies have reported decreased neuronal density, abnormal spatial arrangement of neurons, and increased numbers of vertical association axons in the cingulate cortex of subjects with schizophrenia
(14). Benes et al.
(15) found the density of nonpyramidal neurons to be reduced by 16.2% in layer II of subjects with schizophrenia, with no difference in layers III through VI and no glial cell differences. Others have reported a reduction in glial cell density by 15%–20% and a neuronal volume reduction of 10%–15% in the anterior cingulate cortex of subjects with schizophrenia
(16,
17). A specific astroglial reduction has been located in the dorsolateral prefrontal cortex
(18). (For a review of microscopic neuropathology of schizophrenia, see Harrison
[19].)
Glial cells have been implicated in a broad variety of functions
(20), including cellular substrate for migration during CNS development
(21), ion homeostasis
(22), uptake of neurotransmitters
(23), and contribution to the CNS immune system and neuromodulation
(24).
For this study, we compared total cell numbers in two limbic prefrontal cortex subregions: Brodmann’s area 24, a part of the anterior cingulate cortex, and Brodmann’s area 32, a transitional region between the ventral agranular cingulate and the dorsal granular neocortex areas. Nissl staining is useful for counting neurons and glial cells, but it is not optimal for subpopulations of glial cells, wherefore subsampling was not performed. To our knowledge, this is the first report of glial cell quantification in Brodmann’s area 32 in patients with schizophrenia.
Method
Subjects
The brains from the comparison subjects were part of another repository collected from 1987 to 1991 from autopsied individuals following the Danish laws on autopsied human tissue. The Danish ethical committee for Copenhagen and Frederiksberg approved the study.
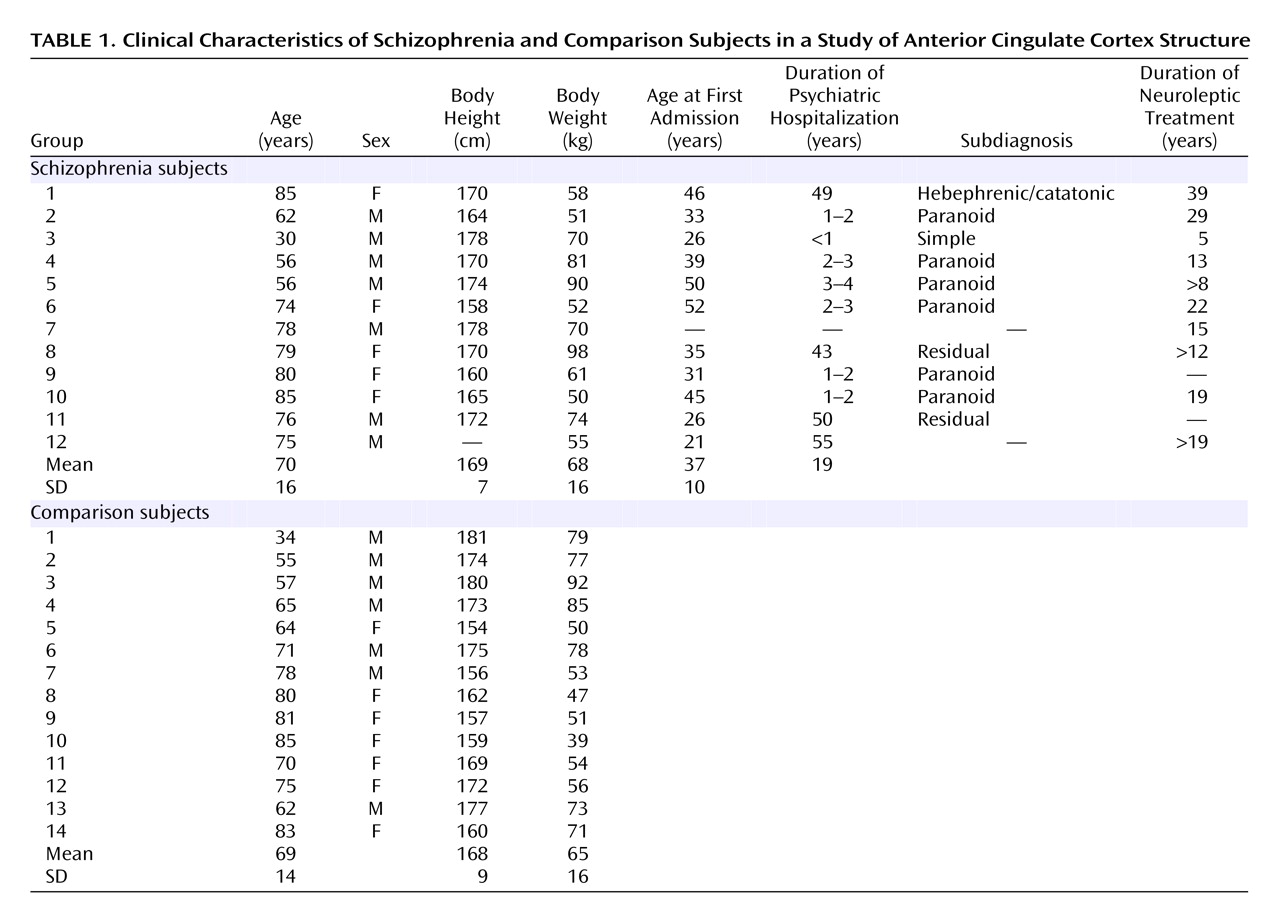
Table 1 shows demographic and clinical data for the schizophrenia and comparison subjects, and
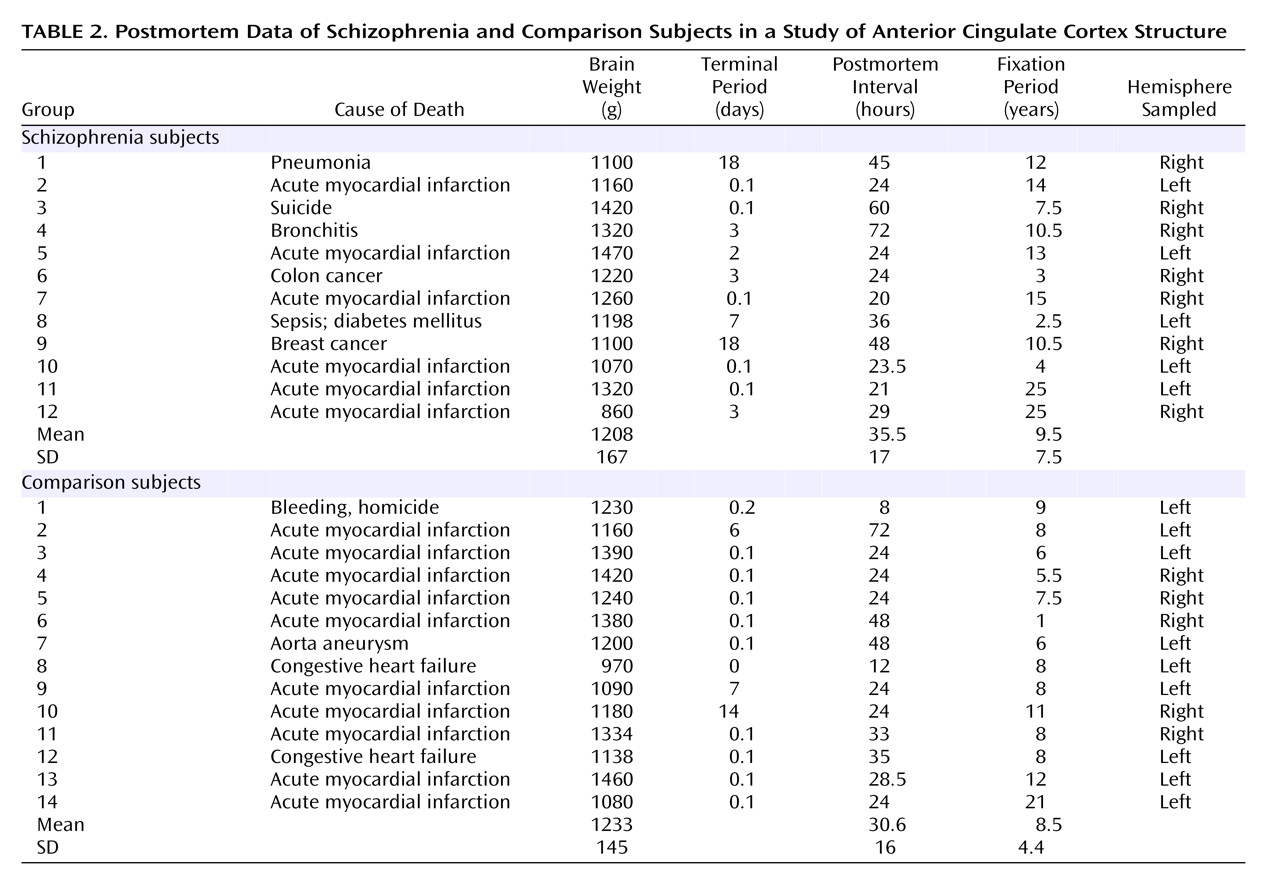
Table 2 shows postmortem data. No brains had evidence of degenerative brain disorders. The comparison brains came from 14 individuals who were free of neurological or psychiatric disorders. None of the subjects with schizophrenia or the comparison subjects had any history of head injury or substance abuse. The schizophrenia subjects fulfilled DSM-III criteria and belonged to a subpopulation of severely ill patients hospitalized for a substantial part of their lives and treated with neuroleptic treatment, insulin comas, or ECT. Furthermore, for both groups information about the patient’s prehospital life was obtained from either close relatives or the general practitioner, thus excluding all patients with any CNS symptoms. The tissue was fixed within 8–72 hours after death and kept in 4% formaldehyde buffered with phosphate.
Tissue Processing
The meninges were removed from the brains, the right or left hemisphere chosen according to level of artifacts, and the hemispheres cut frontally into slabs that were 2.5 cm thick. The slabs were dehydrated in a series of alcohol solutions of 50%, 70%, and 80% (12 hours in each) and in 99% alcohol, xylene, and regular paraffin solutions (24 hours in each). The paraffin-embedded slabs were sectioned exhaustively into 40-μm-thick sections and were then systematically subsampled at random, providing about 10 sections per case (ranging from 9 to 15) containing Brodmann’s area 24 and 32. These were adhered on object glasses pretreated with a gamma-aminopropyl-trithoxysilane and stained with a modified Giemsa stain
(25).
Cytoarchitectonic Delineation
Brodmann’s areas 24 and 32 were delineated by two independent investigators on coded slides, according to the cytoarchitectonic criteria specified in the following section. The interrater reliability of delineations was 95%–98%. An example of the transitional zone between areas 24 and 32 is shown in
Figure 1.
Brodmann’s area 24 occupies practically the entire extension of the cingulate gyrus, stretching from the adjacent area 33 to its dorsal limit. The lack of granular layer IV and the salience of the pyramidal layer V are characteristic features of the region
(26). Layer V is composed of a population of well-stained big pyramids distributed in two levels: the upper sublayer Va, with a homogeneous distribution and high cell density in contrast to the underlying sublayer Vb, characterized by pyramids aggregating into distinct cellular clusters with an overall low cellular density and the presence (often in clusters) of spindle (fusiform) neurons
(27,
28). These attributes influence the global aspect of its structural pattern, giving it a bistratified appearance clearly visible already at low magnification. The overall bilaminar aspect and the absence of layer IV help to differentiate area 24 from the neighboring dorsal and rostral areas. Ventral to the corpus callosum, the entire region shares the bilaminar layout in the lower layers described for area 24. Here the granularity criterion prevails, offering a reliable reference to the limit between the agranular area 24 and the granular Brodmann’s area 12.
Brodmann’s area 32 can be considered as a transitional region between peri- and isocortex and has been roughly associated to the paracingulate gyrus, also called the superior cingulate or paracingulate cortex. In this case, however, the relationship between microstructure and gross anatomical features proves to be unreliable, since the gyrus shows a high degree of morphological variability and is often fragmented. It is positioned basically parallel to the adjacent cingulate gyrus, connecting to the cingulate gyrus and the superior rostral sulcus at the level of the genu of the corpus callosum
(29). The main properties of area 32 are the progressive predominance of supragranular layers II and III over the infragranular layers V and VI and the development of a discontinuous internal, granular layer IV. Area 32 is composed of pyramidal cells and shows a moderate but continuous increase in cell size from surface toward the white matter. Sublayer IIIc is particularly developed, and its cells intermingle with those belonging to the upper limit of the pyramidal layer V. Furthermore, layer V is more homogeneous than in area 24, with a diminishing sublayer Va, while simultaneously increasing cellular density and width of sublayer Vb. The appearance of layer IV and a wide layer III marks the ventral limit of area 32. Rostrally, area 32 is distinguishable from area 10 by the rich layer IV of the latter. The transition between the end of area 32 and the beginning of the supplementary motor area or cingulate magnoganglionic core of Braak
(27,
30) is revealed by the sudden appearance of the pyramidal cells of Betz in layer Vb, a distinctive feature of motor cortices
(31). No extension of area 32 ventral to the corpus callosum has been detected
(31).
Stereology
A combination of systematic uniformly random sampling, volume estimation, cell counting, and disectors was used to obtain the total number of neurons and glial cells.
For systematic uniformly random sampling, some of the most remarkable features are the efficiency in terms of time and precision that may be obtained by counting only a few hundred nerve cells in, for example, the human brain. The coefficient of error (CE) of the estimated total cell number was determined according to the formula given by Braendgaard et al.
(25) and modified according to equations 20–22 of Gundersen et al.
(32). In the estimation of total cell number, we considered the “ideal” coefficient of error to be about half of the observed coefficient of variation (CV) because of the relationship: observed CV
2=biological CV
2 + estimator CE
2 (32). In this study, the values of the coefficient of variation were about 20%–30%, and the values of the coefficient of error were about 10%, which means that we met our general criteria for optimal precision of the estimations.
The total volume of the brain region of interest, i.e., the volume of the reference space [V(ref)] was estimated by using the Cavalieri principle
(33). The total number of points [ΣP
i] is multiplied by the unit area per point [a(p)] to give the total area of interest: A
i=a(p) × ΣP. The area [A
i] of each region was estimated using a Leica DMLB microscope with a 2.5× objective and a final magnification of 172× and an area per point of 1517 mm
2. A camera lucida setup was used to superimpose the cross-sectional area of the region of interest onto a point counting grid, and the investigator counted only the points that were within the image of the area. The average number of points counted per brain was 122 (range=90–208) for area 24 and 87 (range=32–187) for area 32.
The third dimension of the reference volume [V(ref)] was obtained by multiplying the sum of the measured areas [ΣAi] by the inverse sampling frequency of the sections [k] and the section thickness [t]: V(ref)=ΣAi × k × t.
The cell counting was performed by using the optical disector method to estimate the number of cells divided into two groups (neurons and glial cells) in Brodmann’s areas 24 and 32. Bilateral cell number was estimated as the unilateral number multiplied by two.
The disector is a probe that samples isolated particles with a uniform probability in three-dimensional space in which the z axis (the height of the disector) is employed using 40-μm-thick sections in which the plane of focus is moved up or down, and the x and y axis are defined by a square (the counting frame) superimposed on the magnified image of the tissue on the computer screen
(34). The area of the counting frame [a(frame)], the height of the disector [h], and the sampling fraction in the x-y axis were estimated in a pilot study and optimized to obtain a count of approximately 150–200 particles (cells) [ΣQ
–] per specimen. The dimension of the optical disector probe was a rectangular frame area of 2171 μm
2 and a disector height of 20 μm. The volume of the disector [v(dis)] is calculated as follows: v(dis)=h × a(frame). The equipment for optical disector counting consisted of a BX-50 Olympus microscope with a 100× oil-immersion objective with a high numerical aperture (1.35), a motorized stage, and an electronic Heidenhain microcator with a digital readout for measuring movements in the z direction with a precision of 0.5 μm. Counting took place at a final magnification of 3250×. Per brain, an average of 105 disector probes (range=32–208) were sampled with an average number of 1.5 neurons (range=0.9–2.8) and 3.0 glial cells (range=0.5–5.1) counted per disector, respectively. The thickness of the stained sections was measured at every second disector, showing a mean section thickness of 37.4 μm (range=31.9–45.3). The distinction between the largest glial cells and the smallest neurons is not a trivial problem. In this study, the neurons were identified on a combination of morphological criteria such as the chromatin pattern, size, and shape of the cell nucleus, a clearly visible nucleolus, and surrounding cytoplasm.
Figure 1 shows examples of neuron and glial cells using the modified Giemsa stain applied in this study. In 1.3% of the cases, the cells were identified as nonclassifiable and were not included in the final estimate. One investigator (A.K.S.) performed all cell counting. Several brains were counted more than once in a coded design and showed an intrarater reliability of
>95% in total cell number.
The total number of particles (cells) [N(part)] was obtained from the equation N(part)=[ΣQ–/Σv(dis)] × V(ref), where ΣQ–/Σv(dis) is equal to the numerical cell density [Nv]. Since the estimation of both the numerical cell density and the reference volume was obtained at the final, processed histological tissue level, the shrinkage does not need to be calibrated.
Statistical Analyses
The differences between means were analyzed using an unpaired two-tailed Student’s t test. The p values of differences between means are presented as two-tailed probabilities. Variability is shown in brackets as coefficient of variability (CV=SD/mean) following the respective means.
Results
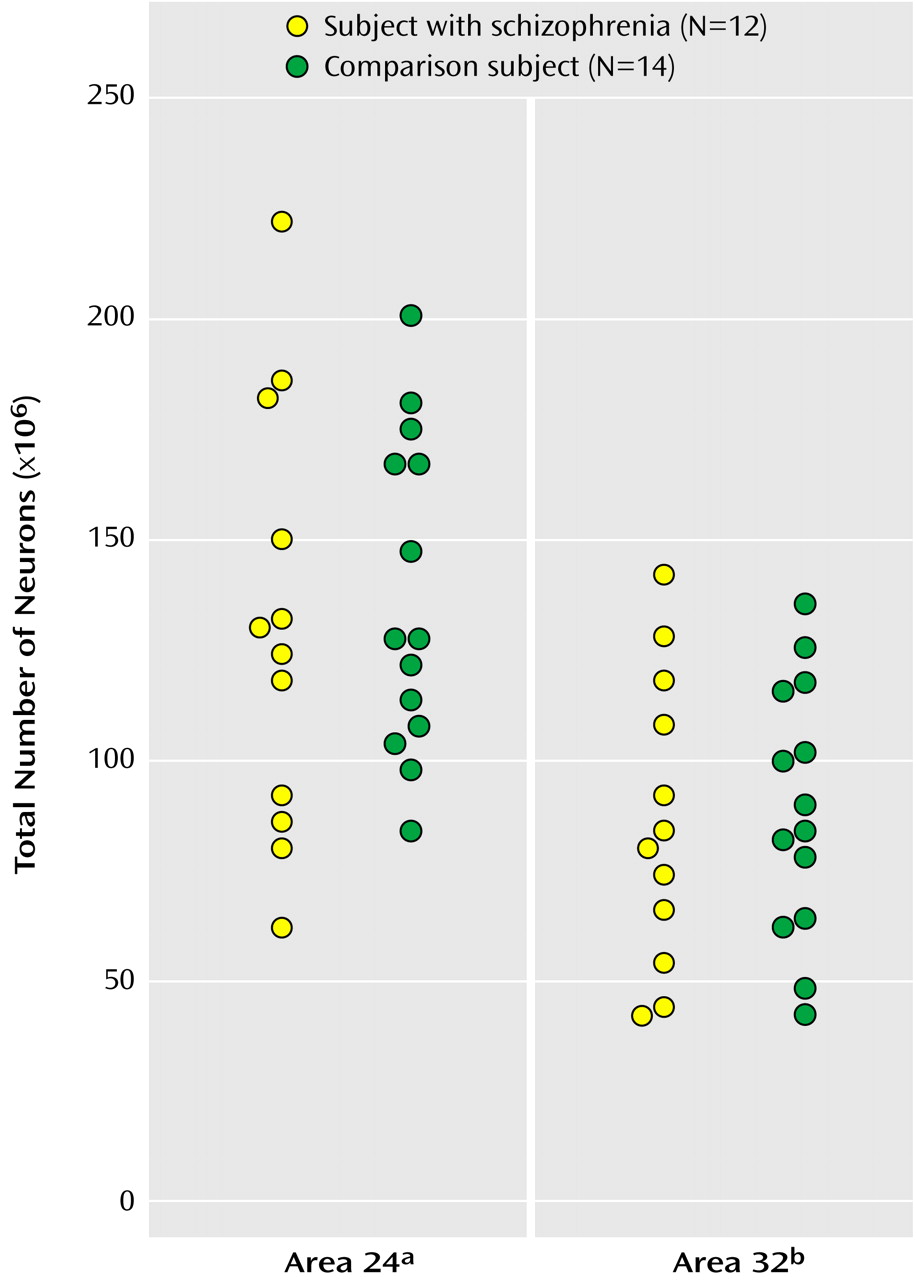
As seen in
Figure 2, the mean total number of neurons in the bilateral Brodmann’s area 24 was 130×10
6 (CV=0.37) for subjects with schizophrenia and 138×10
6 (CV=0.26) for comparison subjects, a statistically nonsignificant difference of 5.66%. The mean total number of neurons in the bilateral Brodmann’s area 32 was 86×106 (CV=0.38) for subjects with schizophrenia and 92×106 (CV=0.28) for comparison subjects, a statistically nonsignificant difference of 6.65%. For this study more left hemispheres than right hemispheres were included, but in accordance with earlier studies we found no difference in total number of neurons between the two hemispheres in either Brodmann’s area 24 or 32 (e.g., the mean total number of neurons in area 24 hemispheres was 137×10
6 for the right and 132×10
6 for the left, a statistically nonsignificant difference of 2.46% [t=0.30, df=24, p=0.77]).
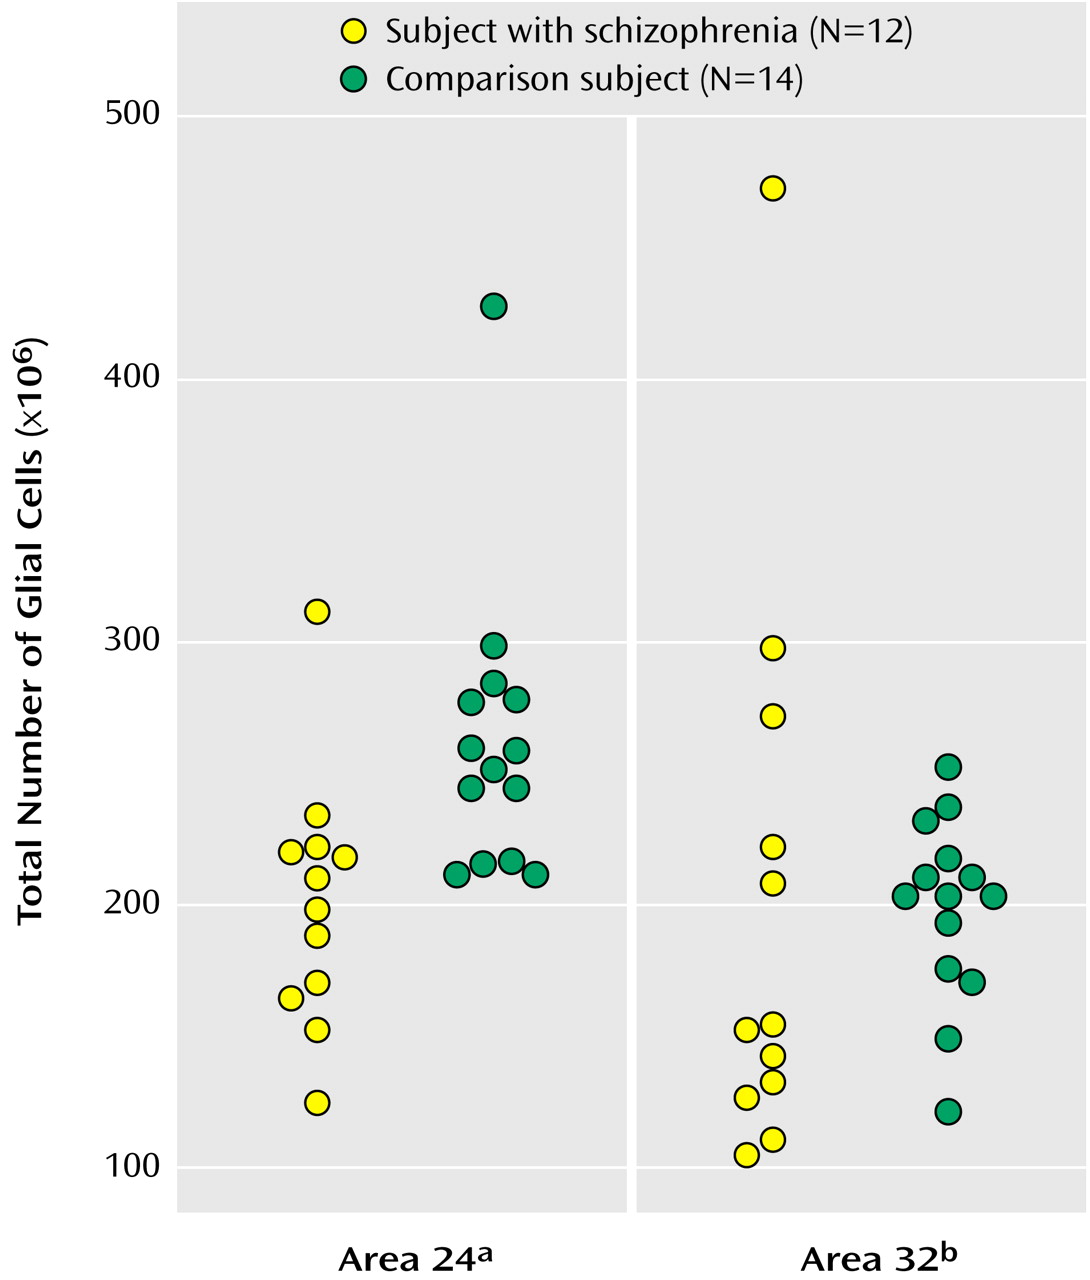
As seen in
Figure 3, the mean total number of glial cells in the bilateral Brodmann’s area 24 was significantly less in subjects with schizophrenia (201×106 [CV=0.24]) than in comparison subjects (302×106 [CV=0.36]), a significant difference of 33.43%. The mean total number of glial cells in the bilateral Brodmann’s area 32 was 164×10
6 (CV=0.44) for subjects with schizophrenia and 186×10
6 (CV=0.37) for comparison subjects, a nonsignificant difference of 11.8%.
No statistically significant difference was found between the average neuron or glial cell densities in Brodmann’s areas 24 and 32 of subjects with schizophrenia and comparison subjects. However, the difference in glial cell density in Brodmann’s area 24 between subjects with schizophrenia (57×103/mm3 [CV=0.29]) and comparison subjects (70×103/mm3 [CV=0.27]) approached significance (p<0.08). The glial density in area 32 was 63×103/mm3 for schizophrenia subjects and 66×103/mm3 for comparison subjects. Neuron density in area 24 was 130×103/mm3 for schizophrenia subjects and 138×103/mm3 for comparison subjects. Neuron density in area 32 was 33×103/mm3 for both groups. These density values are uncorrected for histological shrinkage.
No significant differences in total bilateral volume were found. The mean total bilateral volume of Brodmann’s area 24 was 3.8×103 mm3 and 4.2×103 mm3 for subjects with schizophrenia and comparison subjects, respectively (t=–1.17, df=24, p=0.25). The mean total bilateral volume of Brodmann’s area 32 was 2.6×103 mm3 and 2.8×103 mm3 for subjects with schizophrenia and comparison subjects, respectively (t=–0.65, df=24, p=0.52).
There was no correlation between total number of cells and fixation period and no correlations for total cell number, glial cells, or neurons in Brodmann’s areas 24 and 32 with postmortem interval or neuroleptic treatment, which is in agreement with the literature indicating that pharmacological treatments are more likely to increase glial cell numbers than to cause a reduction
(35).
Discussion
This study demonstrates that the total number of glial cells in the bilateral Brodmann’s area 24 was significantly lower in subjects with schizophrenia relative to comparison subjects, with no change in total neuron numbers. Our results differ from previous neuronal counting studies that reported postmortem reduction in neuron density in Brodmann’s area 24 of subjects with schizophrenia
(13,
14,
36), but are in agreement with our normal neuron numbers in the prefrontal cortex
(37) and frontal lobes
(38). Brodmann’s area 32 is structurally defined as a “transitional” area, sharing structural features with the bordering periallocortical area 24 and fully isocortical regions. Despite its related structural properties, area 32 is spared of the reduction of glial cells found in area 24, indicating a particular involvement of Brodmann’s area 24 in the structural changes associated with schizophrenia.
We did not find any differences in the cell densities of either neurons or glial cells, although the glial cell density in Brodmann’s area 24 was close to being significantly reduced in the subjects with schizophrenia relative to the comparison subjects. However, as stressed previously
(37), alterations in cell density do not necessarily reflect alterations in the total cell number. Differences in cell densities can simply signify differences in tissue behavior (shrinkage or swelling) during histological handling, with an unpredictable impact on the cell density.
Because glial cells are suspected of playing an essential role in normal brain functioning, we believe that it is significant that our study identified a schizophrenia-associated deficit in total number of glial cells in the anterior cingulate cortex. Oligodendrocytes, the myelin-forming cells of the central nervous system, and astrocytes constitute macroglia, which are able to respond to changes in the cellular and extracellular environment. Despite their number and their role during development, their active participation in the physiology of the brain and the consequences of their dysfunction on the pathology of the CNS have only been emphasized in recent years
(20). Using gold impregnation, Ramon y Cajal
(39) identified the astrocyte, while Rio Hortega a few years later identified the oligodendrocyte, and another cell type that he distinguished from the two macroglial cells as the microglia
(40). There is now increasing evidence that glia, possibly through a glial network, may have communication skills that complement those of the neurons themselves
(20).
Using recent stereological methods, the role of glial cells in the prefrontal cortex of schizophrenia has been investigated in a few studies. Öngür et al.
(41) found glial cell reductions in spite of normal neuron numbers in selected areas of the prefrontal cortex (the subgenual part of Brodmann’s area 24) in mood disorders but with no changes of neuronal and glial cell numbers in schizophrenia brains studied as psychiatric control subjects, while Pierri et al.
(42) found reduced mean neuronal size in deep layer III pyramidal neurons in schizophrenia subjects relative to comparison subjects. In our study, the glial cells were not subdivided into subgroups. It would thus be premature to postulate mechanisms leading from total glial reduction to the psychopathology of schizophrenia. The role of glial cell reduction in the prefrontal cortex is uncertain in the pathogenesis of schizophrenia, but the reduction presumably interacts with other factors, including afferent neuronal activity or neuromodulators such as serotonin, noradrenalin, and dopamine to produce specific disturbances in brain activity, mood, and behavior. It is possible that glial cell loss could predate or predispose to schizophrenia, and it is of course also possible that glial cell loss could be an epiphenomenon and thus not of primary etiological importance to the disease process.
Future studies of clinicopathological correlates and of the effects of drug therapy on glial cells and glial-neuronal relationships may verify the role of glial cell pathology in schizophrenia.
