The aggregate aims of the multiple twin, family, and molecular genetic studies of attention deficit hyperactivity disorder (ADHD) have been to determine if ADHD is influenced by genetic factors and, once that is established, to identify risk genes for ADHD
(1). It is hoped that once heritable phenotypes for ADHD are discovered, the likelihood of identifying the genes that confer risk will increase
(2). Obstacles to identifying heritable phenotypes include concerns about taxonomic approaches, issues of comorbidity, and confounds by development, sex, and informant.
Twin studies have provided insights on gender similarities and differences
(2) as well as developmental issues
(3). A review of the literature on twin studies that used the DSM-IV criteria for ADHD yielded evidence that between 60% and 94% of the influence on ADHD is due to genetic factors
(1). Further, twin studies of DSM ADHD have resulted in the finding that rater effects can bias estimates of heritability. Rater effects can inflate genetic dominance estimates or can decrease estimates of heritability and increase estimates of shared environmental contributions to ADHD if a parent rates one child as less impaired when comparing the child to an unaffected sibling. However, under certain conditions (e.g., large sample size) these effects can be distinguished from each other
(3,
4).
One strength of studies that have used DSM interview data is the fact that DSM contains the diagnostic criteria for the phenotype of interest. Weaknesses of using DSM diagnoses as markers for genetic studies include the fact that DSM does not provide normative data that allow for gender- or age-specific discrimination. Finally, and most pertinent to quantitative gene-finding expeditions, is the categorical nature of ADHD. For example, a child with 10 symptoms that are split evenly between inattention and hyperactivity may be excluded from a study while another child with six symptoms of inattention may be included. As a result, many twin studies that have used the DSM criteria set have simply analyzed the data as if they were quantitatively derived. Although this is useful from a data analytic point of view, the absence of psychometric quantitative data to support this practice is problematic.
An alternative to the DSM categorical approach is the use of empirically derived instruments, such as the Child Behavior Checklist. Attention problems and aggressive behavior as defined by the Child Behavior Checklist have been shown to be highly predictive of DSM ADHD
(5,
6) but do not yield one-to-one agreement on cases
(6). Multiple twin studies of the Child Behavior Checklist scales for attention problems and for aggressive behavior have been published
(3,
7,
8) and yield moderate to high estimates of genetic contributions, 60%–70%, which are somewhat lower than the 90% usually seen in studies using the DSM criteria for ADHD. One potential advantage of using the attention problem and aggressive behavior syndromes for twin studies is that the syndromes are derived from a quantitative approach that is gender, age, and informant specific
(9). Developmental twin studies using the attention problem syndrome as a marker have provided evidence for genetic dominance (i.e., the nonadditive genetic interaction of two or more alleles at the same locus) at ages 3, 5, and 7 but not at later ages
(8).
If genetic dominance is substantiated for ADHD at early but not later ages, one implication is that the search for risk genes must take into account the age of the subject at the time of phenotype assessment. Second, gene finders must then change their expectations because the power to detect oligogenetic influences is dramatically decreased in the face of dominance. Because estimates of genetic dominance are not possible in the models that are 1) confounded by high levels of rater contrast and sibling interaction, 2) limited by sample size constraints
(10), or 3) confounded by inclusion of subjects of ages at which dominance is important (the very young) in addition to subjects for whom dominance is no longer contributing (adolescents), the use of a quantitative scale offers considerable advantages.
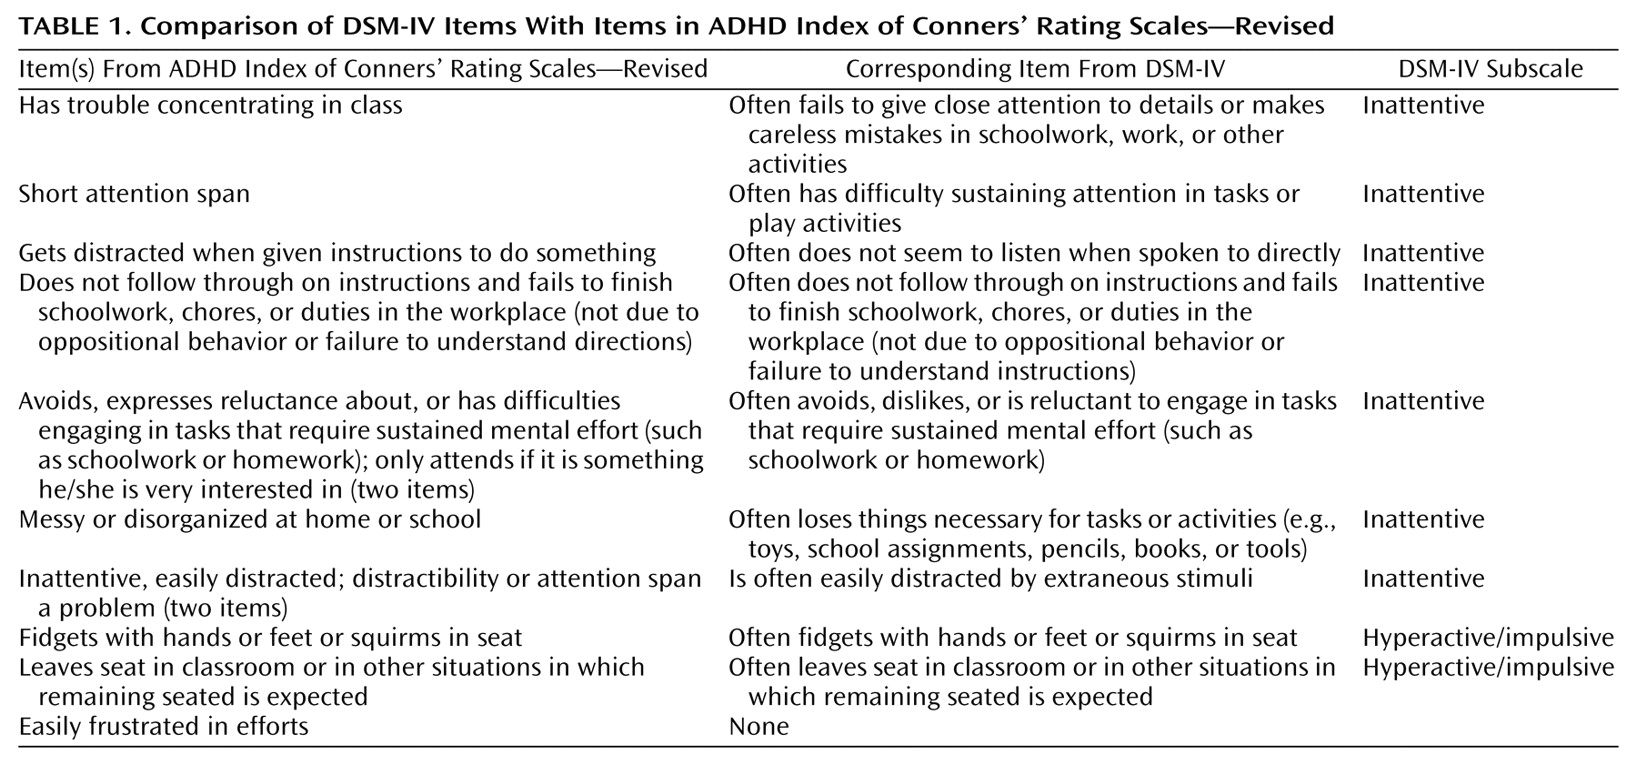
For ADHD a taxonomic middle ground does exist. The ADHD index of Conners’ Rating Scales—Revised
(11) is a 12-item index (
Table 1) that Conners and his colleagues found to be the most likely to identify children at risk for DSM-IV ADHD. Scores are provided that allow the clinician to compare a raw score to a gender- and age-specific T score to determine whether or not an individual child likely meets the criteria for DSM-IV ADHD.
Conners’ Rating Scales evolved from the same taxonomic heritage as the Child Behavior Checklist. They both embody empirically based approaches, with some differences. The developers of the Child Behavior Checklist identified 118 common behavioral items and then let factor analyses yield syndromes. Conners’ Rating Scales—Revised differs in that the items for the ADHD index were chosen, rather than derived, in order to make sure that the DSM symptoms themselves were included in the symptom set before they were exposed to discriminant function analyses. As a result, only five of the 18 DSM-IV ADHD items are directly included, although all but one item could be considered comparable to items from the DSM-IV symptom list. The approaches of both the Child Behavior Checklist and Conners’ Rating Scales use a quantitative Likert response scale and provide normative data by gender, age, and informant. Thus, in many respects the Conners ADHD index is similar to the Child Behavior Checklist except that the ADHD index allows for direct testing of the performance of some DSM ADHD symptoms in quantitative genetic analyses. By using the Conners scales, we are able to test some DSM ADHD symptoms from quantitative, gender, and developmental points of view. Further, we can test models of rater bias and interaction on these maternal reports. Last, because the ADHD index of the Conners scales is so widely used in outcome studies, this work generalizes to those who use Conners’ Rating Scales—Revised in other settings.
In this study, we report analyses of maternal reports on the ADHD index of Conners’ Rating Scales—Revised regarding 1,595 7-year-old twin pairs from the Netherlands Twin Registry. The data were analyzed to determine 1) the percentage of children, by sex, who meet the criteria for clinical deviance according to the ADHD index, so that rates based on the Conners index in our general community twin sample can be compared to what is known about rates of DSM-based ADHD, and 2) estimates of genetic (additive and dominant) and environmental contributions to ADHD as defined by the ADHD index; these data were tested in gender-genetic models to estimate if gender, rater bias or sibling interaction, or dominance contributes to individual differences in scores on the ADHD index.
Method
Subjects and Procedure
The study was part of an ongoing twin-family study of health-related characteristics, personality, and behavior in the Netherlands. The subjects were all part of the Netherlands Twin Registry. The registry currently has data on over 25,000 twin pairs. For this study, we assessed a sample of Dutch twin pairs whose parents reported on their behavior when they were 7 years old. The twins at age 7 were representative of Dutch 7-year-old children with respect to their scores on measures such as the Child Behavior Checklist
(12). The socioeconomic status of the parents of the twins was somewhat higher than the level in the general Dutch population. Mothers, fathers, and teachers received the Conners’ Rating Scales—Revised forms in the mail and were asked to return them to the Netherlands Twin Registry by mail. Parents who did not return the forms within 2 months received a reminder, and those who did not respond after 4 months were telephoned by the registry’s research assistant. This process yielded an 80% participation rate. For this study, only the mothers’ responses were used; data were available for 1,595 twin pairs.
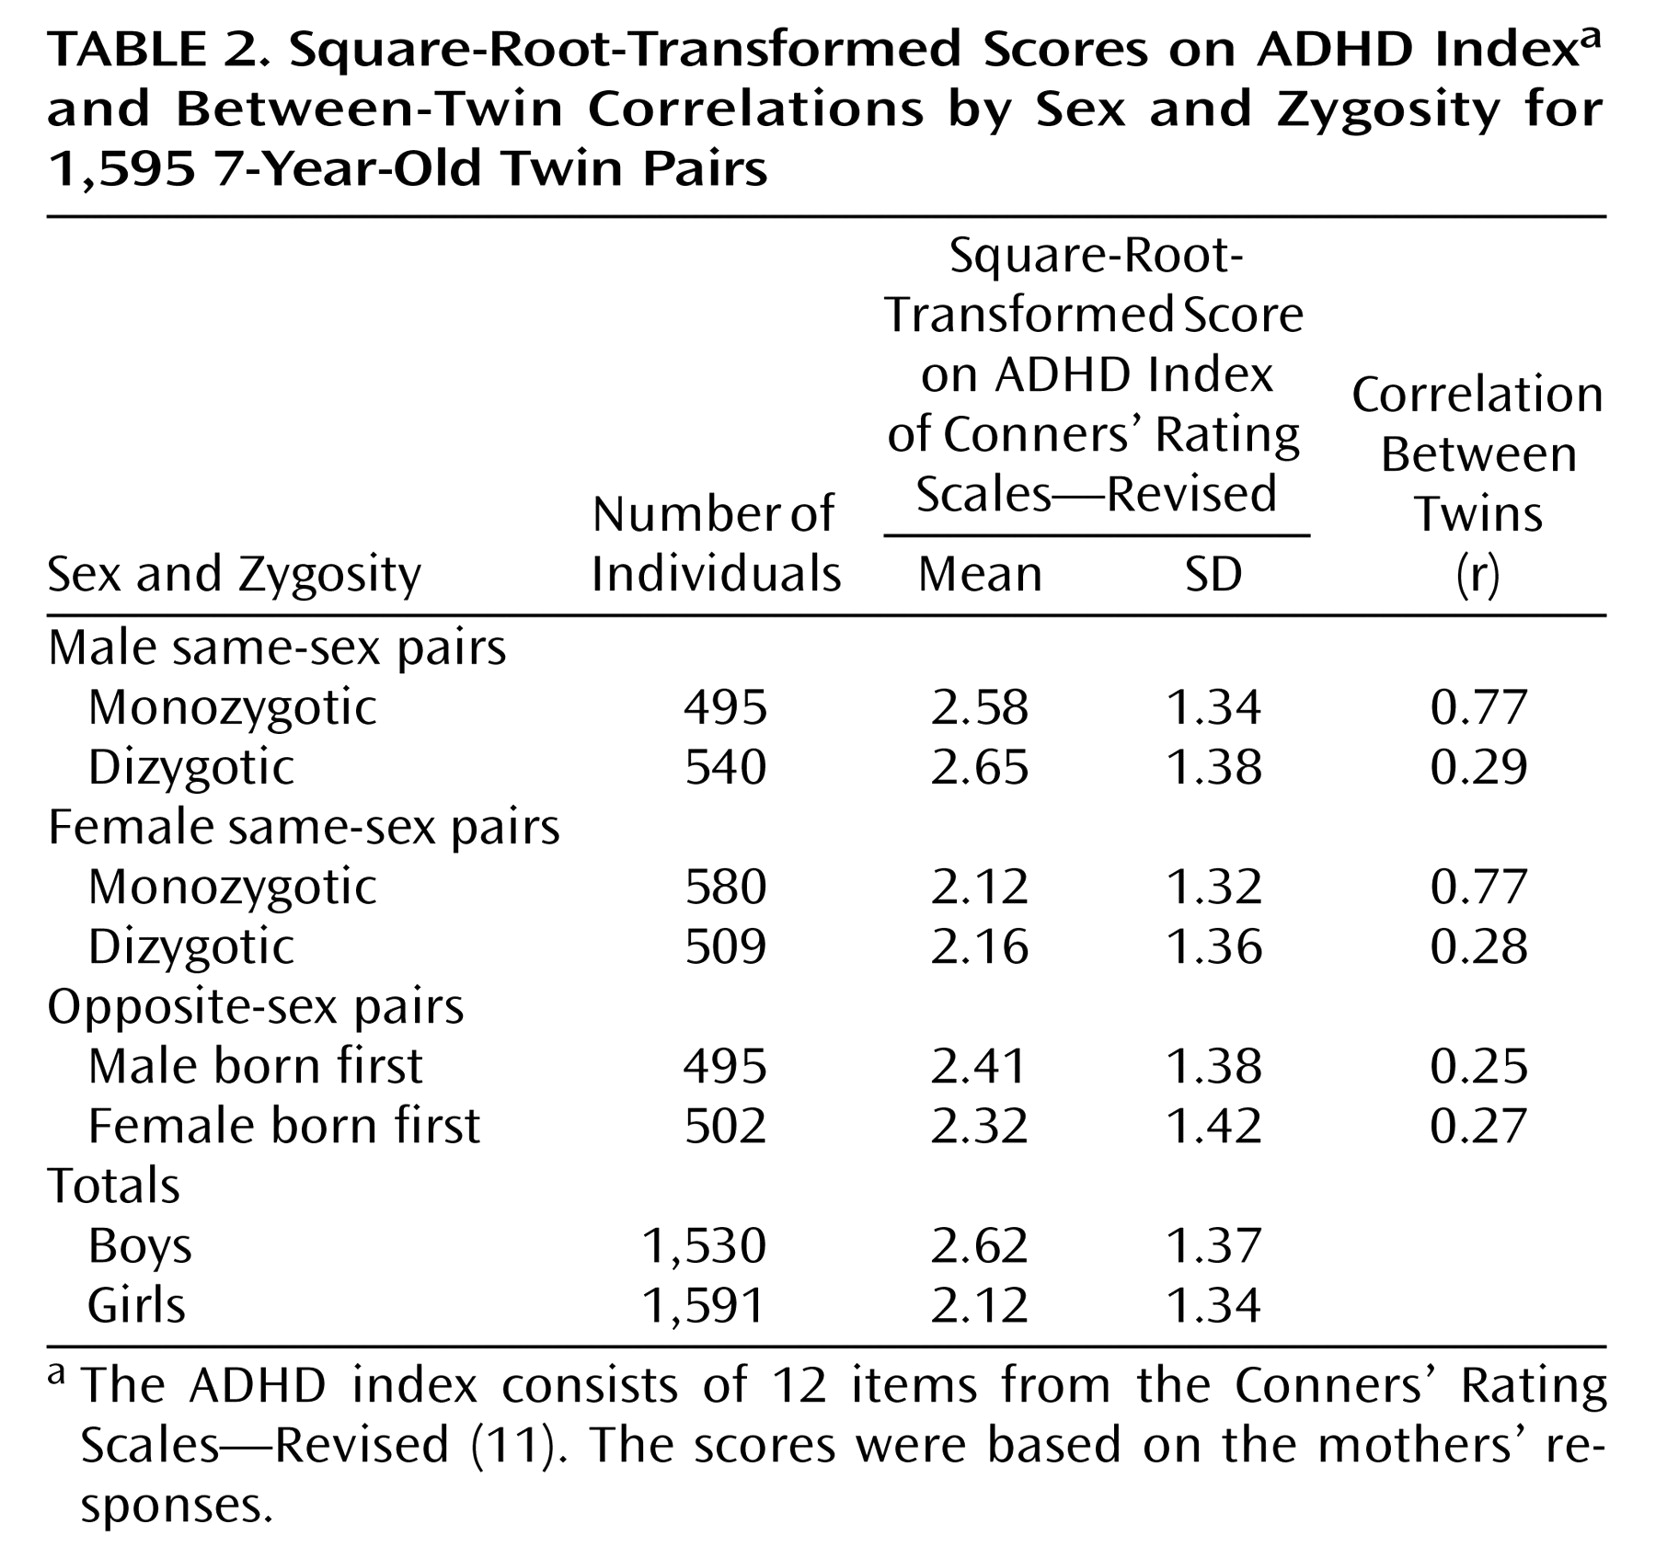
Table 2 presents the numbers of twin pairs by zygosity and gender.
Zygosity was determined by questionnaire items about physical similarity and frequency of confusion of the twins by family and strangers. The classification of zygosity was based on a discriminant analysis, relating the questionnaire items to zygosity based on blood/DNA typing in 634 same-sex twin pairs. According to this analysis, the zygosity was correctly classified by questionnaire data in nearly 95% of the cases
(13).
Data Analyses
Distribution of ADHD index scores
Means, variances, and twin correlations were calculated by using the statistical software program Mx
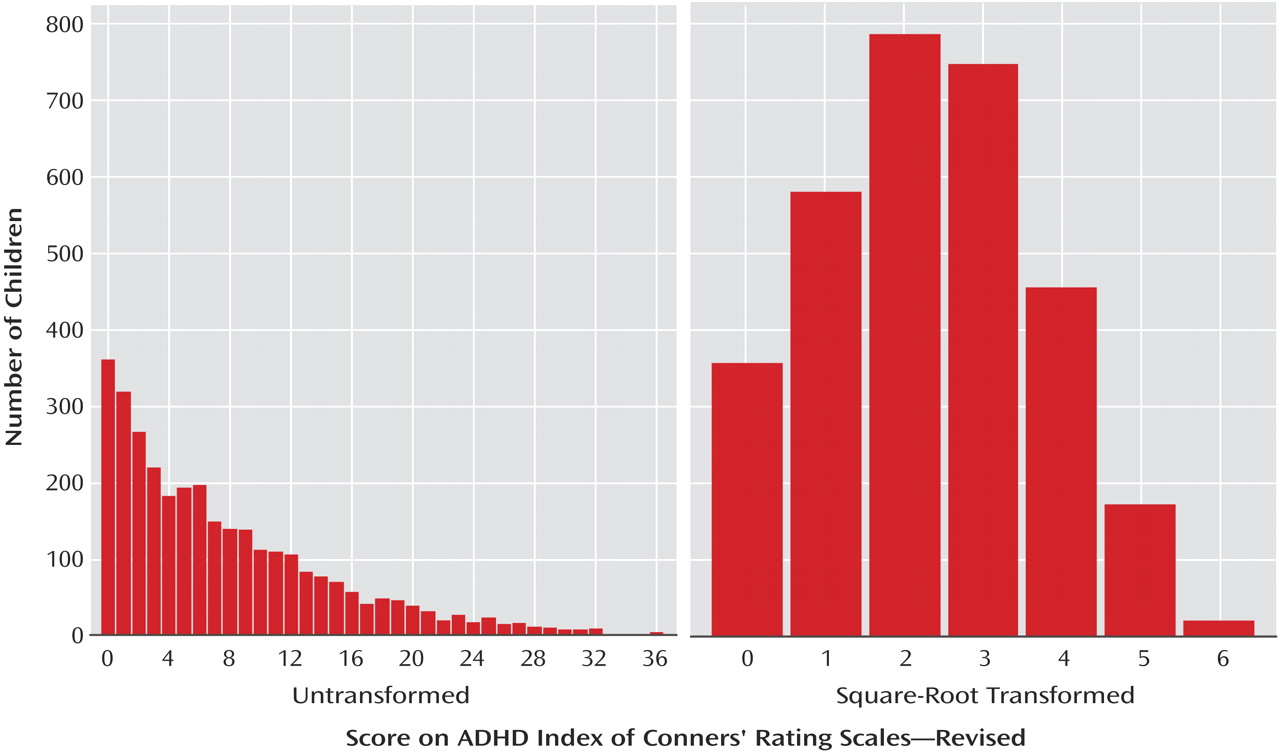
(14). Because the scores on the ADHD index were not normally distributed, the data were square-root transformed to approximate normality. Distributions of the raw and transformed measures are provided in
Figure 1.
Prevalences
The numbers of boys and girls who had T scores above the at-risk cutoff point (T>65) or clinical cutoff point (T>70) were computed in accordance with the guidelines provided by Conners
(11). These T scores have been calculated in a large normative sample
(11) and have a mean of 50 (SD=10). Assuming a normal distribution of the scores, we would expect 6.5% of the children to obtain a T score above 65 and 2.5% of the children to obtain a T score above 70. Because the data are usually not normally distributed, the observed prevalences may deviate from these theoretical percentages.
Model fitting
Genetic and environmental influences on the ADHD score were computed by using structural equation modeling. The influence of the relative contributions of genetic and environmental factors to individual differences in ADHD can be inferred from the different levels of genetic relatedness of monozygotic and dizygotic twins
(15).
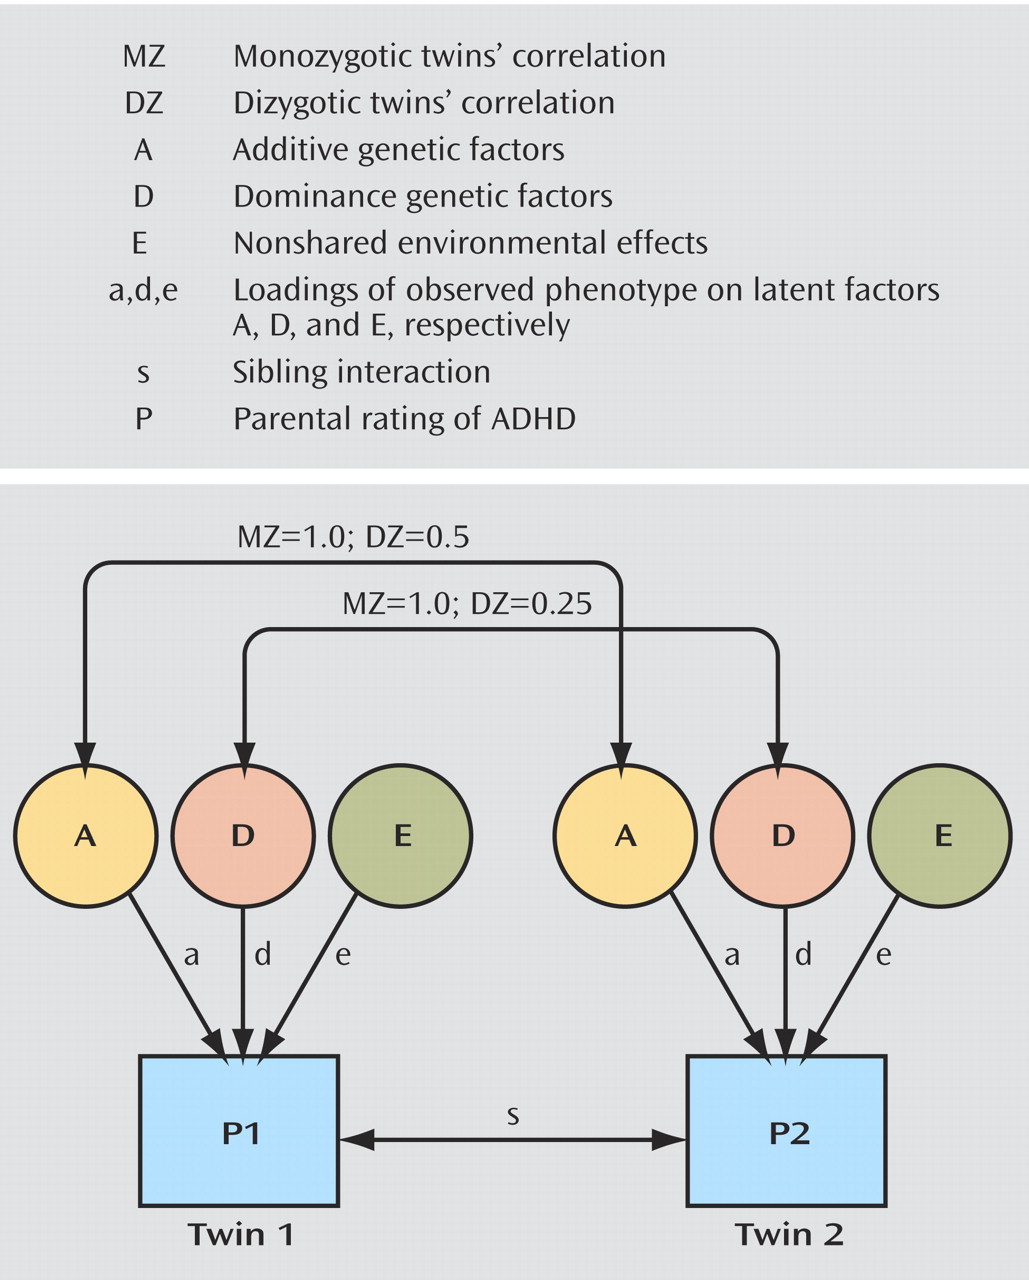
Figure 2 summarizes the fundamental univariate genetic model that underlies our analyses. The variance may be due to additive genetic factors (A), dominance genetic factors (interaction of genetic effects at the same locus) (D), shared environmental effects (C), or nonshared environmental effects (E). The genetic factors have a correlation of 1.0 in monozygotic twins, as they are genetically identical. For dizygotic twins, the additive genetic factors have a correlation of 0.5, because dizygotic twins share half of their segregating genes on average. The genetic effects due to dominance are correlated 0.25 in dizygotic twins. The environment shared by a twin pair (C) is assumed not to depend on the zygosity, and thus the shared environmental factors correlate 1.0 in both monozygotic and dizygotic twins. E, or nonshared environment, is by definition uncorrelated, and it also absorbs all uncorrelated error. In the model shown, only D is given, but this could by replaced by C. If the pattern of twin correlations is such that the correlation for monozygotic twins is less than twice the correlation for dizygotic twins, then models that test for C are usually pursued. If the pattern of twin correlations is such that the correlation for dizygotic twins is smaller than half the correlation for monozygotic twins, then ADE models are considered. The choice between fitting C or D is definitional because estimating C and D at the same time is not possible in a design using only data from monozygotic and dizygotic twins reared together. The parameters a, d, and e are loadings of the observed phenotype on the latent factors A, D, and E and indicate the degree of relationship between the latent factors and the observed phenotype. The proportion of the variation accounted for by heritability or environmental influences is calculated by squaring the parameters a, d (or c), and e and dividing them by the total variance (a
2 + d
2 [or c
2 ] + e
2 ). Additionally, in the univariate model the effects of sibling interaction (path=s) are also considered. The sibling interaction is due to the effect of one twin’s behavior on the behavior of the other twin. The interaction effect may also be due to bias in parental reports when parents rate their children’s behavior in comparison to each other. When the path s is positive, then high parental ratings of twin 1 for ADHD will lead to high parental ratings of twin 2’s ADHD. But when s is negative, high ratings on ADHD for twin 1 will lead to lower ratings on ADHD for twin 2.
All model fitting was performed on raw data with Mx
(14), a statistical software package designed for conducting genetic analyses by using an approach that is standard in structural equation modeling
(16). The basic model was an ACE or ADE model with and without sex and interaction effects. The possible presence of an interaction component was tested by examining the variances between monozygotic and dizygotic twins. If these variance differences are nonsignificant, the presence of sibling interaction or rater bias is not plausible. The significance of the A, D, and C factors or sibling interaction was tested by dropping the variance components, by means of the chi-square difference test. The chi-square statistic is computed by subtracting the –2 log likelihood for the full model from that for a reduced model. The number of degrees of freedom for this test is the difference in the number of estimated parameters between the full and the reduced models. The method is contrary to other types of analyses in that if there is a significant difference between the reduced and full models, then the reduced model should not be accepted, because it means that dropping a component to reduce the model significantly
worsened the fit. We also computed likelihood-based 95% confidence intervals
(14,
17). More technical details of genetic model-fitting analyses are reviewed elsewhere
(15).
Results
Means and Correlations
The means of the square-root-transformed scores on the ADHD index and the twin correlations are shown in
Table 2. In both boys and girls, the correlations between monozygotic twins were larger than the correlations between dizygotic twins, indicating the influence of genetic factors. It is also important to note the similarity in the correlations between monozygotic boys and between monozygotic girls, as well as the similarities in the correlations between members of dizygotic male pairs, dizygotic female pairs, and opposite-sex pairs. In both genders the magnitude of the difference between correlations for monozygotic and dizygotic twins suggested the possibility of genetic dominance; therefore, models testing for dominance were fit.
Prevalence
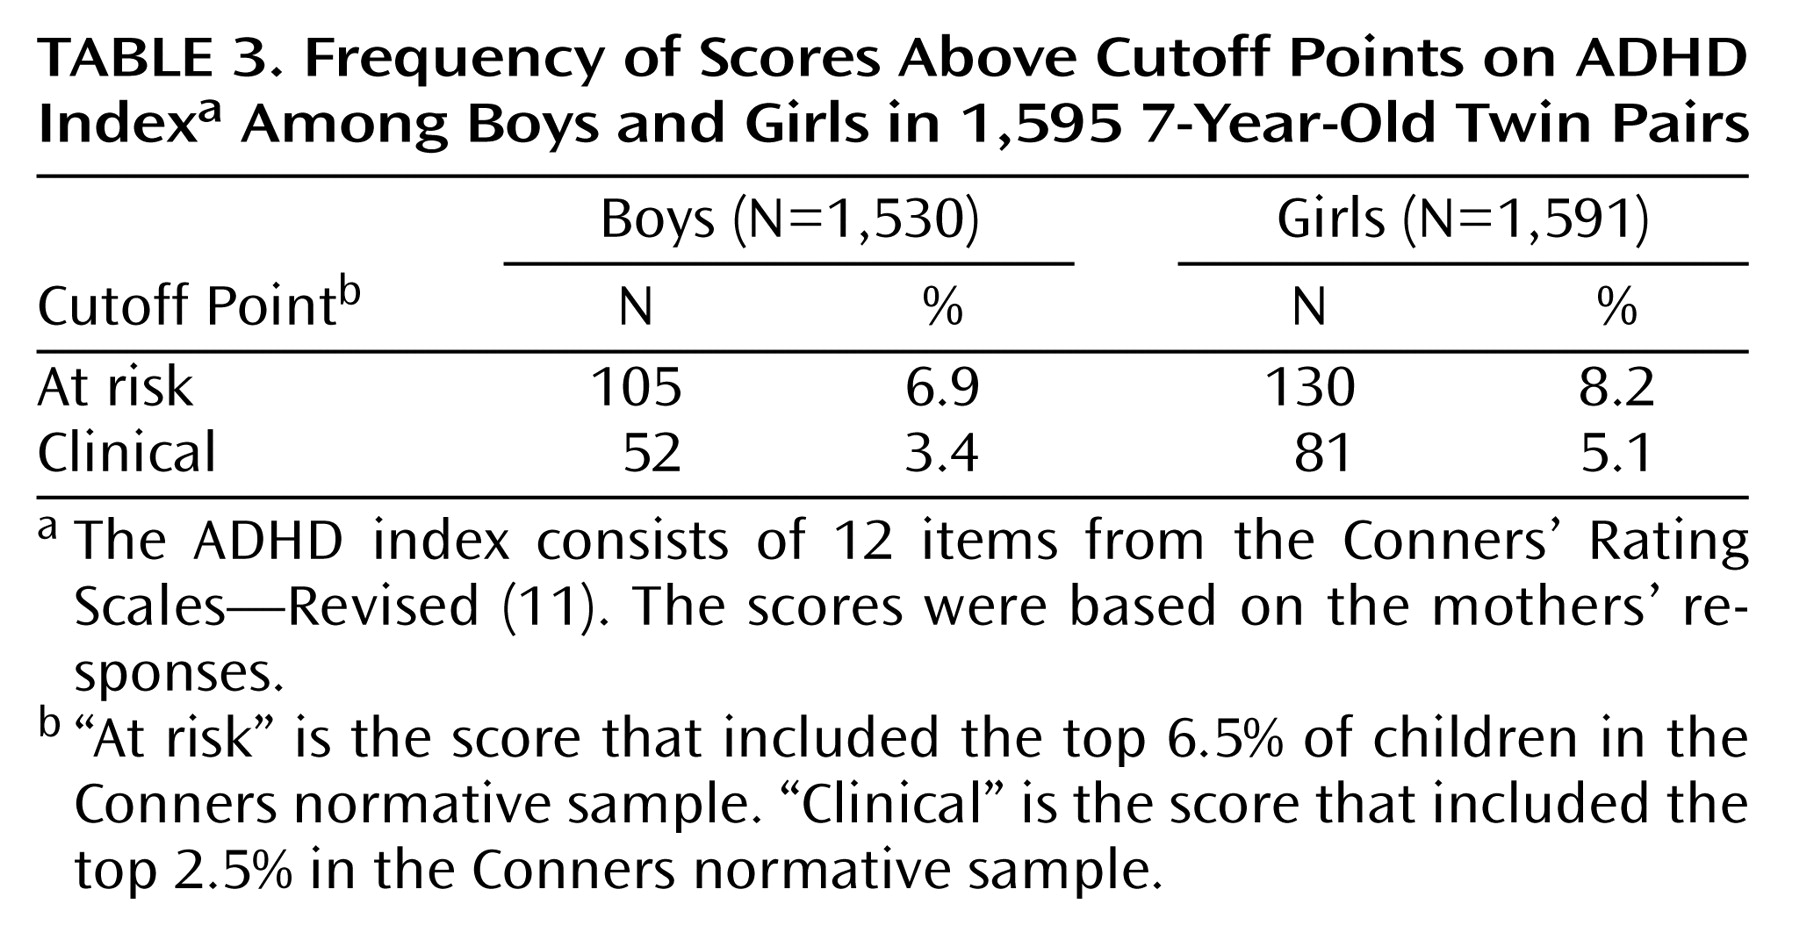
The numbers of children, by gender, who exceeded the at-risk and clinical cutoffs for ADHD are presented in
Table 3. Using the more stringent clinical threshold, we identified 3.4% of the boys and 5.1% of the girls as meeting the criteria for ADHD. When we used the Conners’ Rating Scales “clinically at risk” cutoff point, 6.9% of the boys and 8.2% of the girls were identified as at risk. Two apparent trends emerged. First, this approach identified a number of boys with ADHD and a number of boys at risk for ADHD that were consistent with the numbers of boys identified similarly by using DSM approaches in the United States, but the numbers were markedly higher than the numbers typically identified in Europe by means of approaches using ICD-9 or ICD-10. However, a compelling case for gender-specific approaches is seen when the data on girls are examined. At both cutoff points, more girls than boys were identified as meeting the criteria, albeit without information concerning impairment. These data are consistent with approaches that argue for gender-specific cutoff points in psychiatry
(9). In the past, such work was criticized because DSM symptom domains were not used. In this investigation DSM symptoms were used, and the results indicate that girls are as likely as boys to meet criteria for ADHD based on maternal responses to the Conners’ Rating Scales—Revised, although independent validation using an alternative measure of ADHD that also assesses impairment seems warranted.
Model Fitting
A summary of the model-fitting results is given in
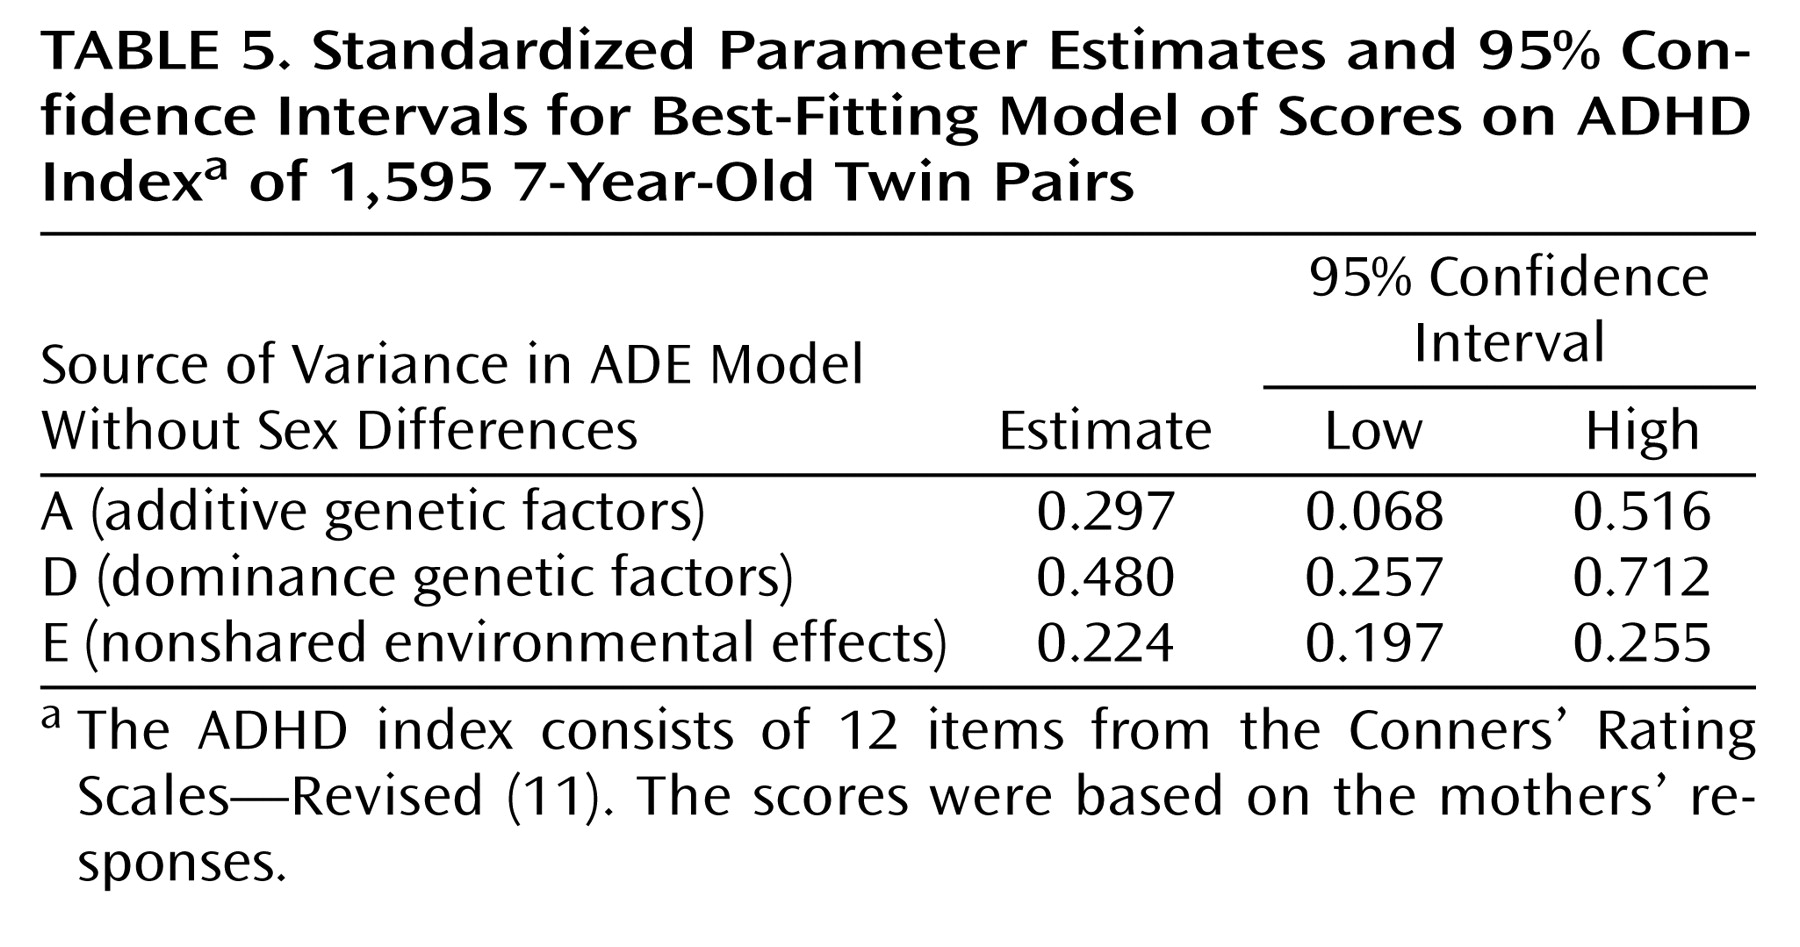
Table 4. The difference in chi-square values indicates the goodness of fit of the model, compared to a saturated model. First, variance differences between monozygotic and dizygotic twin pairs were tested. The fit of a model that constrained the variances to be equal was compared to the fit of a fully saturated model in which all variances and covariances were freely estimated. The variances were not significantly different; therefore, the presence of sibling interaction or rater bias is not likely. Second, an ADE model was fit to the data. This model provided a very good fit to the data. Dominance contributed significantly to the variance of scores on the ADHD index (model 4). The factor loadings of A, D, and E were not significantly different between boys and girls. The ADE model without sex differences was the best-fitting model. The additive genetic factor explained 30% of the variance, the dominant genetic factor explained 48%, and the unique environmental factor explained 22%. The confidence intervals are provided in
Table 5.
Discussion
To our knowledge, this is the first evaluation of the genetics of the Conners ADHD index that uses both quantitative and DSM taxonomic approaches in the study of ADHD. The prevalence data, which allow for gender-sensitive analyses, strongly support the assertion that the DSM-IV ADHD items identify too few girls as suffering from ADHD. Indeed, our data suggest that in this epidemiologic sample, more girls than boys were deviant on this measure of ADHD. However, these prevalence data do not include information on impairment, and an independent validation of the prevalence information using an alternate measure is needed.
The heritability estimates for DSM ADHD are closer to those reported for the attention problem syndrome and aggressive behavior syndrome of the Child Behavior Checklist (70%). These data are in contrast to studies that use DSM-IV categorically, i.e., yes/no data, which show heritability estimates in the 90%–95% range and have large estimates of rater contrast (–0.24 to –0.40)
(9). This argues that the inclusion of the entire range of phenotypic variation, which is subsumed by a dimensional model of attention problems even when predominantly the same symptom cluster as a categorical model is used, results in genetic model fitting that has slightly lower heritability and shows the contribution of genetic dominance. Identification of genetic dominance as the primary influence on ADHD has not been reported previously to our knowledge. Our group has found evidence of genetic dominance in the attention problem syndrome from the Child Behavior Checklist
(3), but not in all age groups and not by all informants. In the ADE model we identify modest additive genetic influences (30%), moderate dominant genetic influences (48%), and modest unique environmental contributions (22%). The issue of genes interacting in a nonadditive way is discussed elsewhere
(10), but if such models are replicated, evidence of genetic dominance argues for a different approach to identifying heritable phenotypes, as dominance and other forms of nonadditivity inform the selection of participants for genetic analyses. Additive genetic variance reflects the cumulative
additive effect of individual genes. If nonadditive genetic variance is important in the trait, it is expected that correlations between monozygotic twins would be much higher than correlations between dizygotic twins or siblings, as is seen in these data. Because monozygotic twins share all genes and genetic configurations, both additive and nonadditive genetic effects contribute to the resemblance of monozygotic twins. The genetic contribution to resemblances between first-degree family members such as siblings and dizygotic twins, on the other hand, depends mostly on additive genetic effects. If nonadditive genetic effects are important to a trait, then the exclusion of monozygotic twins in genetic analyses should lead to substantial reductions in the estimates of heritability, as these estimates would reflect primarily additive effects. To obtain insight into the number of loci, their localization on the genome, and their gene action (additive or not additive), we need to obtain DNA marker data in a sufficiently large sample of dizygotic twins or siblings to carry out a linkage study. At the very least, our data, taken together with our prior work on the attention problem syndrome, argue for the consideration of different genetic influences at different ages.
The issue of the ADE model versus models reported by others, such as the AEi model (i.e., a model that allows for sibling interaction whereby the ADHD symptoms of one child affect the ADHD symptoms of the co-twin or the rating of the ADHD symptoms of the co-twin) or rater bias models, can be solved only as we increase the sample sizes, types of samples (such as adopted siblings, unrelated subjects, and subjects reported on by multiple informants). Comparing ratings of the child to normative data may not fully eliminate rater bias. However, there is no evidence of rater bias in this sample.
Limitations of the study should be noted. The ADHD index is a 12-item scale reported by Conners
(11) to be an efficient indicator of DSM-IV ADHD. Like other approaches, the ADHD index does not retain all 18 items of DSM-IV, and so use of the ADHD index is not a direct test of DSM-IV ADHD, and the differences in prevalence between boys and girls may be due to the exclusion of some items of DSM-IV ADHD that are more prevalent in boys. The ADHD index is closer in content to DSM than other quantitative measures of ADHD, with the notable exception of the ADHD Rating Scale
(18), which uses all of the DSM items as well as gender and population norms.
Second, our data on a large set of 7-year-old twins from mothers’ reports may not generalize to older children, to children in other countries, or to other informants. Our group is currently collecting data on older twins from fathers’ and teachers’ reports in order to test for these factors. Also, because the Conners forms identify so many more children than the ICD approaches in Europe, it is possible that the Conners forms overidentify cases relative to the local social context. This will be examined more thoroughly when our group has collected DSM interviews on a subset of these twins.
Third, as we did not directly interview the parents or children in this study, we cannot present data on the number of children who exceeded the ADHD index cutoffs who also met the DSM-IV diagnostic criteria for ADHD. In order to test for these data, our group is currently interviewing a subset of this sample in order to determine those relations.
