Definition of Subgroups
NPNN and NPI patients were identified on the basis of two verbal and two nonverbal serial position working memory tasks
(12,
13) . Test stimuli were words, easily named sounds (e.g., telephone ringing), bird songs, or snowflake designs. Patients with schizophrenia have been shown repeatedly in previous studies to perform poorly on these tasks
(12 –
14) . Moreover, deficits in working memory in general and verbal memory in particular, are among the most consistent and robust cognitive deficits in schizophrenia (e.g., reference
15 ). Thus, both the verbal and nonverbal tests identify patients with wide-ranging deficits, whereas the verbal tests are particularly sensitive in identifying patients who have significant but more narrowly defined deficits. To validate this method for designating patients as NPNN or NPI, in the first 46 patients (14 NPNN and 32 NPI) and 22 healthy subjects enrolled, cognition was also evaluated using two additional tests that have been widely used in demonstrations of cognitive deficits in patients with schizophrenia, the California Verbal Learning Test
(16) and a degraded stimulus version of the Continuous Performance Task
(17) .
Twenty-one patients were assigned to the NPNN group, based on overall scores on the four tests within 0.5 standard deviation of the mean score of healthy subjects. Fifty-four patients were assigned to the NPI group based on overall scores that were >1.0 standard deviation below the mean of the healthy comparison subjects. To improve the accuracy of correct subgroup assignment, six patients whose overall scores were between 0.5 and 1.0 standard deviations below the mean of the comparison subjects were excluded. Although these boundary definitions were selected a priori using commonly accepted criteria for normal (i.e., <0.5 standard deviation from comparison means) and abnormal (>1.0 standard deviation below the comparison mean), post hoc inspection showed that the distribution of scores from all patients (including the six excluded from subgroup assignment) was consistent with subpopulations defined by these boundaries. The distribution was nonnormal by the Shapiro Wilk test (p=0.03), with a major peak at 1.85 standard deviations below the mean of healthy comparison subjects and a second peak at exactly the mean of the healthy comparison subjects. Assignment of 28% of the patients to the NPNN group is similar to the proportion shown in previous studies to have either normal or close to normal cognition
(2 –
9) .
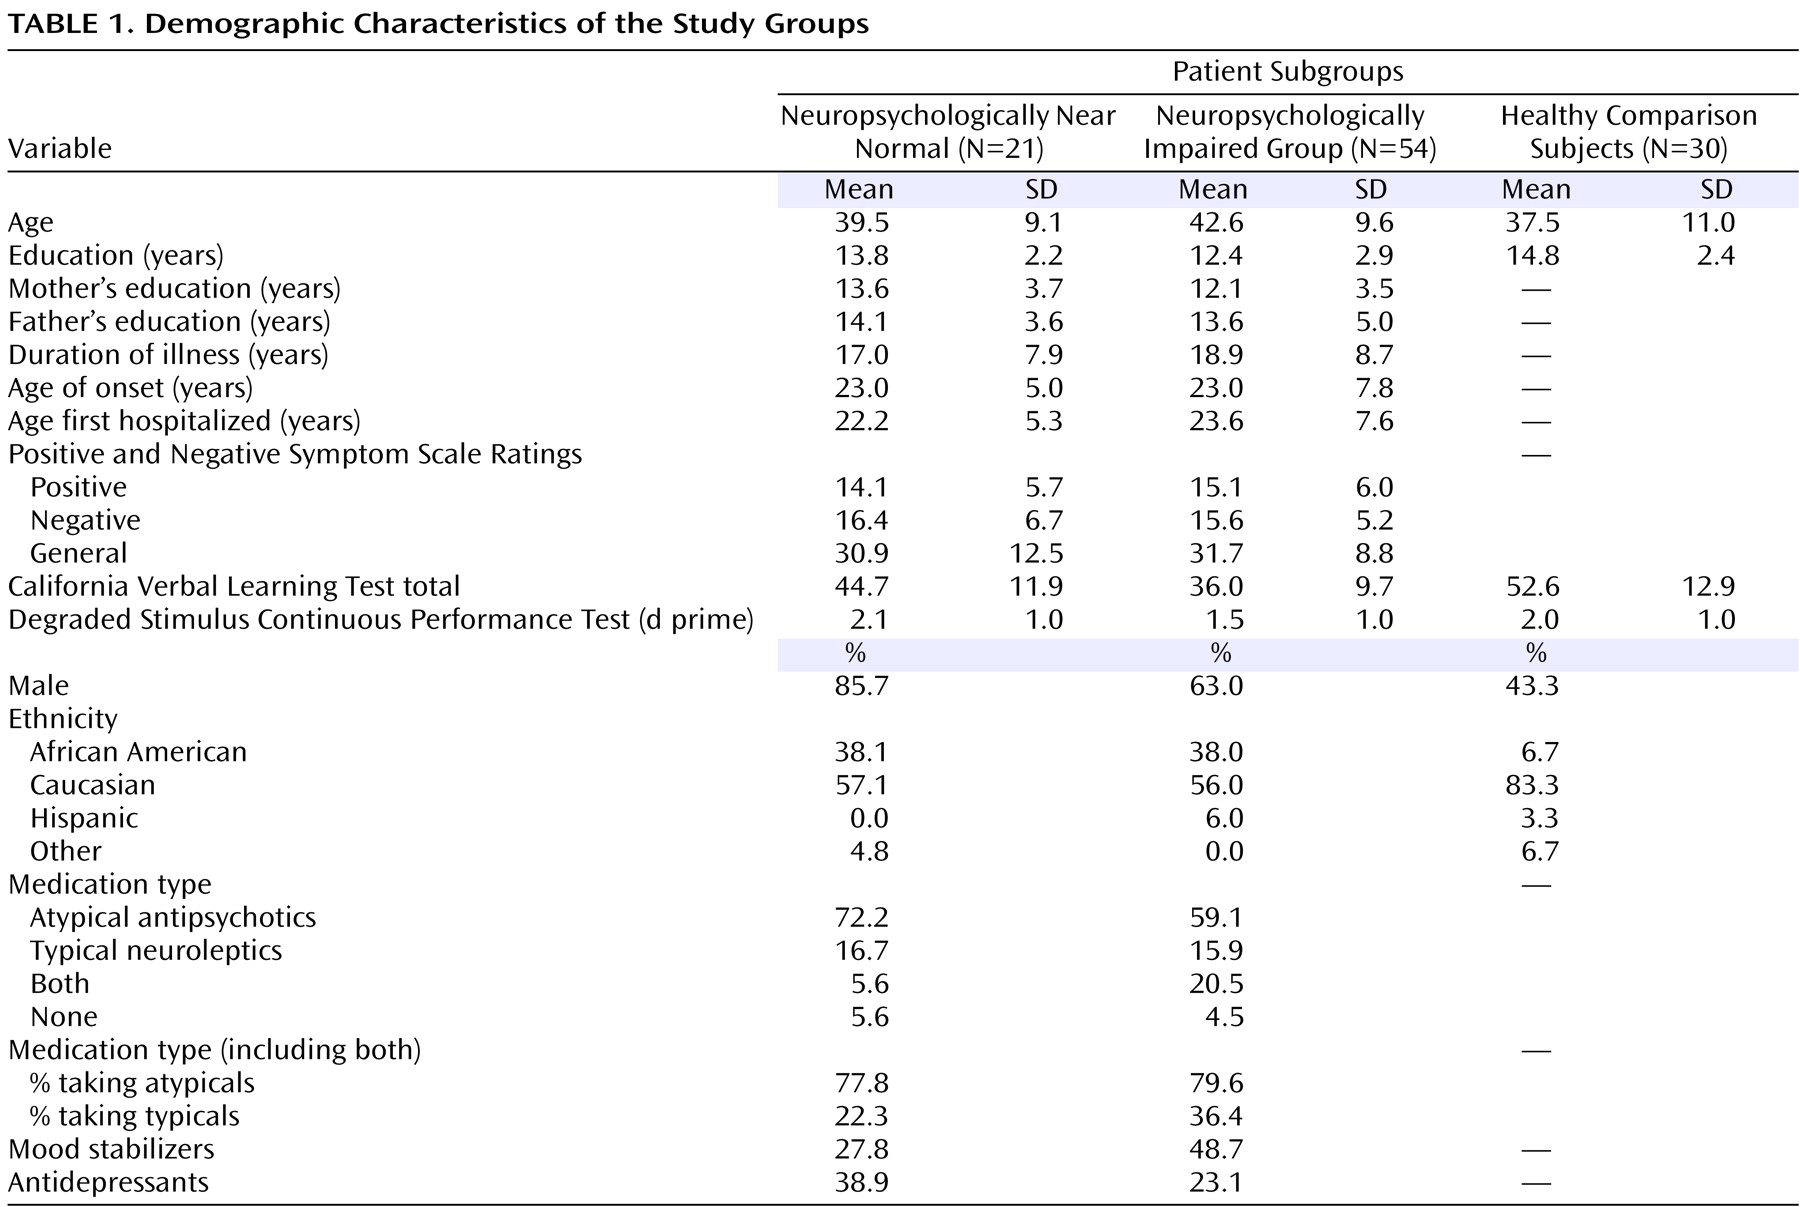
NPNN and NPI patients were similar both clinically and demographically (
Table 1 ). The NPI group contained a higher percentage of women. Although not statistically significant, NPNN patients and their parents were somewhat better educated than NPI patients and their parents. Both patient groups were somewhat less educated than the healthy subjects, and the healthy comparison group contained fewer men and fewer African Americans. Similar percentages of NPNN and NPI patients were receiving atypical antipsychotic medications, although more NPI patients were also receiving typical antipsychotics. Patients receiving the typical antipsychotics did not differ in overall memory scores from those receiving only atypical antipsychotics (p>0.65). More NPI patients were receiving mood stabilizers and more NPNN patients were receiving antidepressant medications, but these differences were not associated with differences in symptom severity at the time of assessment or with the presence of comorbid diagnoses.
Assessment of Brain Structure
Magnetic resonance images (MRIs) were acquired using a single 1.5 T GE Signa LS MRI System (Milwaukee) and a fast spoiled gradient-echo sequence (TR=24 msec, TE=5 msec, 256×192 matrix, field of view=30 cm, two excitations, slice thickness=1.2 mm, no skip, 124 sagittal slices). Analyses were performed on 10 workstations using ANALYZE 8.0 (Rochester, MN). Before region definitions, large-scale variations in image intensity due to refractive index coil and other inhomogeneities were removed. Extracerebral tissues were removed with an isointensity contour function that thresholds cortical gray matter from overlying CSF. Connecting dura and fat were removed manually. The data set was resliced to Talairach standard orientation to correct for residual head rotation, tilt, or flexion/extension.
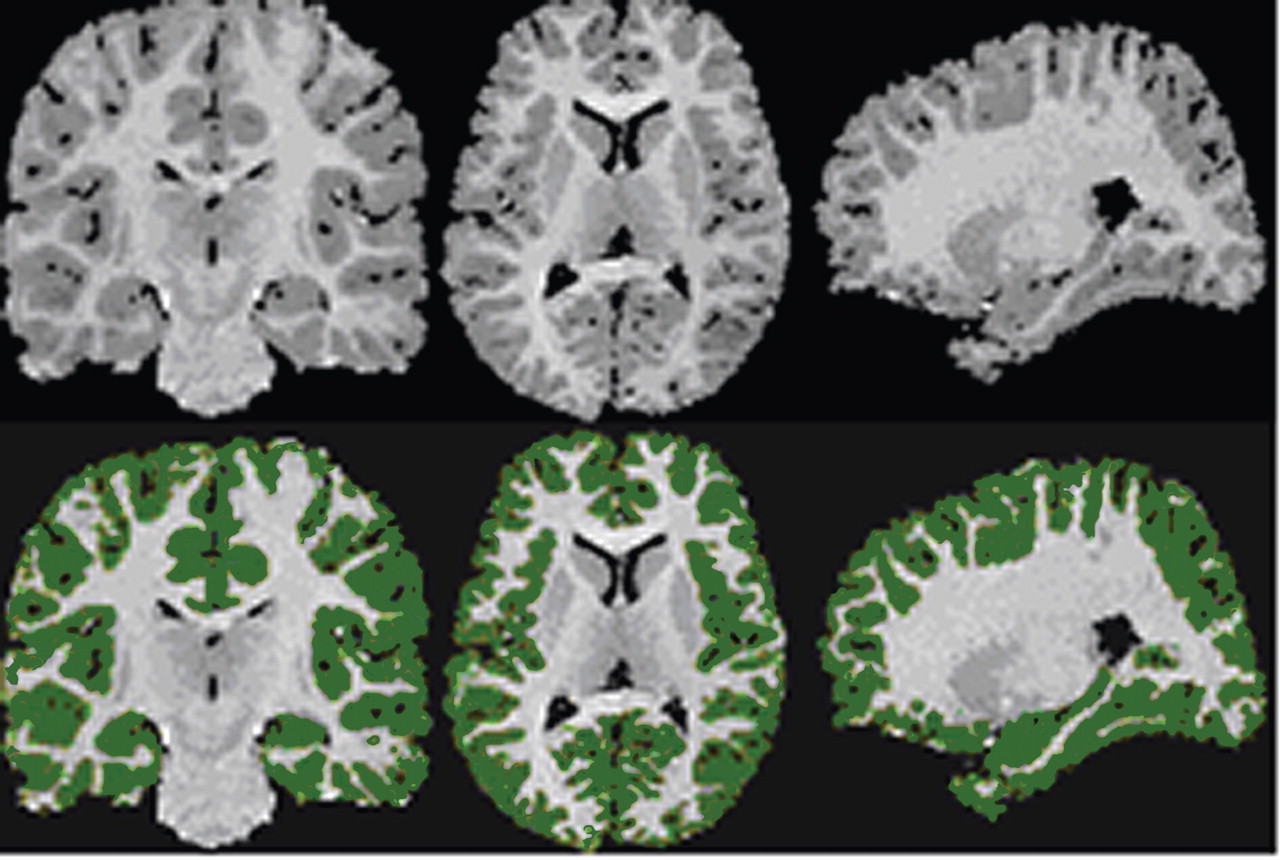
The grayscale values of “pure” representations of cortical gray matter (the cortical ribbon) and white matter were sampled bilaterally in frontal, temporal, occipital, and parietal regions using an 8×8=64 pixel array that was sufficiently large to provide statistical stability but small enough to avoid partial volume effects from other tissue types. These four values were averaged for each tissue type. A global threshold, calculated as the average of mean gray matter and white matter values, was invoked to provide an initial rough classification of gray and white matter. This classification was then hand edited in all three views, primarily to eliminate subcortical gray matter and rims of ventricles (partial volumed white matter and ventricular CSF that is labeled as gray matter in most segmentation algorithms) from the tissue assigned to cortical gray matter. White matter was defined by subtraction of all other structures (cortical gray, subcortical gray, and ventricular CSF) from the isolated cerebrum (
Figure 1 ).
Ventricles were defined with an isointensity contour function and manual editing. The third and fourth ventricles were isolated and lateral ventricles then divided into three sections—frontal horns, midbody, and occipital horns—using coronal planes passing through the anterior and posterior commissures. The temporal horn was separated from the lateral bodies with an axial plane containing the anterior commissure-posterior commissure line.
Using methods described previously
(18,
19), the cerebral hemispheres were divided using a midsagittal curvilnear plane defined with a cubic spline fit to midline landmarks. The cerebrum was divided into eight regions within each hemisphere by the intersections of an axial plane containing the anterior and posterior commissures and three coronal planes: one tangent to the genu of the corpus callosum, one containing the anterior commissure, and one containing the posterior commissure. These three planes demarcated orbitofrontal, dorsal prefrontal, premotor, subgenual, sensorimotor, midtemporal, parietal, and inferior occipital subregions.
A total of four raters were used in these and the other volumetric analyses, with interrater reliability of the measurements assessed on 20 scans each, measured by the four raters and calculated with a two-way random-effects model. Intraclass correlation coefficients (ICC’s) for cerebral subdivisions were all >0.98.
The thalamus was segmented by filtering the entire imaging volume with an anisotropic diffusion filter (unbiased, kappa=2, iterations=20) and then sampling grayscale values of the filtered thalamus and internal capsule throughout the entire three-dimensional extent of these structures, averaging the peaks for white matter and gray matter in that volume. An isointensity contour function at this particular threshold, grown from a seed within the thalamus, provided an initial definition of this structure that was then manually edited. The thalamus was distinguished from the hypothalamus by a line defining the hypothalamic sulcus on sagittal views. The ICC for thalamic definition was 0.91.
The amygdala and hippocampus were defined in the coronal plane with previously published algorithms
(20,
21) . ICC’s were >0.85 for the amygdala and >0.90 for the hippocampus. Difficulty in identifying some key landmarks led to some missing data in three patients.
Statistical Analyses
Differences among patient subgroups and healthy subjects on the California Verbal Learning Test and degraded stimulus version of the Continuous Performance Test scores were evaluated in one-way analyses of variance (ANOVAs) with post hoc pairwise comparisons using Fisher’s protected test of least squares difference.
Differences among the three groups in brain structure were evaluated with linear mixed models separately for cortical gray and white matter subregions, ventricles, hippocampus, amygdala, thalamus, and cerebellum. Gender, age, and height (to control for overall scaling effects) were included in the analytic models because each has known correlates in brain volume. Because of the small number of women, interactions between gender and group were considered unreliable and removed from the models. Significant main effects and interactions of group were followed up with Fisher’s test: p values of <0.05 were used to identify group differences. The ability of the anatomic differences between the two patient groups to discriminate the groups was then evaluated with PROC CANDISC in SAS 9.1 (SAS Institute, Cary, NC), with covariance for age, gender, and height. All tests were two-tailed.


