Comparison of Low and Moderate Dosages of Extended-Release Quetiapine in Borderline Personality Disorder: A Randomized, Double-Blind, Placebo-Controlled Trial
Abstract
Objective:
Method:
Results:
Conclusions:
Method
Inclusion and Exclusion Criteria
Efficacy Assessments
Safety Measures
Statistical Analysis
Results
| Variable | Placebo (N=29) | Low-Dosage Quetiapine (150 mg/day) (N=33) | Moderate-Dosage Quetiapine (300 mg/day) (N=33) | |||
|---|---|---|---|---|---|---|
| Mean | SD | Mean | SD | Mean | SD | |
| Age (years) | 30.1 | 8.8 | 28.2 | 8.0 | 30.2 | 8.1 |
| Age at onset (years) | 14.6 | 6.6 | 12.2 | 3.7 | 12.2 | 5.0 |
| Duration of illness (years) | 16.2 | 8.9 | 15.4 | 9.4 | 17.9 | 8.5 |
| Education (years) | 14.5 | 1.7 | 14.3 | 2.7 | 14.1 | 3.0 |
| N | % | N | % | N | % | |
| Male | 10 | 34 | 8 | 24 | 10 | 30 |
| Race/ethnicity | ||||||
| European-Caucasian | 22 | 79 | 26 | 79 | 26 | 79 |
| Other | 6 | 21 | 7 | 21 | 7 | 21 |
| Marital status | ||||||
| Single | 20 | 74 | 26 | 79 | 18 | 56 |
| Married | 2 | 7 | 4 | 12 | 6 | 19 |
| Other | 5 | 19 | 3 | 9 | 8 | 25 |
| Any past psychiatric hospitalization | 7 | 24 | 13 | 39 | 13 | 39 |
| Lifetime psychiatric axis I disorders | ||||||
| Mood disorders | 14 | 48 | 25 | 76 | 19 | 58 |
| Anxiety disorders | 5 | 17 | 5 | 15 | 5 | 15 |
| Substance use disorders | 6 | 21 | 11 | 33 | 13 | 39 |
| Any axis I disorder | 19 | 66 | 29 | 88 | 28 | 85 |
| Placebo (N=29) | Low-Dosage Quetiapine (150 mg/day) (N=33) | Moderate-Dosage Quetiapine (300 mg/day) (N=33) | Analysis | ||||||
|---|---|---|---|---|---|---|---|---|---|
| Measure | Mean | SD | Mean | SD | Mean | SD | F | df | p |
| Zanarini scalea | |||||||||
| Total score | 14.6 | 4.8 | 15.8 | 3.4 | 17.7 | 5.3 | 3.7 | 2,92 | 0.029 |
| Affective disturbance score | 6.3 | 2.0 | 6.4 | 1.3 | 7.2 | 1.8 | 2.5 | 2,92 | 0.092 |
| Cognitive disturbance score | 3.1 | 1.7 | 3.5 | 1.4 | 4.0 | 1.9 | 2.1 | 2,92 | 0.130 |
| Impulsivity score | 1.7 | 0.9 | 1.8 | 1.1 | 2.2 | 1.3 | 2.2 | 2,92 | 0.115 |
| Disturbed relationship score | 3.5 | 1.4 | 4.0 | 1.4 | 4.3 | 1.5 | 2.4 | 2,92 | 0.093 |
| Zanarini scale,a self-rated | |||||||||
| Total score | 11.8 | 6.6 | 14.4 | 5.1 | 17.8 | 6.3 | 7.7 | 2,92 | 0.001 |
| Affective disturbance score | 5.3 | 2.5 | 6.1 | 2.2 | 7.7 | 2.5 | 7.7 | 2,91 | 0.001 |
| Cognitive disturbance score | 2.4 | 2.2 | 3.1 | 2.2 | 3.7 | 2.1 | 2.5 | 2,91 | 0.088 |
| Impulsivity score | 1.5 | 1.4 | 1.5 | 1.3 | 2.3 | 1.6 | 2.9 | 2,91 | 0.061 |
| Disturbed relationship score | 2.6 | 1.8 | 3.8 | 1.7 | 4.2 | 2.2 | 5.7 | 2,91 | 0.005 |
| Borderline Evaluation of Severity Over Time | |||||||||
| Total score | 32.6 | 10.6 | 36.6 | 9.6 | 40.9 | 12.0 | 4.6 | 2,92 | 0.013 |
| Thoughts and feelings score | 18.7 | 7.1 | 21.7 | 6.1 | 24.2 | 8.0 | 4.5 | 2,92 | 0.014 |
| Negative behaviors score | 7.1 | 2.7 | 8.8 | 3.0 | 9.9 | 3.8 | 5.8 | 2,92 | 0.004 |
| Positive behaviors score | 8.3 | 3.0 | 8.9 | 2.5 | 8.2 | 2.5 | 0.7 | 2,92 | 0.505 |
| Montgomery-Åsberg Depression Rating Scale | 15.0 | 6.7 | 16.9 | 5.6 | 18.8 | 7.2 | 2.7 | 2,91 | 0.075 |
| Modified Overt Aggression Scale | 11.3 | 9.2 | 18.7 | 14.9 | 22.6 | 17.8 | 4.7 | 2,91 | 0.011 |
| Young Mania Rating Scale | 3.6 | 2.9 | 3.3 | 2.8 | 4.4 | 3.6 | 1.1 | 2,91 | 0.346 |
| Global Assessment of Functioning Scale | 62.3 | 6.0 | 61.1 | 7.9 | 58.4 | 6.4 | 2.6 | 2,91 | 0.078 |
| Barratt Impulsiveness Scale | 74.8 | 9.3 | 71.7 | 14.5 | 79.9 | 17.4 | 2.7 | 2,91 | 0.070 |
| Symptom Checklist–90–Revised | 1.0 | 0.7 | 1.3 | 0.6 | 1.7 | 0.7 | 7.3 | 2,91 | 0.001 |
| Sheehan Disability Scale | |||||||||
| Total score | 13.0 | 5.5 | 16.7 | 5.2 | 17.2 | 6.2 | 4.8 | 2,91 | 0.010 |
| Work/school | 3.3 | 2.1 | 4.5 | 2.7 | 5.3 | 2.8 | 4.2 | 2,81 | 0.019 |
| Social life | 0.1 | 0.3 | 0.1 | 0.4 | 0.2 | 0.4 | 0.6 | 2,79 | 0.538 |
| Family life/home responsibilities | 4.9 | 2.4 | 6.0 | 2.4 | 6.3 | 2.5 | 2.9 | 2,92 | 0.058 |
| Days lost | 5.2 | 2.3 | 6.6 | 2.2 | 6.3 | 2.7 | 3.0 | 2,92 | 0.054 |
| Days unproductive | 1.2 | 1.7 | 4.0 | 6.5 | 5.6 | 7.6 | 4.2 | 2,87 | 0.018 |
Adverse Events
| Placebo (N=29) | Low-Dosage Quetiapine (150 mg/day) (N=33) | Moderate-Dosage Quetiapine (300 mg/day) (N=33) | Total | Related to Study Drug | ||||||
|---|---|---|---|---|---|---|---|---|---|---|
| Event | N | % | N | % | N | % | N | % | N | % |
| Any adverse event | 25 | 86 | 29 | 88 | 30 | 91 | 84 | 88 | 78 | 82 |
| Sedation | 15 | 52 | 25 | 76 | 28 | 85 | 68 | 71 | 67 | 70 |
| Change in appetite | 4 | 14 | 9 | 27 | 13 | 39 | 26 | 27 | 25 | 26 |
| Dry mouth | 1 | 3 | 9 | 27 | 14 | 42 | 24 | 25 | 24 | 25 |
| Headache | 8 | 28 | 7 | 21 | 13 | 39 | 28 | 29 | 23 | 24 |
| Bodily pain | 12 | 41 | 11 | 33 | 12 | 36 | 35 | 37 | 20 | 21 |
| Hypersomnia | 3 | 10 | 5 | 15 | 8 | 24 | 16 | 17 | 15 | 16 |
| Dizziness | 1 | 3 | 5 | 15 | 7 | 21 | 13 | 14 | 13 | 14 |
| Forgetfulness or confusion | 3 | 10 | 6 | 18 | 5 | 15 | 14 | 15 | 12 | 13 |
| Nausea or vomiting | 8 | 28 | 8 | 24 | 9 | 27 | 25 | 26 | 12 | 13 |
| Cold/flu symptoms | 4 | 14 | 8 | 24 | 7 | 21 | 19 | 20 | 0 | 0 |
Study Discontinuation
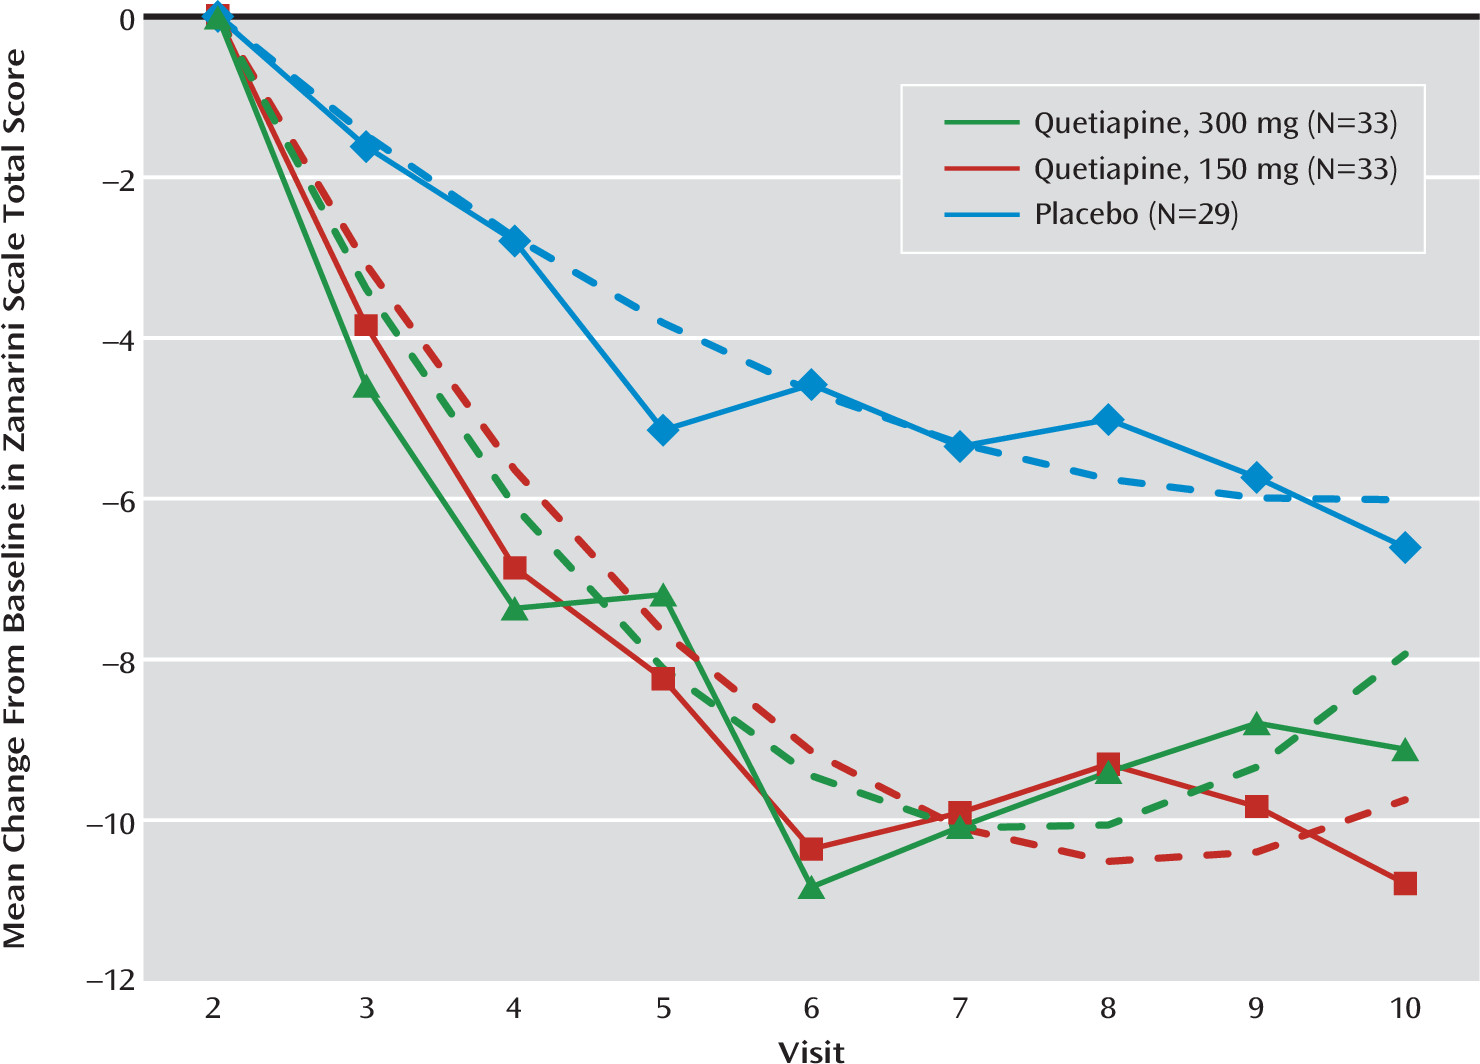
Efficacy Results

| Mean Change per Week | Low-Dosage Quetiapine Versus Placebo | Moderate-Dosage Quetiapine Versus Placebo | ||||||||||
|---|---|---|---|---|---|---|---|---|---|---|---|---|
| Placebo | Low-Dosage Quetiapine (150 mg/day) | Moderate-Dosage Quetiapine (300 mg/day) | ||||||||||
| Measure | Estimate | SE | Estimate | SE | Estimate | SE | d | SE | p | d | SE | p |
| Zanarini scale | ||||||||||||
| Total score | –0.75 | 0.15 | –1.22 | 0.15 | –0.99 | 0.16 | –0.79 | 0.36 | 0.031 | –0.41 | 0.36 | 0.265 |
| Affective disturbance | –0.32 | 0.06 | –0.48 | 0.07 | –0.38 | 0.07 | –0.78 | 0.42 | 0.068 | –0.32 | 0.43 | 0.456 |
| Cognitive disturbance | –0.21 | 0.04 | –0.34 | 0.04 | –0.30 | 0.04 | –0.63 | 0.28 | 0.023 | –0.43 | 0.28 | 0.127 |
| Impulsivity | –0.09 | 0.03 | –0.14 | 0.03 | –0.13 | 0.03 | –0.37 | 0.26 | 0.156 | –0.30 | 0.27 | 0.269 |
| Disturbed relationship | –0.18 | 0.05 | –0.32 | 0.05 | –0.27 | 0.05 | –0.75 | 0.38 | 0.051 | –0.48 | 0.38 | 0.204 |
| Zanarini scale, self-rated | ||||||||||||
| Total score | –0.58 | 0.18 | –1.29 | 0.18 | –1.28 | 0.19 | –0.88 | 0.32 | 0.006 | –0.87 | 0.32 | 0.007 |
| Affective disturbance | –0.25 | 0.08 | –0.47 | 0.08 | –0.53 | 0.09 | –0.70 | 0.34 | 0.040 | –0.87 | 0.34 | 0.013 |
| Cognitive disturbance | –0.15 | 0.06 | –0.34 | 0.06 | –0.35 | 0.06 | –0.71 | 0.29 | 0.016 | –0.73 | 0.29 | 0.013 |
| Impulsivity | –0.10 | 0.04 | –0.17 | 0.04 | –0.16 | 0.04 | –0.39 | 0.30 | 0.191 | –0.35 | 0.29 | 0.232 |
| Disturbed relationship | –0.14 | 0.05 | –0.36 | 0.05 | –0.32 | 0.05 | –0.86 | 0.27 | 0.002 | –0.73 | 0.27 | 0.008 |
| Borderline Evaluation of Severity Over Time | ||||||||||||
| Total score | –0.91 | 0.31 | –2.10 | 0.32 | –1.97 | 0.33 | –0.85 | 0.32 | 0.009 | –0.75 | 0.32 | 0.020 |
| Thoughts and feelings | –0.46 | 0.20 | –1.29 | 0.20 | –1.21 | 0.21 | –0.90 | 0.31 | 0.004 | –0.82 | 0.31 | 0.009 |
| Negative behaviors | –0.18 | 0.08 | –0.41 | 0.08 | –0.39 | 0.08 | –0.55 | 0.28 | 0.054 | –0.49 | 0.28 | 0.079 |
| Positive behaviors | 0.25 | 0.08 | 0.42 | 0.08 | 0.35 | 0.09 | 0.52 | 0.35 | 0.146 | 0.30 | 0.36 | 0.407 |
| Montgomery-Åsberg Depression Rating Scaleb | –0.59 | 0.18 | –0.85 | 0.19 | –1.05 | 0.19 | –0.31 | 0.32 | 0.328 | –0.56 | 0.32 | 0.083 |
| Modified Overt Aggression Scaleb | –0.37 | 0.43 | –1.92 | 0.42 | –1.82 | 0.43 | –0.82 | 0.32 | 0.014 | –0.76 | 0.32 | 0.020 |
| Young Mania Rating Scaleb | –0.11 | 0.06 | –0.26 | 0.06 | –0.30 | 0.06 | –0.40 | 0.21 | 0.060 | –0.50 | 0.21 | 0.019 |
| Global Assessment of Functioning Scaleb | 0.62 | 0.19 | 1.05 | 0.20 | 1.04 | 0.21 | 0.49 | 0.33 | 0.135 | 0.49 | 0.33 | 0.141 |
| Barratt Impulsiveness Scaleb | –0.59 | 0.26 | –0.73 | 0.27 | –0.83 | 0.27 | –0.08 | 0.21 | 0.719 | –0.13 | 0.21 | 0.536 |
| Symptom Checklist–90–Revised | –0.07 | 0.02 | –0.11 | 0.02 | –0.12 | 0.02 | –0.47 | 0.28 | 0.099 | –0.62 | 0.29 | 0.033 |
| Sheehan Disability Scaleb | ||||||||||||
| Total score | –0.58 | 0.18 | –0.85 | 0.19 | –1.11 | 0.20 | –0.38 | 0.37 | 0.310 | –0.72 | 0.37 | 0.054 |
| Work/school | –0.10 | 0.07 | –0.28 | 0.08 | –0.28 | 0.08 | –0.56 | 0.32 | 0.081 | –0.55 | 0.31 | 0.088 |
| Social life | –0.22 | 0.08 | –0.27 | 0.09 | –0.36 | 0.09 | –0.17 | 0.40 | 0.679 | –0.46 | 0.40 | 0.255 |
| Family life/home responsibilities | –0.25 | 0.07 | –0.31 | 0.08 | –0.45 | 0.08 | –0.19 | 0.36 | 0.591 | –0.66 | 0.36 | 0.073 |
| Days lost | 0.05 | 0.11 | –0.33 | 0.12 | –0.36 | 0.12 | –0.49 | 0.21 | 0.025 | –0.54 | 0.21 | 0.012 |
| Days unproductive | –0.33 | 0.21 | –0.58 | 0.23 | –0.88 | 0.23 | –0.26 | 0.32 | 0.424 | –0.55 | 0.31 | 0.086 |
Safety Results
Discussion
Acknowledgments
Footnote
References
Information & Authors
Information
Published In
History
Authors
Funding Information
Metrics & Citations
Metrics
Citations
Export Citations
If you have the appropriate software installed, you can download article citation data to the citation manager of your choice. Simply select your manager software from the list below and click Download.
For more information or tips please see 'Downloading to a citation manager' in the Help menu.
View Options
View options
PDF/EPUB
View PDF/EPUBLogin options
Already a subscriber? Access your subscription through your login credentials or your institution for full access to this article.
Personal login Institutional Login Open Athens loginNot a subscriber?
PsychiatryOnline subscription options offer access to the DSM-5-TR® library, books, journals, CME, and patient resources. This all-in-one virtual library provides psychiatrists and mental health professionals with key resources for diagnosis, treatment, research, and professional development.
Need more help? PsychiatryOnline Customer Service may be reached by emailing [email protected] or by calling 800-368-5777 (in the U.S.) or 703-907-7322 (outside the U.S.).

