Abundant postmortem evidence (
1) and some genetic (
2,
3) and pharmacological studies (
4) point to a role of GABA in the pathophysiology of schizophrenia. The strongest evidence to date comes from studies showing reduction in postmortem brain of mRNA for the
GAD1 gene, which encodes the enzyme that synthetizes GABA (
1). Obtaining in vivo data to corroborate the postmortem evidence would be important in ruling out epiphenomena related to postmortem tissue and would be key to translation of the current body of knowledge on the pathophysiology of GABA-ergic interneurons in schizophrenia to biomarkers of illness, predictors of treatment response, or monitoring of new treatments based on GABA-ergic mechanisms. However, the tools currently available for investigating the GABA-ergic system in vivo are limited. Electrophysiological methods provide indirect and inferential evidence of the involvement of inhibitory neuronal systems in schizophrenia (
5). The only direct in vivo assessments of GABA-ergic systems are the distribution of benzodiazepine receptors (where no differences between patients and controls were found [
6]), the use of radioactively labeled ligands of these receptors that are sensitive to GABA level changes induced by GABA-acting drugs (
7–
9), and overall GABA levels measured with magnetic resonance spectroscopy (MRS). Several MRS studies have been published, with variable results as to the presence, regional distribution, and directionality of change of GABA levels in schizophrenia.
While some studies (
10–
12) found no differences in patients with schizophrenia compared with healthy controls, others found reduced levels in the occipital (
13,
14) and prefrontal (
15) cortices (including the dorsal anterior cingulate cortex in patients over 35 years of age [
16]) and in the basal ganglia (
17). In contrast, our preliminary data in a small group of patients who do not overlap with the ones presented here (
18) showed elevated GABA levels in the dorsal anterior cingulate in treated patients with psychosis compared with healthy controls. Two additional investigations also found increases in the medial prefrontal cortex (
19) and the dorsal anterior cingulate (
20). Kegeles et al. (
19) found this increase only in patients who were not taking medication, raising the possibility that treatment with antipsychotics may reduce GABA levels in vivo. Further evidence supporting this possibility was the finding of a negative correlation between chlorpromazine equivalent dosage of antipsychotic drugs and GABA level in the dorsal anterior cingulate (
10). However, this phenomenon was not observed in other studies based on smaller numbers of subjects (
13,
20,
21).
If alterations of GABA levels in the prefrontal cortex do exist in schizophrenia, there are currently limited data to support whether these are heritable, which would elevate them to a more likely primary alteration, implying some degree of causality and consequently greater plausibility as a potential therapeutic target. Marenco et al. (
22,
23) showed that single-nucleotide polymorphisms in
GAD1 and
ErbB4 linked with increased risk for schizophrenia were associated with elevated GABA levels in the dorsal anterior cingulate, but these results were observed in healthy subjects. These data may support the reported increase in GABA levels in the prefrontal cortex of patients with schizophrenia (
19,
20) and imply that this increase may have genetic underpinnings. Therefore, studying unaffected relatives of patients with schizophrenia could be important in supporting a genetic basis for these purported changes in GABA levels, particularly if an “intermediate phenotype” were to be found (
24).
To address the inconsistencies and open issues in the literature, we investigated three main questions:
1.
Are GABA levels in the dorsal anterior cingulate cortex altered in patients with psychosis?
2.
Are GABA levels altered in unaffected siblings of patients with psychosis?
3.
How does antipsychotic treatment affect GABA levels?
Based on our preliminary data, previous studies in medicated patients (
18,
20), our genetic data in controls (
22,
23)—all acquired in the dorsal anterior cingulate—and results of untreated patients in the medial prefrontal cortex (
19), we hypothesized that GABA levels would be increased in treated and untreated patients with schizophrenia as compared with healthy controls and that if this were a reflection of increased genetic risk, then levels in unaffected siblings would fall somewhere in between. We also hypothesized that antipsychotic treatment would decrease GABA levels, and we tested this hypothesis by studying the relationship between antipsychotic dosage and GABA levels in treated patients, and additionally comparing GABA levels on and off medications in a subset of patients scanned in both conditions.
Method
Participants
We report here on all participants acquired during the Clinical Brain Disorders Branch sibling study (protocols 95M0150 and 00M0085, NCT00001486) and inpatient studies (protocol 89M0160, NCT00001247) who had signed informed consent (CNS institutional review board approved) for these protocols and had good quality MRS scans. All subjects were ascertained with a structured diagnostic interview for diagnosis. This resulted in groups of 184 healthy controls, 31 unaffected siblings, and 83 patients with psychosis, all of whom were taking antipsychotics at the time of study. Twenty-five patients were medication free for at least 14 days at the time of the MRS scan. Most patients in this group (N=16) were acquired as part of a double-blind crossover design for treatment effects (the “coded medication protocol”), in which patients were taking placebo or a single antipsychotic for 4–6 weeks in each phase. (Further details are provided in the Supplementary Methods section of the
data supplement that accompanies the online edition of this article.) In order to have independent observations, we removed patients from the treated group for whom we also had data in the untreated patient group. This reduced the treated patient group to 70 patients (
Tables 1 and
2).
Probands had a DSM-IV diagnosis of schizophrenia, schizoaffective disorder, or a restrictive definition of psychosis not otherwise specified (patients who met at least one DSM-IV criterion A symptom for schizophrenia and whose psychotic symptoms were not related to substances of abuse, mood dysregulation, or a general medical condition). Unaffected siblings of probands and healthy volunteers had no prior psychiatric history, including substance abuse, and were not taking any psychotropic medications at the time of scan. Subjects were excluded if they had any contraindications to MRI, a history of significant head trauma, or a medical condition likely to affect brain perfusion or function. Other exclusion criteria are reported in the Supplementary Methods section of the data supplement.
Of the medication-free patients, 17 (11 of them male; mean age, 29.5 years [SD=9.5]) had participated successfully in at least two scans, one while on a single antipsychotic and the other while off all medications. In 15 patients, the time off all medications ranged from 14 to 29 days, and in two patients, it was more than 1 year. Table S1 in the data supplement summarizes the sample’s basic demographic and clinical characteristics.
Symptoms were rated with the Positive and Negative Syndrome Scale (PANSS) (
25) by trained clinicians or nurses who were blind to the phase of the coded medication protocol. PANSS ratings were summarized in six scores based on factor analysis of a large data set (
26).
MRI Scanning
The full details of the acquisition have been reported previously (
27). Briefly, participants underwent single-voxel MRS in a 3-T GE whole-body scanner using a quadrature transmit-receive head coil (IGC-Medical Advances, Milwaukee, Wisc.). To position the spectroscopic voxels, high-resolution T
1 structural images were acquired using a three-dimensional spoiled gradient (SPGR) pulse sequence (TR=24 ms, TE=3.2 ms, flip angle=17 degrees, in-plane resolution=0.9×0.9 mm
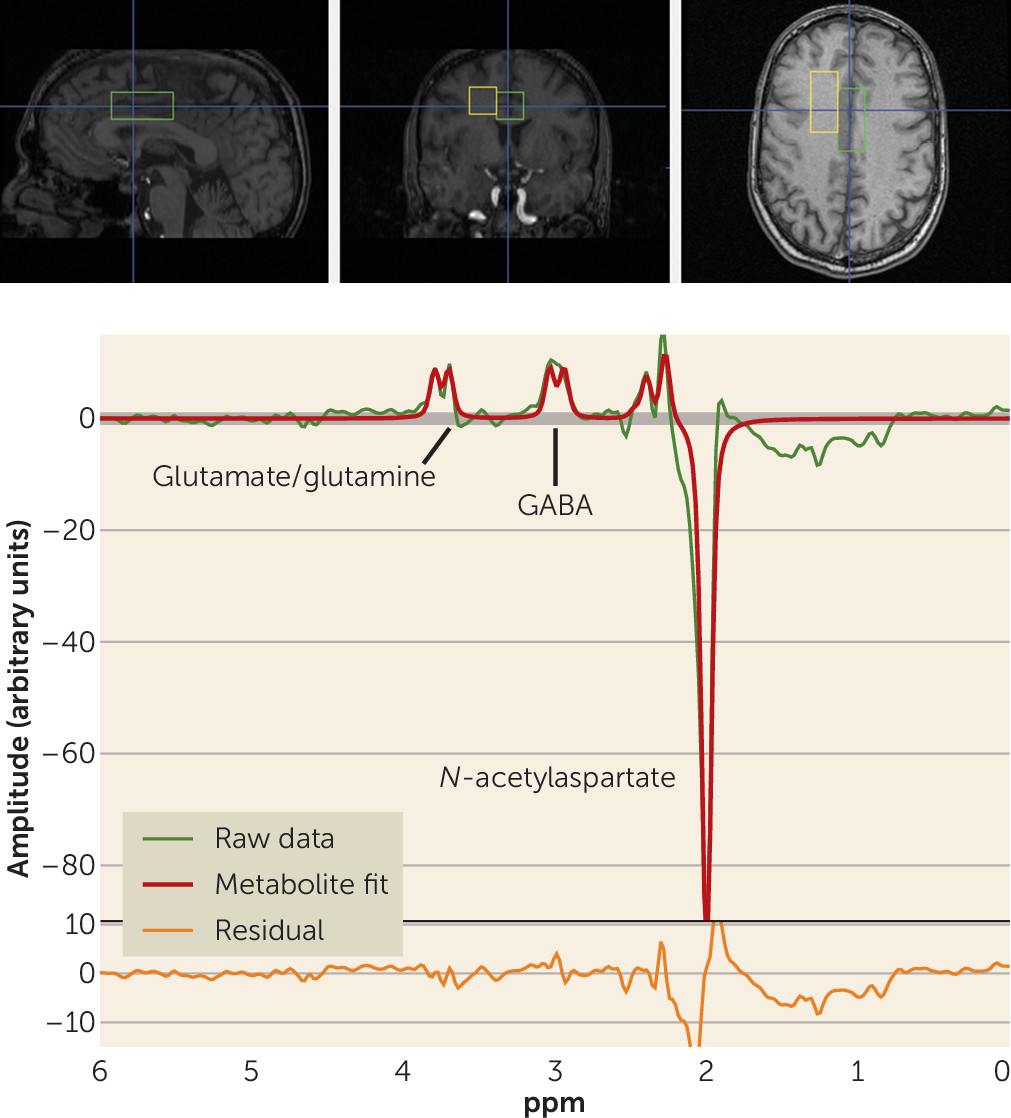
2, 192×256 matrix, FOV=240 mm, slice thickness=2 mm). MRS spectra were acquired from two voxels, each measuring 2×2×4.5 cm (18 cm
3). One voxel included mainly gray matter of the anterior cingulate cortex and medial prefrontal cortex (see the Supplementary Methods section in the
data supplement). Another voxel was placed in the right frontal white matter (
Figure 1). Here we report data from the anterior cingulate voxel alone, since the white matter voxel was chosen as a control region where no effect was expected and no GABA effect was found.
To measure the level of GABA+ (i.e., including signal from unrelated proteins or macromolecules), an interleaved point-resolved spectroscopy (PRESS)-based J-editing method (
27) was used (see the Supplementary Methods section and Figures S1 and S2 in the
data supplement). The scan detects the full amplitude of the two side peaks of the GABA-4 protons. Macromolecules appear to contribute about 40% of the GABA signal at 3.0 ppm (
28). Each voxel was acquired 776 times. Of these, 384 were water-suppressed “editing-pulse-on” acquisitions, 384 were water-suppressed “editing-pulse-off” acquisitions, and eight were non–water-suppressed acquisitions. In all acquisitions, echo time was 68 ms and repetition time was 1.5 seconds.
Data Processing
The average of the “editing-pulse-off” acquisitions was subtracted from the average of the “editing-pulse-on” acquisitions to create an “edited” signal. Full details and quality control procedures are provided in the Supplementary Methods section in the
data supplement. The processing yielded arbitrary, unscaled values for GABA+, creatine, and water (from the non–water-suppressed acquisitions; see
Figure 1).
To determine the tissue composition of the voxels, SPGR images were segmented into gray matter, white matter, and CSF with SPM5 (
29). The volume of each tissue class relative to the total voxel volume was computed. The values for creatine and GABA+ were divided by the percentage of tissue in the voxel (gray matter plus white matter) to adjust for the amount of CSF in the spectroscopic voxel. We also calculated the proportion of tissue occupied by gray matter as percent gray matter divided by gray plus white matter.
The brain water signal from the scans without water suppression was used as an internal reference for the metabolite signals. We corrected the water signal for the relative contribution of gray matter, white matter, and CSF based on the formula described in reference
27, using values derived from the literature for the relaxometry properties of brain tissue and CSF at 3 T. (For details and references, see the Supplementary Methods section in the
data supplement.)
Statistical Analysis
To answer the questions regarding differences between healthy controls, patients, and siblings, backward stepwise multiple regression models were used, allowing for all two-way interactions, removing effects when p was >0.1 and forcing the main effects of independent variables in the model. Three dependent variables were analyzed: GABA+ normalized to creatine and to water, and creatine normalized to water. The rationale for choosing these dependent variables is further explained in the Supplementary Methods section of the data supplement.
Independent variables were diagnostic group (healthy controls, siblings, treated and untreated patients), sex, age, gray matter as a percentage of tissue, and y position of the voxel centroid (using Montreal Neurological Institute coordinates). This analysis was repeated for the three dependent variables of interest. In addition, we removed two-way interactions that were highly collinear (tolerance value <0.1 or variance inflation factor >5) with one of the main effects from the model to improve interpretability of the data. The p values for overall significance of the models are reported with a Bonferroni correction for three multiple comparisons. Multiple comparison corrections for the post hoc contrasts were performed with Dunnett’s test.
To assess the degree of familiality of MRS measures, we calculated the intraclass correlation coefficient for the available sibling-proband pairs. The statistical significance of this statistic was determined with an F test (df=15, 16). Whenever untreated patient data were available for analysis, they were chosen over the treated patient data for this analysis.
To address the third question, on the effects of antipsychotics on GABA levels, we investigated effects of antipsychotic dosage in chlorpromazine equivalents within the full group of 83 treated patients (see Table S2 in the online data supplement). Multiple regression models similar to those described above were used, adding antipsychotic dosage as a separate independent variable. Paired t tests were used to compare metabolite levels (GABA+/creatine, GABA+/water, and creatine/water) on and off antipsychotics.
To assess whether symptoms in the patient groups might be predicted by GABA+ levels in the anterior cingulate cortex, we conducted exploratory analyses using symptoms at the time of scanning as the dependent variable and age, sex, antipsychotic dosage in chlorpromazine equivalents (where applicable), and the individual metabolites as the independent variables. We repeated this analysis separately for the untreated patients (see the Supplementary Methods section in the data supplement). All statistics and plots were generated with Statistica, version 11 or 12 (Statsoft, Inc., Tulsa, Okla.) or Microsoft Excel.
Results
Demographic and clinical characteristics for single scan cohorts are detailed in
Tables 1 and
2. The groups did not differ in age, ethnicity, family socioeconomic status, and gray matter as a percentage of tissue, but patient groups were more likely to be male, to be unemployed, to have lower education levels, to be smokers, to have a greater proportion of CSF in the measured voxel, and to have their voxels more anteriorly placed. Treated patients had generally mild to moderate symptoms and were treated with standard dosages of mostly atypical antipsychotics; 80% were treated with other medications in addition to antipsychotics. Untreated patients had more disorganized and excited-hostile symptoms compared with treated ones. Table S1 in the
data supplement summarizes the demographic and clinical data for the on-off medication studies.
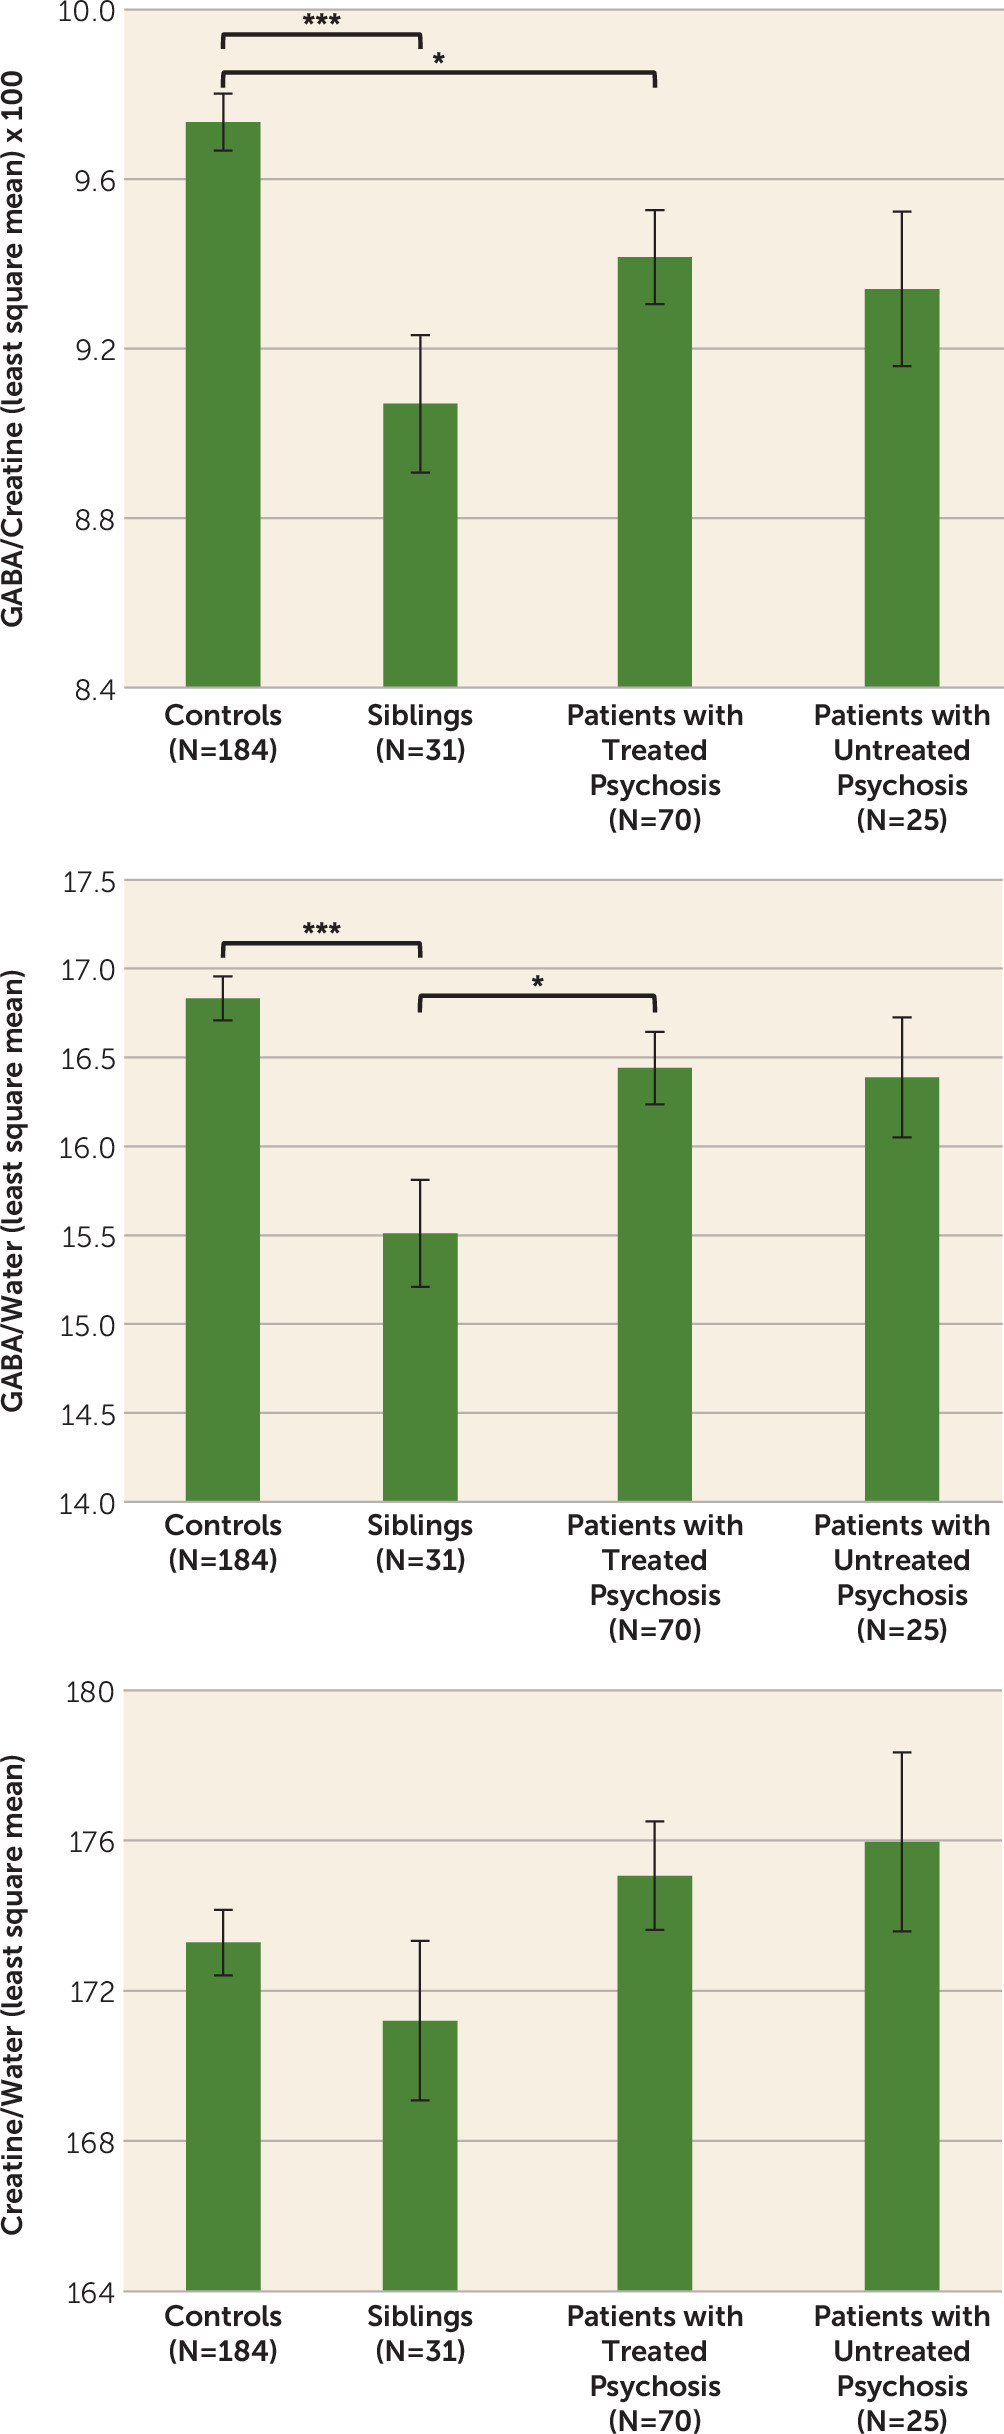
Detailed results are reported in
Table 3 and
Figure 2. A significant main effect of diagnosis was found for GABA+/creatine and GABA+/water, but not for creatine/water. Post hoc tests revealed that treated patients had lower GABA+/creatine than controls (p<0.02) but GABA+/water did not differ between these groups. Untreated patients did not differ significantly from healthy controls on either GABA measure. Siblings had significantly lower values than controls for both GABA+/creatine (p<0.001) and GABA+/water (p<0.001). Siblings also had significantly reduced GABA+/water levels compared with treated patients (p<0.04). These results did not change when we removed statistical outliers (one outlier three standard deviations from the mean of the entire sample for GABA/creatine and one for GABA/water, both in the control group); a sibling, a patient, and a control subject with poor quality GABA peak spectral fitting (Cramer-Rao lower bounds for GABA >5.5%); patients with psychosis not otherwise specified; and the latter’s siblings (see Table S3 in the
data supplement). Patients with psychosis not otherwise specified did not differ from other patients in all dependent variables and covariates included in the models. The intraclass correlation for the 16 available sibling-proband pairs was 0.36 (p<0.045) for GABA/creatine, −0.008 (n.s.) for GABA/water and 0.177 (n.s.) for creatine/water.
Antipsychotic dosage (in chlorpromazine equivalents) was significantly associated with GABA+/creatine, where the higher the dosage, the lower the GABA+/creatine (see Figure S3 in the data supplement; overall model: adjusted R2=0.17, F=4.2, df=5, 73, p<0.003; effect of antipsychotic dosage: p<0.04, β=−0.22, partial eta2=0.056). For GABA+/water, the overall model was not significant (adjusted R2=0.016, F=1.3, df=5, 73, p<0.3), but the directionality of the effect was similar (p<0.07, β=−0.21, partial eta2=0.046) to GABA+/creatine. Creatine/water was not affected by antipsychotic dosage (univariate p=1), although the overall model was significant. The results were similar when patients receiving anticonvulsants or benzodiazepines were excluded from the sample (N=53; for the effect of antipsychotic dosage on GABA/creatine, partial eta2=0.063; on GABA/water, partial eta2=0.024). None of the additional medication categories (antidepressants, benzodiazepines, anticonvulsants, lithium, anticholinergics, other) were significantly related to GABA measures if antipsychotic dosage was accounted for in the model. No statistically significant differences were observed between scans on and off antipsychotics on any of the dependent variables with simple paired t tests (see Table S5 in the data supplement), although GABA+/creatine was nonsignificantly higher on medications than off (p<0.07).
Symptoms were not significantly associated with any of the metabolites in the multivariate analysis of the 83 treated patients. In the 25 untreated patients, positive symptoms were positively associated with GABA+/creatine (overall p<0.017; effect of GABA+/creatine, p<0.05, β=0.39, with GABA+/creatine accounting for 13% of the variance and age for another 20%), but this did not survive correction for multiple comparisons.
Discussion
We report a study of GABA levels measured with in vivo proton spectroscopy in a relatively large group of patients with schizophrenia, a small group of healthy siblings of schizophrenia patients, and a relatively large healthy control sample. Below, we discuss our results in the context of the principal questions that we attempted to address in the study.
Are GABA Levels in the Dorsal Anterior Cingulate Cortex Altered in Patients With Psychosis?
Contrary to our initial hypothesis and our earlier data, the overall results did not indicate an increase in GABA levels in patients with psychosis compared with healthy controls in the dorsal anterior cingulate. In fact, there was a modest decrease, although this was statistically significant only for GABA+/creatine. This ratio finding might be determined by the trend for creatine/water to be higher especially in untreated patients than in healthy controls (for effect sizes, see Table S6 in the
data supplement). These data are generally consistent with several studies of GABA levels in the prefrontal cortex (
10,
11,
15,
17), in the occipital cortex (
13,
14,
17), and in the hippocampal formation (
12), which found GABA levels to be reduced or unchanged in patients with schizophrenia compared with healthy controls. However, our findings differ in directionality from those by Ongür et al. (
20) in the dorsal anterior cingulate and Kegeles et al. (
19) in the medial prefrontal cortex (see the Supplementary Discussion section in the
data supplement).
Are GABA Levels Altered in Unaffected Siblings of Patients With Psychosis?
The strongest indication of a reduction in GABA levels in individuals at genetic risk for schizophrenia was found comparing the unaffected siblings with healthy controls. Given the significant intraclass correlation for GABA/creatine (further confirmed by the data in Table S4 in the data supplement), this measure could indeed be familial. Although this is the first report of GABA levels in unaffected siblings of patients with psychosis, these results should be viewed in the context of the small number of individuals we were able to recruit in this cohort and will need to be replicated by independent studies of larger samples.
How Does Antipsychotic Treatment Affect GABA Levels?
GABA levels were weakly inversely related to antipsychotic dosage (in chlorpromazine equivalents) (partial eta
2=0.056), possibly indicating that higher degrees of dopamine D
2 blockade result in reduced GABA levels. Although consistent with the data from Tayoshi et al. (
10) and from Kegeles et al. (
19) in the medial prefrontal cortex in humans, the rest of our data suggest that antipsychotic dosage may be more an indicator of illness severity or some other confounder rather than causally linked to GABA levels, because otherwise we would have expected to find lower GABA levels in medicated as compared with unmedicated patients as well as in paired comparisons of patients on and off medications. Neither prediction was supported by our data (
Figure 2; see also Table S5 in the
data supplement). Our overall on-off medication results are consistent with those of Kelemen et al. (
14), who also saw no change in GABA levels after instituting antipsychotic treatment for 2 months, but power to show change was limited in this small group. Similarly, Kegeles et al. (
19) found no difference when they compared unmedicated to medicated patients or controls in the dorsolateral prefrontal cortex (
11,
16). The animal literature shows either no change (
30–
33) or increases in GABA levels in selected areas (
32–
36) or in GAD
67 expression in the cortex (
37,
38) for exposures to antipsychotics ranging from 21 days to 6 months (
37,
38).
Exploratory analyses did not reveal an association between metabolite levels and symptoms in treated or untreated patients for the anterior cingulate voxel. The nominally significant association for GABA+/creatine and positive symptoms would not have survived corrections for multiple comparisons. However, Kegeles et al. (
19) described a similar finding for GABA/water in their combined group of treated and untreated patients.
Although this is, to our knowledge, the largest group of patients with severe psychotic disorders for whom GABA levels measured with MRS have been reported, a larger sample would be desirable for some of the studied groups (the unaffected siblings and the on-off medication groups). Another limitation is the inability to account for variables that are inherently affected by the illness (such as education level, employment, and smoking). We also did not control for menstrual phase in female participants (
39). Finally, given reports of GABA concentrations changing with cognitive/emotional state (e.g., reference
40), mental state at the time of scanning may need to be controlled by having subjects execute a task in order to have a meaningful readout of GABA levels in a comparable state across populations.
In summary, if there is any alteration in GABA levels measurable with in vivo MRS in the dorsal anterior cingulate cortex in patients with schizophrenia, it is small and difficult to detect even with relatively large samples of patients. Our data do not support increases in GABA levels in the dorsal anterior cingulate in treated or untreated patients but may be generally compatible with small reductions. We cannot rule out the possibility that GABA levels (particularly GABA/creatine) are an intermediate phenotype with low effect size and with some degree of familiality. Increased genetic risk for schizophrenia may be associated with reduced GABA levels in the dorsal anterior cingulate measured with MRS, and the presence of psychotic disorders seems to increase GABA levels above this baseline. Our data only partly support the hypothesis that this is due to medication (on-off data for GABA/creatine) but generally do not allow any further interpretation.
Acknowledgments
The authors thank David A. Luckenbaugh of the NIMH-IRP, Experimental Therapeutics and Pathophysiology Branch, for statistical advice and Brad Zoltick for help with database development and technical support.


