Abstract

Objective:

Aside from features associated with risk of neurogenetic syndromes in general (e.g., cognitive impairment), limited progress has been made in identifying phenotype-genotype relationships in autism spectrum disorder (ASD). The objective of this study was to extend work in the Simons Simplex Collection by comparing the phenotypic profiles of ASD probands with or without identified de novo loss of function mutations or copy number variants in high-confidence ASD-associated genes or loci.

Method:

Analyses preemptively accounted for documented differences in sex and IQ in affected individuals with de novo mutations by matching probands with and without these genetic events on sex, IQ, and age before comparing them on multiple behavioral domains.

Results:

Children with de novo mutations (N=112) had a greater likelihood of motor delay during early development (later age at walking), but they were less impaired on certain measures of ASD core symptoms (parent-rated social communication abnormalities and clinician-rated diagnostic certainty about ASD) in later childhood. These children also showed relative strengths in verbal and language abilities, including a smaller discrepancy between nonverbal and verbal IQ and a greater likelihood of having achieved fluent language (i.e., regular use of complex sentences).

Conclusions:

Children with ASD with de novo mutations may exhibit a “muted” symptom profile with respect to social communication and language deficits relative to those with ASD with no identified genetic abnormalities. Such findings suggest that examining early milestone differences and standardized testing results may be helpful in etiologic efforts, and potentially in clinical differentiation of various subtypes of ASD, but only if developmental and demographic variables are properly accounted for first.
Although the majority of children with autism spectrum disorder (ASD) do not have genetic abnormalities that are identifiable with currently available technology, a variety of single-gene disorders and chromosomal abnormalities have been associated with ASD and/or intellectual disability (1). In addition, among children with clinical diagnoses of ASD, those with dysmorphic features or complex medical problems (2, 3) are more likely to be identified as having strongly predisposing genetic risk factors (4). Together, these observations have led to a distinction between “syndromic” ASD, in which ASD is one of many diagnoses recognized as part of a neurogenetic syndrome, and the more common “idiopathic” ASD, in which ASD is presumed to occur as a result of unknown causes (3).
Recent advances in genomics technology, together with analyses of large-scale collections of ASD probands, have challenged the syndromic-idiopathic distinction. Microarray analysis and whole exome sequencing in large data sets like the Simons Simplex Collection (SSC) have identified numerous ASD-associated genetic loci in probands (59) and have clearly demonstrated an important role for highly penetrant de novo genetic mutations in individuals previously assumed to have idiopathic ASD and specifically selected for minimal syndromic features. These findings highlight the importance of changing methodological standards to require genetic testing prior to idiopathic classification, but they also leave open the question of whether individuals with identifiable genetic abnormalities are phenotypically distinguishable.
Multiple investigations have compared individuals with ASD-associated syndromes to those with presumed idiopathic ASD to understand how various neurobiological mechanisms might contribute to ASD behavioral phenotypes (1012). Previous comparisons of individuals with ASD with or without an associated syndrome (or a de novo mutation of potential pathogenic significance) have been limited by the difficulty of identifying appropriate controls with idiopathic ASD (10). Individuals with neurogenetic syndromes with ASD often have significantly lower cognitive abilities than those with either ASD or the neurogenetic syndrome, making it difficult to interpret direct comparisons on behavioral measures (13). Because ASD symptom measures are strongly influenced by IQ, comparing ASD severity across cognitive ability is particularly problematic (14). Thus, while associations have emerged between individual phenotypic variables (female sex, lower IQ, seizures, deviation in head circumference and body mass index) and the presence of de novo mutations in ASD loci (5, 8, 15), efforts to link genetic findings to ASD-related behavioral profiles (e.g., strengths, weaknesses, developmental features) have had limited success (16).
The present study extends work in the SSC by simultaneously considering both genetic and phenotypic data in comparing matched groups of probands with ASD with or without identified de novo loss of function (dnLoF) mutations or de novo copy number variants (dnCNVs) in ASD-associated genes or loci. Evaluation of these abnormalities was based on findings from relatively new statistical methods for defining the likelihood that a particular genetic locus is associated with ASD (8). In contrast to previous phenotype-genotype explorations of the SSC, our analytic strategy preemptively accounts for the documented IQ difference in affected individuals with de novo mutations (8), comparing them to age-, sex-, and nonverbal IQ-matched probands (“controls”) from the SSC who did not have any of the genetic events described above. Although this is not the first exploration of the SSC phenotypic data, we believe it is the first to use appropriately matched ASD controls to gain insight into the phenotypic profiles of individuals with ASD with certain types of genetic abnormalities. In addition to group profiles, we provide individual-level phenotypic data in relation to each genetic abnormality specified, to facilitate ongoing efforts to explore genotype-phenotype relationships (17, 18).

Method

Sample Collection

Phenotypic assessments and biological samples were collected from 12 university-based centers as part of the SSC. Probands with ASD were included if they were between 4 years and 17 years, 11 months of age, did not have any first-, second-, or third-degree relatives with ASD, and met criteria for autism, ASD, or Asperger syndrome based on the standard SSC assessment (see reference 19). Participants provided written informed consent (and assent, as appropriate) after receiving a complete description of the study.

Genetic Data and Participants

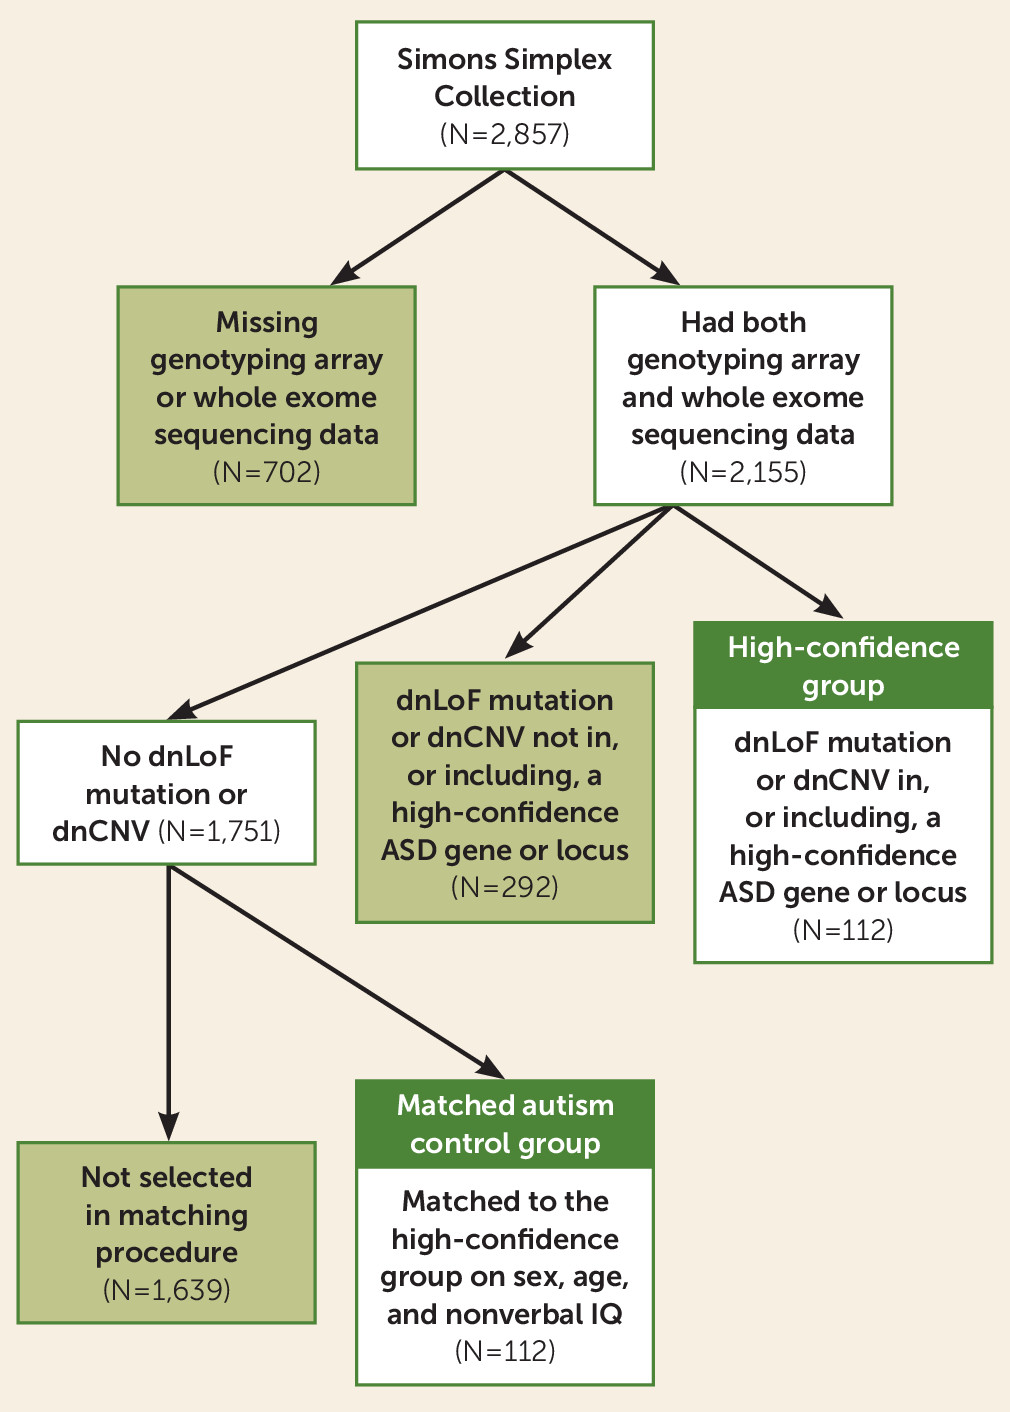
A recent comprehensive, integrated analysis of transmitted and de novo variation in ASD identified 65 ASD-associated genes and an additional six ASD-associated loci with high confidence (false discovery rate ≤0.1) (8). Most evidence for ASD association came from dnLoF mutations or dnCNVs. Based on the results of Illumina genotyping array and whole exome sequencing data to identify dnLoF mutations and dnCNVs, we divided the SSC probands into three groups: 1) 112 probands with at least one dnLoF mutation or dnCNV in, or including, a high-confidence ASD gene or locus (the high-confidence group); 2) 292 probands with a dnLoF mutation or dnCNV, but not in, or including, a high-confidence ASD gene or locus (the low-confidence group); and 3) 1,751 probands with no dnLoF mutations or dnCNVs in any gene or locus (the none group). An additional 702 probands were excluded from these groups because they did not have both genotyping array and whole exome sequencing data available, and therefore we could not be sure of their mutation status.
The main analyses were conducted between the high-confidence group and a subset of 112 cases from the none group, matched on nonverbal IQ, age, and sex. We refer to these cases as “matched autism controls.” Figure 1 depicts the process by which participants were included in the high-confidence group or the matched autism control group. The participants’ demographic characteristics are summarized in Table 1. A list of the specific genetic abnormalities represented in the high-confidence group is available in Table S1 in the data supplement that accompanies the online edition of this article. We examined the high-confidence group as a whole, and we also identified seven dnLoF mutations or dnCNVs found in at least four participants; these have previously been reported separately, and they include 16q11.2 deletions and duplications, 15q11.2–13 duplications, 1q21.1 duplication, and 7q11.23 duplications (7), as well as DYRK1A LoF mutations (20) and CHD8 LoF mutations (16). Supplementary analyses compared individuals from the low-confidence group, who may later be identified as high confidence as further studies are completed, to a separate group of matched controls from the none group (see Table S2 and Figure S1 in the online data supplement).
FIGURE 1. Process for Including Participants From the Simons Simplex Collection in the High-Confidence and Matched Autism Control Groupsa
a ASD=autism spectrum disorder; dnLoF=de novo loss of function; dnCNV=de novo copy number variant.
TABLE 1. Demographic Characteristics of Participants in the Simons Simplex Collection for Whom Genotyping Array and Whole Exome Sequencing Were Availablea
CharacteristicNone (N=1,751)Low-Confidence Group (N=292)High-Confidence Group (N=112)Matched Autism Control Group (N=112)
 N%N%N%N%
Male1,546882458486778677
White1,375792247795858677
Hispanic21112369981413
 MeanSDMeanSDMeanSDMeanSD
Age (months)107.5642.56114.9344.85113.1039.75112.8339.40
Nonverbal IQ86.2826.0680.3427.3174.8823.9675.4624.40
a
The matched autism control group consists of participants from the “none” group (no de novo loss of function mutations or de novo copy number variants in any gene or locus), matched on sex, age (within 8 months), and nonverbal IQ (within 10 points) to the high-confidence group. As a result, the high-confidence–matched autism control pairs did not differ significantly in sex, age, or nonverbal IQ.

Measures

Matched groups were compared on a number of phenotypic domains. Cognitive ability was indexed using nonverbal IQ and verbal IQ, which were derived from standardized tests administered according to the child’s ability level. Standard scores from the daily living skills domain of the Vineland Adaptive Behavior Scales, 2nd Edition (Vineland II) (21) provide a measure of independent functioning that can be used alongside cognitive ability to index the presence and severity of intellectual disability. Motor skills were measured using item 5 from the Autism Diagnostic Interview–Revised (ADI-R) (22), which inquired about age at onset of independent walking, and the raw scores from the Purdue pegboard task. Language was measured using age at first words (item 9) and age at first phrases (item 10) from the ADI-R; the module of the Autism Diagnostic Observation Schedule (ADOS) (23) that provides a gross estimate of expressive language level (module 1, nonverbal/single words; module 2, flexible phrase speech; and modules 3 and 4, fluent speech/regular use of complex sentences); the standard score on the Peabody Picture Vocabulary Test, 4th Edition (24); and the standard score on the Vineland-II communication domain. We also report a language deficit variable, coded as present when the child’s ADOS module was lower than what would be expected based on his or her nonverbal mental age. Social communication deficits and restricted and repetitive behaviors associated with ASD were measured using total scores from the social, communication, and repetitive behavior domains of the ADI-R and the domain-calibrated scores from the ADOS (25). The ADI-R domain scores are based on behaviors retrospectively reported by the parent to have occurred when the child was between ages 4 and 5 or ever in the past, whereas the ADOS is based on currently observed behaviors. Current level of overall ASD symptoms was assessed using total scores from the Social Responsiveness Scale (SRS) (26), the ADOS overall calibrated severity scores (27), and a clinician-rated measure of ASD diagnostic certainty (the minimum score was 6 in the presence of an ASD diagnosis, so SSC scores ranged from 6 to 15). Behavior problems not specific to ASD were measured using T scores for externalizing and internalizing problems from the Child Behavior Checklist (28), a parent-report questionnaire. Presence of seizures was assessed using combined information from the SSC medical history form and ADI-R item 85. Family history of major psychiatric problems was determined from the SSC medical history form, based on presence or absence of schizophrenia, bipolar disorder, or depressive disorder in a family member with a level of genetic relatedness at least on the order of first cousin (see reference 29).

Statistical Analysis

A randomized “nearest neighbor” approach was used to match probands with dnLoF mutations or dnCNVs in genes or loci with previously established ASD significance (high-confidence group) to probands with no such genetic events (none group) at a 1:1 ratio. Matching procedures were performed separately for male and female participants, using ranges of 10 nonverbal IQ points and 8 months of age. These ranges were selected as the narrowest ranges within which probands from the matched autism control group could be found for all probands from the high-confidence group. Matching procedures were performed using a macro in SAS (30). Case-control differences were evaluated using a mixed model with a random effect of the case-control pair (to reflect the correlated nature of the matched data) and a fixed effect of group for continuous variables, or a conditional logistic regression for categorical variables. In both types of models, an interaction with nonverbal IQ was included to determine whether group differences were moderated by cognitive level. We present both uncorrected and false-discovery-rate-corrected (31) p values. False discovery rate was calculated separately for the case-control differences and the moderator analyses, both using the total number of comparisons. Analyses were conducted in SAS, version 9.3 (32).

Results

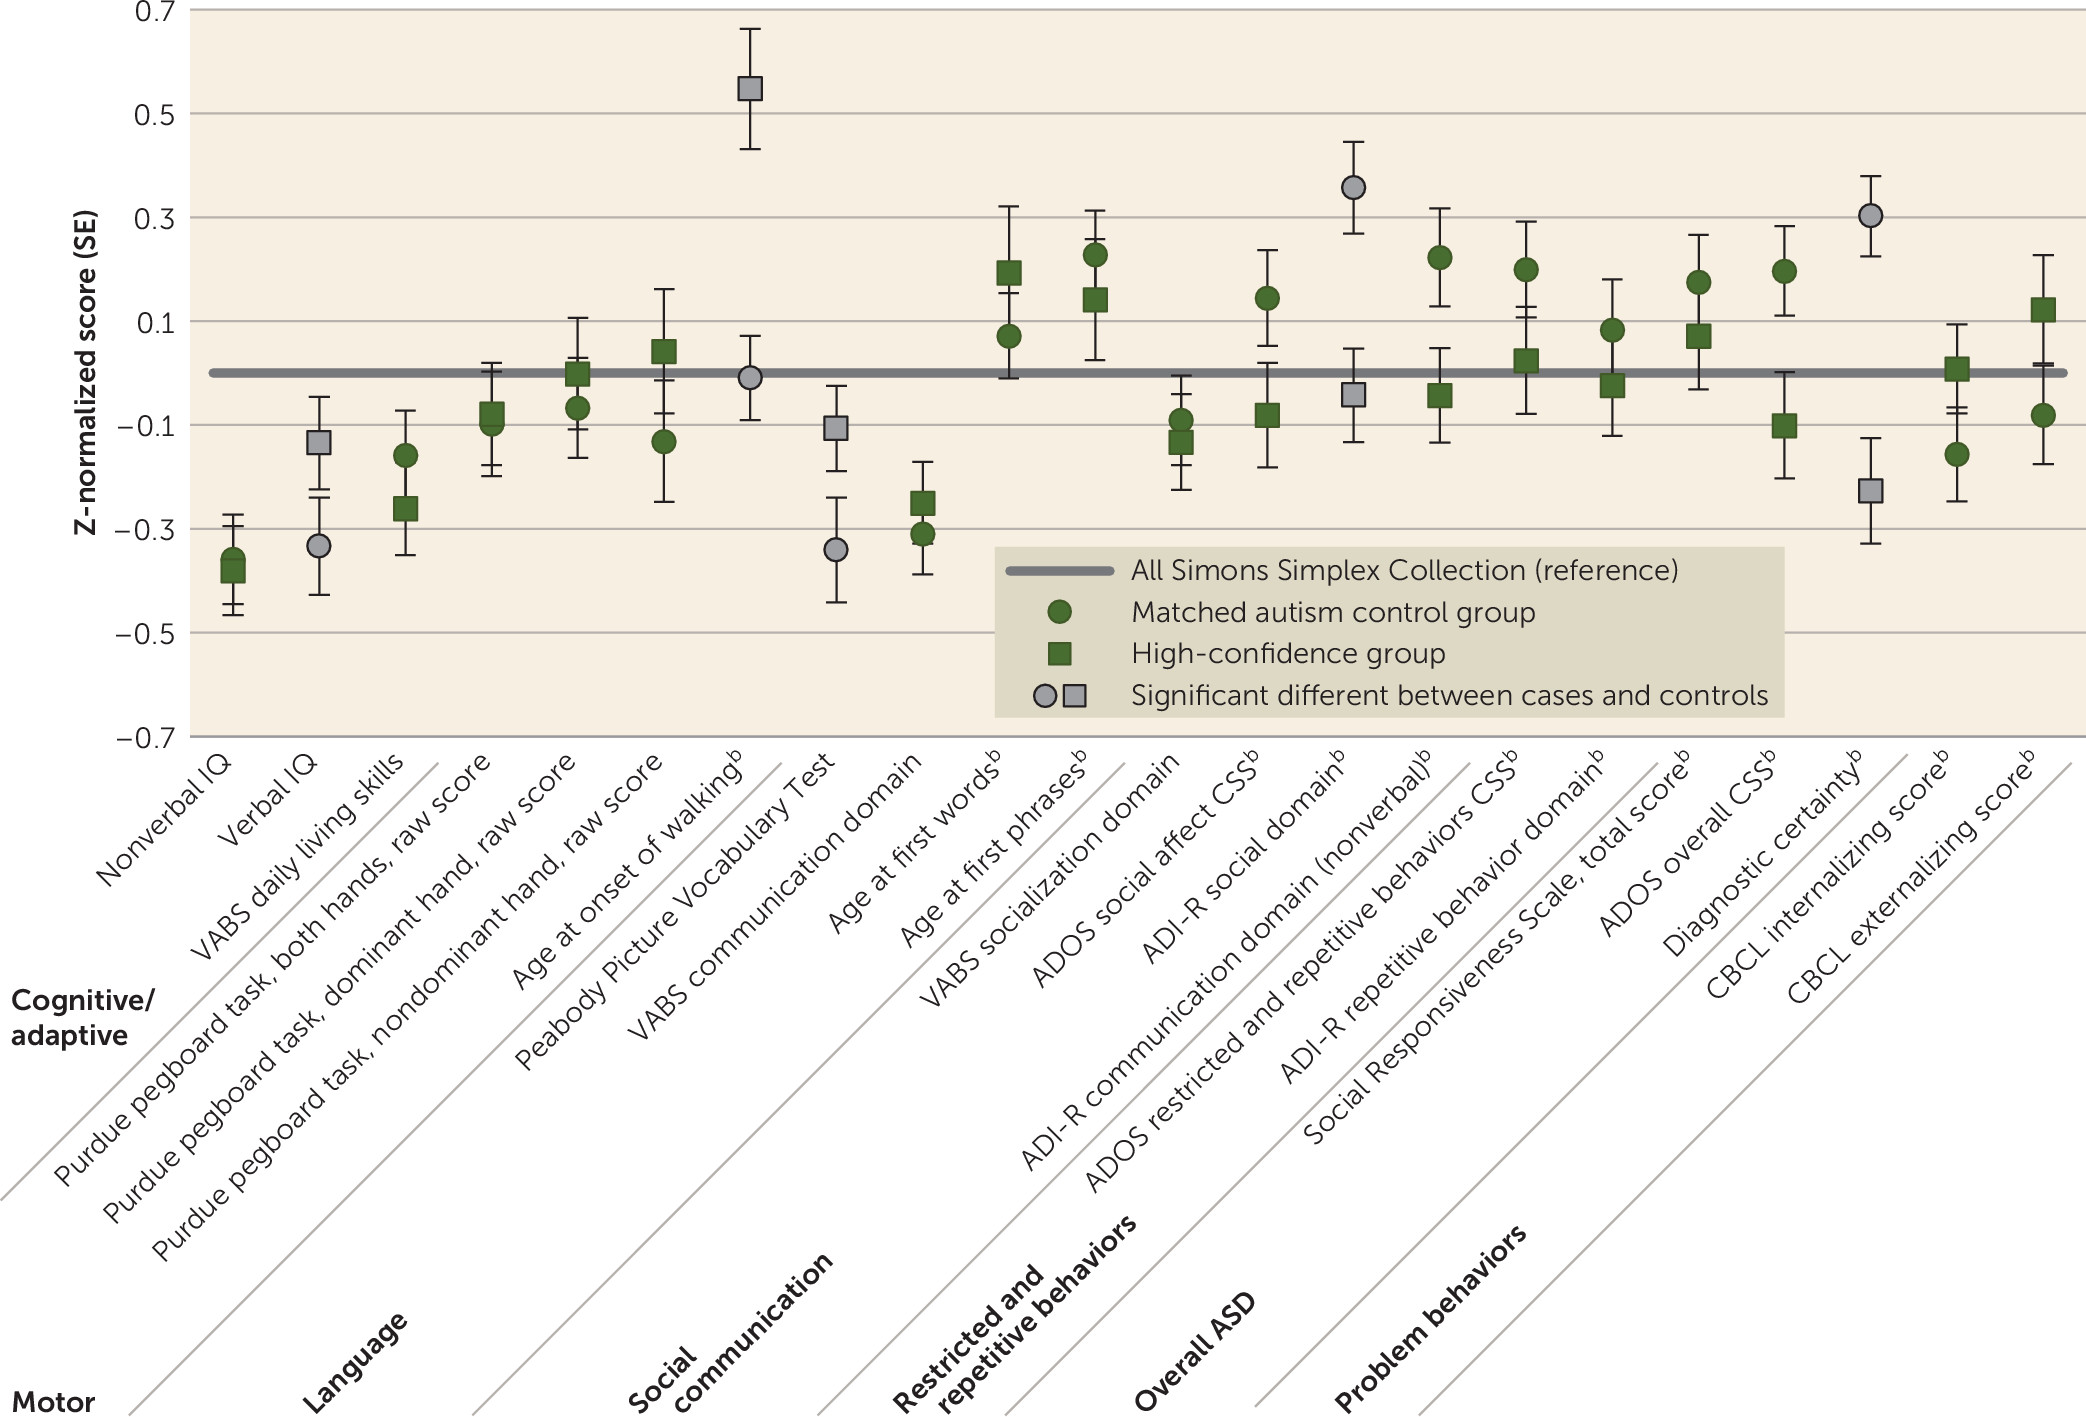
As has been reported in previous phenotype-genotype explorations within the SSC (5, 8), probands with dnLoF mutations or dnCNVs had lower nonverbal IQ and were more likely to be female than those without (in the high-confidence group and the entire none group, nonverbal IQ was 75 and 86, respectively [p<0.0001], and the proportion female was 23% and 12%, respectively [p=0.0002]). The results of the matching procedures are shown in Table 1. Results of the paired comparisons are also shown in Table 2 and are illustrated relative to the full SSC sample in Figure 2. After correction for multiple comparisons, several differences between the matched groups were observed.
TABLE 2. Phenotypic Comparison of the High-Confidence Group and the Matched Autism Control Groupa
  Matched Autism Control Group Versus High-Confidence GroupbGroup-by-Nonverbal IQ Interaction (Nonverbal IQ as Moderator)b
MeasurePairs (N)Matched Autism Control GroupHigh-Confidence GroupTest StatisticpFDR pTest StatisticpFDR p
  MeanSDMeanSD      
Age (months) (matching variable)112112.8339.41113.1039.75      
Nonverbal IQ (matching variable)11275.4624.0074.8823.96      
Verbal IQ11268.0531.1874.2829.49–2.810.010.021.160.280.75
Nonverbal IQ minus verbal IQ1127.4016.100.6116.463.120.0020.011.160.280.75
Autism Diagnostic Interview–Revised           
 Age at first words (months)11227.2817.4329.7127.18–0.800.430.553.690.060.39
 Age at first phrases (months)11249.1023.1646.8631.810.710.480.582.560.110.50
 Age at onset of walking (months)11213.543.4415.794.93–4.28<0.0010.00112.130.0010.02
Vineland Adaptive Behavior Scales, 2nd Edition           
 Communication, standard score11272.6312.1773.4912.19–0.860.390.550.460.500.92
 Daily living skills, standard score11274.2512.7772.8113.221.110.270.430.060.810.97
 Socialization, standard score11269.8311.5169.3012.200.440.660.710.040.840.97
 Adaptive behavior composite, standard score11270.8210.5369.7210.941.150.250.420.010.930.97
Peabody Picture Vocabulary Test, standard score10974.8631.2481.7725.23–3.320.0010.0110.930.0010.02
Purdue pegboard task           
 Both hands, raw score706.143.416.213.33–0.200.850.850.590.440.92
 Dominant hand, raw score708.812.789.043.10–0.640.520.610.100.750.96
 Nondominant, raw score707.773.508.393.59–1.380.170.340.110.740.96
Child Behavior Checklist           
 Internalizing scale, total T score11158.889.1560.468.62–1.330.190.350.400.530.92
 Externalizing scale, total T score11155.7010.5757.8511.60–1.440.150.320.150.700.96
Social Responsiveness Scale, total T score11181.349.9380.3411.130.710.480.580.010.920.97
Autism Diagnostic Interview–Revised           
 Social domain, total score11222.435.3520.155.433.430.0010.010.180.670.96
 Nonverbal communication, total score11210.013.479.093.342.250.030.071.110.290.75
 Restricted and repetitive behaviors, total score1126.762.596.492.590.840.400.550.010.910.97
Autism Diagnostic Observation Schedule           
 Total, calibrated severity score1127.791.537.291.821.260.210.370.540.460.92
 Social affect, calibrated severity score1097.471.697.071.842.230.030.072.480.120.50
 Restricted and repetitive behaviors, calibrated severity score1098.181.767.861.981.650.100.252.380.120.50
Overall ASD diagnostic certainty11213.831.9812.552.604.25<0.0010.0011.820.180.62
  N%N%      
Autism Diagnostic Observation Schedule modulec112    8.630.0030.010.200.650.96
 1 31281917      
 2 24212018      
 3 53477163      
 4 4422      
High ASD diagnostic certaintyd1129787716313.200.0030.0030.180.670.96
Family history of major psychiatric problemse96454743450.100.760.790.940.330.77
Seizures1126513122.450.120.284.340.040.35
Language deficit112403624217.240.010.020.000.970.97
a
ASD=autism spectrum disorder.
b
In order to maintain the integrity of our matching procedure, if only one member of a pair was missing data on a given measure, the partner’s data were also set to missing. The test statistic depends on the type of dependent variable; continuous variables (described with means) have an associated t-statistic, while categorical variables (described with proportions) have an associated χ2 statistic. “Nonverbal IQ as moderator” refers to the interaction between group (high-confidence group versus matched autism control group) and nonverbal IQ in predicting the dependent variable and informs the question of whether group differences depend on cognitive level. FDR=false discovery rate.
c
Module type was collapsed to modules 1 and 2 versus modules 3 and 4 for analysis.
d
Certainty score was greater than 12, operationalized in the study as “high certainty.”
e
Controlling for ethnicity.
FIGURE 2. Phenotypic Profiles of Participants in the High-Confidence Group and the Matched Autism Control Group Relative to the Full Simons Simplex Collection Samplea
a Variables were z-normalized using the mean and standard deviation in the full Simons Simplex Collection sample as the reference. Mean z scores in each group are plotted. Gray markers indicate a significant difference between cases and controls (see Table 1). ADI-R=Autism Diagnostic Interview–Revised; ADOS=Autism Diagnostic Observation Schedule; CBCL=Child Behavior Checklist; CSS=calibrated severity score; VABS=Vineland Adaptive Behavior Scales, 2nd Edition.
b For these measures, a higher value is more severe or more atypical.
Children from the high-confidence group scored significantly lower (indicating fewer ASD symptoms) on the ADI-R social domain total than the matched autism control group (pcorrected=0.01), but the difference in ADI-R nonverbal communication total scores did not survive correction (pcorrected=0.07). Current ASD symptoms (ADOS social affect calibrated severity score) did not differ significantly between the high-confidence and matched autism control groups after correction (pcorrected=0.07), although the trend was for less severe symptoms in the high-confidence group. Clinicians were significantly less confident in the ASD diagnosis for probands in the high-confidence group (pcorrected=0.001).
Generally, the verbal cognitive and language abilities of the high-confidence group exceeded those of the matched autism control group (Table 2). Verbal IQ was higher (pcorrected=0.02) and more consistent with nonverbal IQ (nonverbal IQ-verbal IQ difference between groups, pcorrected=0.01) in the high-confidence group than in the matched autism control group, which had larger splits between nonverbal and verbal IQ. The mean split in the high-confidence group was nearly zero (mean=0.61, SD=16.46), compared with a mean of 7.40 (SD=16.10) in the matched autism control group (Cohen’s d=0.41, 95% CI=0.14, 0.68). Probands in the high-confidence group also had significantly higher scores on the Peabody Picture Vocabulary Test than the matched autism control group (pcorrected=0.01) (a difference that was more pronounced at lower levels of nonverbal IQ; interaction pcorrected=0.02) and were more likely to receive modules 3 or 4 of the ADOS (pcorrected=0.01).
Probands in the high-confidence group reportedly started walking at a significantly later age than the matched autism control group (pcorrected=0.001). This difference depended on the nonverbal IQ level of the case-control pair, such that the magnitude of the difference in age at first walking was larger at lower IQ (interaction pcorrected=0.02). When nonverbal IQ was held constant at 30, the least squares mean estimate for age at first walking in the high-confidence group was 19.0 months, compared with 13.6 months in the matched autism control group; at a nonverbal IQ of 50, the mean estimates were 17.6 and 13.6 months, respectively; at a nonverbal IQ of 70, the mean estimates were 16.1 and 13.5 months, respectively; and at a nonverbal IQ of 90, the mean estimates were 14.7 and 13.5 months, respectively. No differences between groups were observed on the Purdue pegboard task, a measure of current fine motor skills.
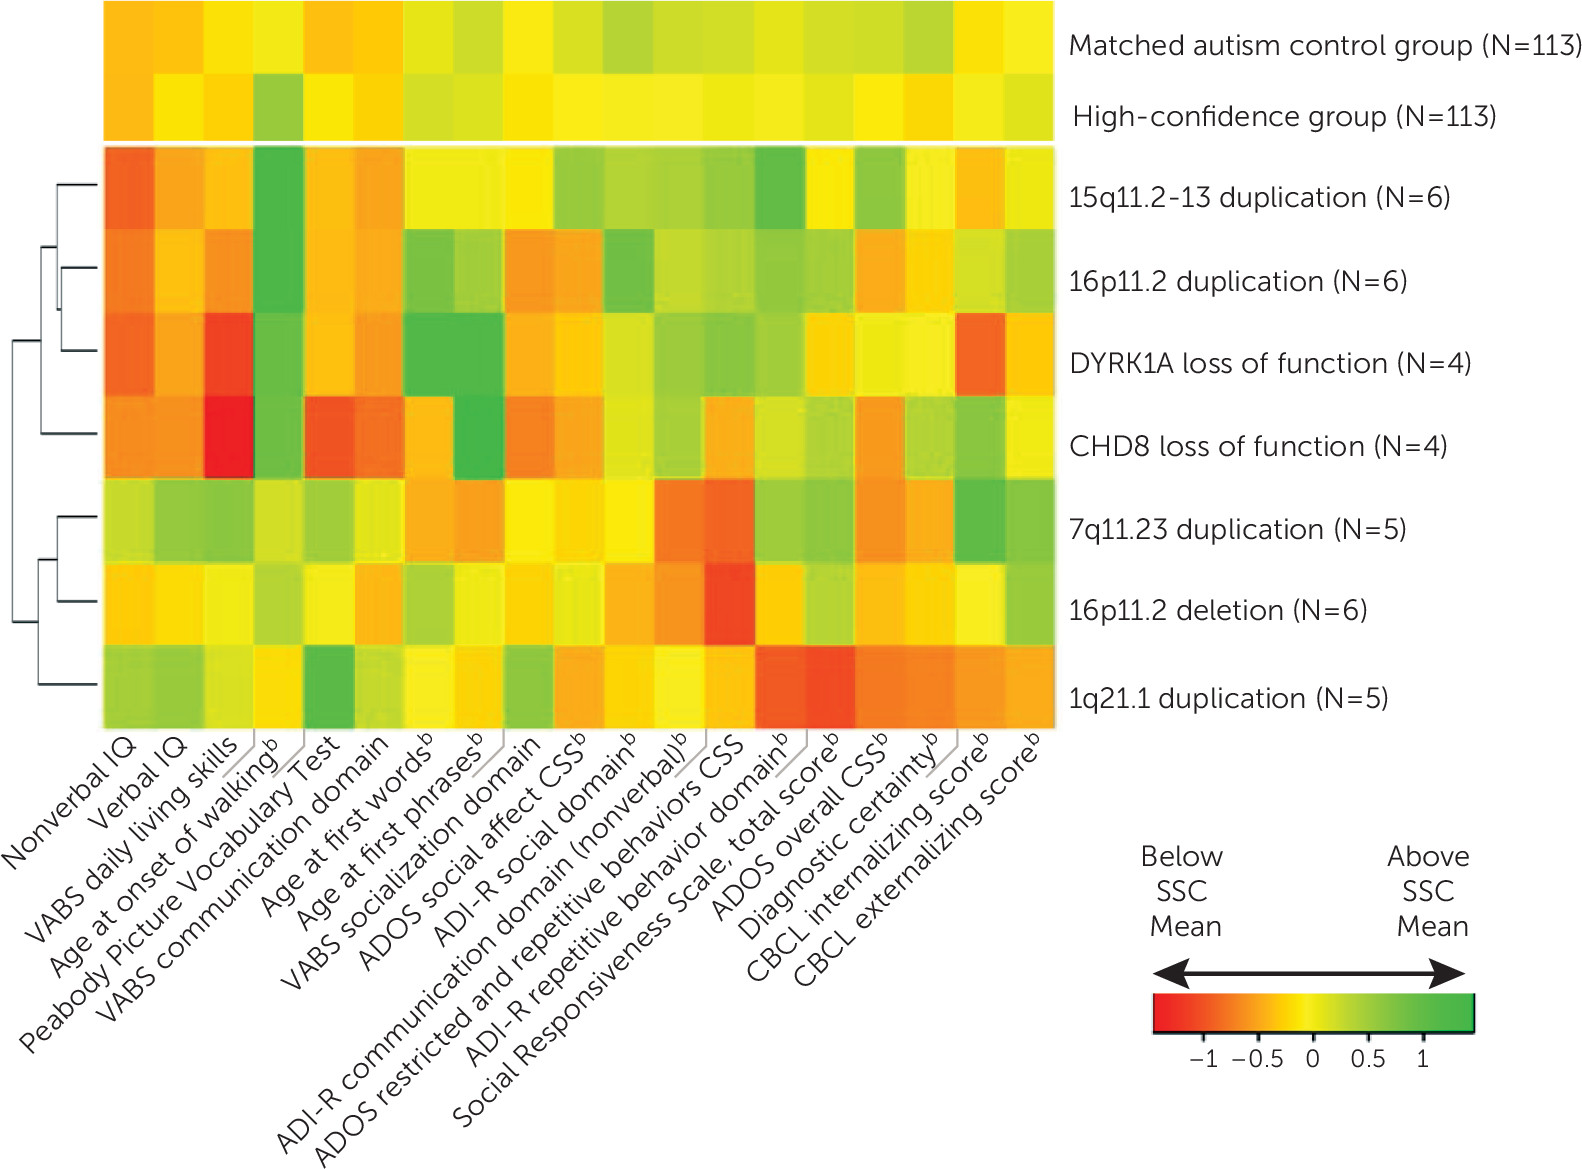
Phenotypic profiles for subgroups of high-confidence probands with identified de novo mutations in the same locus (observed in at least four individuals in this sample) are presented in Figure 3. Although a few discernable profiles are apparent, readers are cautioned that within-group variability was high and sample sizes were small.
FIGURE 3. Profiles of Individual Conditions in the High-Confidence Group and the Matched Autism Control Group Relative to the Full Simons Simplex Collection Samplea
a De novo events found in at least four participants are shown alongside the full high-confidence sample and the matched autism control sample. Variables were z-normalized using the mean and standard deviation in the full Simons Simplex Collection (SSC) sample, and the colors in the heat map represent z scores above or below the SSC mean. Hierarchical clustering, for the purposes of presentation (indicated by the dendrogram on the left-hand side), was performed using Ward’s method and Euclidian distance. ADI-R=Autism Diagnostic Interview–Revised; ADOS=Autism Diagnostic Observation Schedule; CBCL=Child Behavior Checklist; CSS=calibrated severity score; VABS=Vineland Adaptive Behavior Scales, 2nd Edition.
b For these measures, a higher value is more severe or more atypical.

Discussion

Findings from previous phenotype-genotype explorations within the SSC, and from other comparisons of syndromic and idiopathic ASD, indicate that children with ASD who have identifiable genetic abnormalities have lower IQ and higher rates of medical problems and dysmorphology than those without genetic abnormalities (4, 5, 8). Differences in behaviors that are related to ASD more specifically (rather than to neurodevelopmental disruption or intellectual disability more generally) have not typically emerged from large genotyped data sets, although this may be attributable to the fact that ASD symptom measures are strongly influenced by IQ (14). In order to further our understanding of whether and how children with ASD with either dnLoF mutations or dnCNVs in the SSC differ from comparable children with ASD without these abnormalities, we identified a group of sex-, age-, and nonverbal IQ-matched individuals to serve as controls. These matched groups were then compared across several phenotypic domains relevant to the characterization of individuals with ASD. Although the smaller male-to-female ratio in the high-confidence group compared with the none group was interesting and consistent with the literature on female sex conferring specific risk for de novo genetic abnormalities (5), the small number of female participants in the sample prohibited sex-based comparisons.
Results of the matched comparisons indicated that children with dnLoF mutations or dnCNVs in high-confidence ASD-associated genes or loci were less impaired on certain measures of ASD core symptoms (primarily social communication and diagnostic certainty) than their matched counterparts. Children from the high-confidence group also showed relative strengths in verbal and language abilities, including a smaller gap between nonverbal and verbal IQ, and were more likely to have achieved fluent expressive language abilities at the time of the SSC assessment (i.e., they were regularly using complex sentences and therefore were capable of completing module 3 or 4 of the ADOS). This suggests that once nonverbal IQ and age are taken into account, children with ASD with certain genetic abnormalities may exhibit a “muted” symptom profile with respect to language and social communication deficits relative to those with ASD with no identified genetic abnormalities. On the other hand, consistent with previous findings in individuals with intellectual disability, children from the high-confidence group were more likely to show delays in motor functioning as measured by onset of independent walking (see reference 33). In the matched ASD comparisons, for every 1-month delay in walking, there was a 17% increase in the odds of a de novo mutation being present, suggesting that age at onset of walking may be useful as a marker of potential genetic abnormality in samples with ASD (33). Furthermore, this finding of delayed gross motor milestone attainment shifts the profile of children with de novo mutations in this sample away from an exclusively ASD-specific phenotypic profile and toward a profile more similar to that of genetic syndromes associated with ASD generally.
Importantly, children with genetic abnormalities (and therefore the children selected as matched ASD controls) had lower cognitive and adaptive abilities than the rest of the SSC sample. They also tended to receive higher (worse) scores on ASD symptom measures compared with the rest of the SSC sample, mirroring decades of similar findings that children with ASD with lower IQ usually exhibit more severe impairments than those with higher IQ (27). In fact, although we sought to conduct resampling to create multiple control groups, we were only able to create one matched ASD control group because of the low number of possible matches (i.e., in some cases, it was only possible to generate one match for children with ASD-associated mutations). However, the fact that children with ASD-associated mutations were not more impaired on measures of social communication deficits and diagnostic certainty when compared with relevant controls (i.e., matched on sex, age, and nonverbal IQ) indicates that these mutations, as a group, may not actually confer specific risk for ASD-related impairment that is greater than the factors conferring risk in the none group. This interpretation is supported by the results of the low-confidence group comparison (see the online data supplement). Alternatively, other explanatory models regarding differential thresholds for behavioral expression of ASD based on heightened risk from rare de novo mutations and/or compensatory mechanisms may be relevant to those with abnormalities in high-confidence genes and diagnosed with ASD (34, 35). Regardless, continued study of early milestone and autism symptom profiles, both in samples of heterogeneous genetic abnormalities and with specific genetic abnormalities, is required to move these findings from observational to informing risk assessment for genetic testing in clinics (36).

Limitations and Future Directions

Limitations of the SSC data set for these types of comparisons include its rigid exclusion criteria for problems that are known to be associated with pathogenic genetic abnormalities, including very low mental age and birth trauma (e.g., perinatal incidents, prematurity), exclusion of individuals who did not meet stringent ASD criteria on standardized diagnostic instruments, and the lack of contemporaneously sampled controls from different families without ASD. Thus, we note the possibility that the present findings may vary when the full range of intellectual disability and associated features within ASD is represented. That the phenotypic data collection was blinded to genetic status is a major advantage over other comparisons between “syndromic” and “idiopathic” ASD, in which clinicians’ ratings on standardized instruments or measures of diagnostic certainty may be subconsciously affected by biases about, for example, whether ASD in fragile X syndrome or tuberous sclerosis is the same as “idiopathic” ASD. Therefore, our finding of lower clinician-rated diagnostic certainty for children with genetic abnormalities is robust and cannot be explained by clinician bias.
Another caveat is that although the high-confidence and matched autism control groups were matched on age, children in this study spanned a wide age range (4 to 17 years). A challenge to genetic studies requiring large samples is that it is difficult to interpret within-sample comparisons of children spanning the full range of ages and developmental stages. On the one hand, results of this study suggest that ASD symptoms are less impairing in those who are diagnosed with ASD with de novo mutations in high-confidence genes or loci than in peers with equivalent cognitive skills; on the other hand, the pattern of significant differences in early motor milestones (related to lower IQ) may suggest differences in the developmental trajectories or patterns of emergence of ASD symptoms. Indeed, the fact that the high-confidence group was characterized by later onset of independent walking than the matched autism control group indicates a very early phenotypic difference. Delayed walking is more frequently observed in individuals with intellectual disability, compared with the general population and compared with individuals with ASD, which suggests that it may serve as a marker of propensity toward later cognitive impairment. Considering that the high-confidence and matched autism control groups were matched on current nonverbal cognitive functioning, presence of this early developmental difference provides further evidence for different developmental trajectories (33). Such questions underscore the need to obtain genetic data in prospective longitudinal studies.
A third limitation of the study was the small sample sizes of participants with de novo mutations in, or including, the same ASD-associated genes and loci and our subsequent combination of all of these participants into a single group. Although a number of group-level findings still emerged as significant, Figure 3 clearly illustrates the limitations of combining individuals of such diversity. It also exemplifies the variability of phenotypic expression even within a known abnormality, already observed in many studies of these specific genetic disorders (17). While it would be interesting to make observations about the most common dnLoF mutations and dnCNVs, which included four CNV duplications, one CNV deletion, and two mutations all previously associated with ASD, there are published “genetics first” cohorts for each of these (17, 18, 20, 3739). These studies describe wide within-cohort variability in phenotypic expression, based on type of mutation or CNV characteristics, such as deletion versus duplication, size of the error, and the specific genes involved (2). An obvious next step is to continue efforts to collect sufficient numbers of cases of specific genetic abnormalities to allow comparisons both within and across disorders, although the feasibility of this approach is limited by the relative rarity of any specific mutation. However, as our understanding of the underlying molecular neurobiology improves, grouping patients with mutations expected to affect the same pathway(s), and therefore potentially leading to a similar phenotypic outcome, may provide traction in this regard (40). Relatedly, future studies may identify common variants or familially transmitted genetic abnormalities that contribute to these biologically relevant groupings.
In conclusion, these results highlight the critical need to consider ASD-related symptoms and behaviors in the context of overall developmental level. The differences between individuals with and without de novo mutations were only revealed when sex, IQ, and age were carefully controlled in the analyses. Proper steps must be taken to account for these factors in future studies in order to advance our understanding of the range of phenotypic profiles associated with genetic findings in ASD. Studies such as these need to be replicated and extended as additional genetic abnormalities are found to be associated with ASD with high confidence. Findings from these studies will elucidate actual genotype-phenotype differences within ASD, which can be used to more carefully phenotype specific animal models for treatment targeting and to inform clinical genetic risk assessment and prognosis.

Supplementary Material

File (appi.ajp.2017.16101115.ds001.xlsx)
File (appi.ajp.2017.16101115.ds002.pdf)

References

1.
de la Torre-Ubieta L, Won H, Stein JL, et al: Advancing the understanding of autism disease mechanisms through genetics. Nat Med 2016; 22:345–361
2.
Watson CT, Marques-Bonet T, Sharp AJ, et al: The genetics of microdeletion and microduplication syndromes: an update. Annu Rev Genomics Hum Genet 2014; 15:215–244
3.
Miles JH, Takahashi TN, Bagby S, et al: Essential versus complex autism: definition of fundamental prognostic subtypes. Am J Med Genet A 2005; 135:171–180
4.
Tammimies K, Marshall CR, Walker S, et al: Molecular diagnostic yield of chromosomal microarray analysis and whole-exome sequencing in children with autism spectrum disorder. JAMA 2015; 314:895–903
5.
Iossifov I, O’Roak BJ, Sanders SJ, et al: The contribution of de novo coding mutations to autism spectrum disorder. Nature 2014; 515:216–221
6.
De Rubeis S, He X, Goldberg AP, et al: Synaptic, transcriptional, and chromatin genes disrupted in autism. Nature 2014; 515:209–215
7.
Sanders SJ, Ercan-Sencicek AG, Hus V, et al: Multiple recurrent de novo CNVs, including duplications of the 7q11.23 Williams syndrome region, are strongly associated with autism. Neuron 2011; 70:863–885
8.
Sanders SJ, He X, Willsey AJ, et al: Insights into autism spectrum disorder genomic architecture and biology from 71 risk loci. Neuron 2015; 87:1215–1233
9.
Sanders SJ, Murtha MT, Gupta AR, et al: De novo mutations revealed by whole-exome sequencing are strongly associated with autism. Nature 2012; 485:237–241
10.
Thurman AJ, McDuffie A, Kover ST, et al: Autism symptomatology in boys with fragile X syndrome: a cross sectional developmental trajectories comparison with nonsyndromic autism spectrum disorder. J Autism Dev Disord 2015; 45:2816–2832
11.
Frazier TW, Embacher R, Tilot AK, et al: Molecular and phenotypic abnormalities in individuals with germline heterozygous PTEN mutations and autism. Mol Psychiatry 2015; 20:1132–1138
12.
Bruining H, Eijkemans MJ, Kas MJ, et al: Behavioral signatures related to genetic disorders in autism. Mol Autism 2014; 5:11
13.
Moss J, Howlin P, Oliver C: The assessment and presentation of autism spectrum disorder and associated characteristics in individuals with severe intellectual disability and genetic syndromes, in The Oxford Handbook of Intellectual Disablity and Development. Edited by Burack J, Hodapp R, Iarocci G, et al. New York, Oxford University Press, 2011, pp 1–57
14.
Havdahl KA, Hus Bal V, Huerta M, et al: Multidimensional influences on autism symptom measures: implications for use in etiological research. J Am Acad Child Adolesc Psychiatry 2016; 55:1054–1063.e3
15.
Chaste P, Klei L, Sanders SJ, et al: Adjusting head circumference for covariates in autism: clinical correlates of a highly heritable continuous trait. Biol Psychiatry 2013; 74:576–584
16.
Bernier R, Golzio C, Xiong B, et al: Disruptive CHD8 mutations define a subtype of autism early in development. Cell 2014; 158:263–276
17.
Hanson E, Bernier R, Porche K, et al: The cognitive and behavioral phenotype of the 16p11.2 deletion in a clinically ascertained population. Biol Psychiatry 2015; 77:785–793
18.
Bernier R, Steinman KJ, Reilly B, et al: Clinical phenotype of the recurrent 1q21.1 copy-number variant. Genet Med 2016; 18:341–349
19.
Fischbach GD, Lord C: The Simons Simplex Collection: a resource for identification of autism genetic risk factors. Neuron 2010; 68:192–195
20.
van Bon BW, Coe BP, Bernier R, et al: Disruptive de novo mutations of DYRK1A lead to a syndromic form of autism and ID. Mol Psychiatry 2016; 21:126–132
21.
Sparrow S, Cicchetti DV, Balla DA: Vineland Adaptive Behavior Scales, 2nd ed. Circle Pines, Minn, AGS Publishing, 2005
22.
Rutter M, LeCouteur A, Lord C: Autism Diagnostic Interview–Revised (ADI-R). Los Angeles, Western Psychological Services, 2003
23.
Lord C, Rutter M, DiLavore PC, et al: Autism Diagnostic Observation Schedule (ADOS). Los Angeles, Western Psychological Services, 1999
24.
Dunn DM, Dunn LM: Peabody Picture Vocabulary Test: Manual. San Antonio, Tex, Pearson, 2007
25.
Hus V, Gotham K, Lord C: Standardizing ADOS domain scores: separating severity of social affect and restricted and repetitive behaviors. J Autism Dev Disord 2014; 44:2400–2412
26.
Constantino JN, Gruber CP: Social Responsiveness Scale (SRS). Los Angeles, Western Psychological Services, 2005
27.
Gotham K, Pickles A, Lord C: Standardizing ADOS scores for a measure of severity in autism spectrum disorders. J Autism Dev Disord 2009; 39:693–705
28.
Achenbach TM, Rescorla LA: Manual for the ASEBA School-Age Forms and Profiles. Burlington, Vt, University of Vermont, Research Center for Children, Youth, and Families, 2001
29.
Robinson EB, Samocha KE, Kosmicki JA, et al: Autism spectrum disorder severity reflects the average contribution of de novo and familial influences. Proc Natl Acad Sci USA 2014; 111:15161–15165
30.
Mounib E, Satchi T: Automating the selection of controls in case-control studies. Proceedings of the 25th SAS Users Group International Conference. Paper 230-25. Indianapolis, 2000
31.
Benjamini Y, Hochberg Y: Controlling the false discovery rate: a practical and powerful approach to multiple testing. J R Stat Soc B 1995; 57:289–300
32.
SAS Institute: SAS, version 9.3. Cary, NC, SAS Institute, 2012
33.
Bishop SL, Thurm A, Farmer C, et al: Autism spectrum disorder, intellectual disability, and delayed walking. Pediatrics 2016; 137:e20152959
34.
Skuse DH: Rethinking the nature of genetic vulnerability to autistic spectrum disorders. Trends Genet 2007; 23:387–395
35.
Moreno-De-Luca D, Moreno-De-Luca A, Cubells JF, et al: Cross-disorder comparison of four neuropsychiatric CNV loci. Curr Genet Med Rep 2014; 2:151–161
36.
Marano RM, Mercurio L, Kanter R, et al: Risk assessment models in genetics clinic for array comparative genomic hybridization: clinical information can be used to predict the likelihood of an abnormal result in patients. J Pediatr Genet 2013; 2:25–31
37.
Picinelli C, Lintas C, Piras IS, et al: Recurrent 15q11.2 BP1-BP2 microdeletions and microduplications in the etiology of neurodevelopmental disorders. Am J Med Genet B Neuropsychiatr Genet 2016; 171:1088–1098
38.
Steinman KJ, Spence SJ, Ramocki MB, et al: 16p11.2 deletion and duplication: characterizing neurologic phenotypes in a large clinically ascertained cohort. Am J Med Genet A 2016; 170:2943–2955
39.
Morris CA, Mervis CB, Paciorkowski AP, et al: 7q11.23 duplication syndrome: physical characteristics and natural history. Am J Med Genet A 2015; 167A:2916–2935
40.
Willsey AJ, Sanders SJ, Li M, et al: Coexpression networks implicate human midfetal deep cortical projection neurons in the pathogenesis of autism. Cell 2013; 155:997–1007

Information & Authors

Information

Published In

Go to American Journal of Psychiatry
American Journal of Psychiatry
Pages: 576 - 585
PubMed: 28253736

History

Received: 4 October 2016
Revision received: 14 December 2016
Accepted: 13 January 2017
Published online: 3 March 2017
Published in print: June 01, 2017

Keywords

  1. Simons Simplex Collection
  2. De Novo Mutations
  3. Phenotype
  4. Autism Spectrum Disorder
  5. Idiopathic ASD
  6. Syndromic ASD

Authors

Details

Somer L. Bishop, Ph.D. [email protected]
From the Department of Psychiatry, UCSF Weill Institute for Neurosciences, University of California, San Francisco; the Pediatrics and Developmental Neuroscience Branch, NIMH, Bethesda, Md.; the Analytic and Translational Genetics Unit, Department of Medicine, Massachusetts General Hospital and Harvard Medical School, Boston; the Stanley Center for Psychiatric Research and the Program in Medical and Population Genetics, Broad Institute of Harvard and MIT, Cambridge, Mass.; and the MRC Integrative Epidemiology Unit at the University of Bristol, School of Social and Community Medicine, Bristol, U.K.
Cristan Farmer, Ph.D.
From the Department of Psychiatry, UCSF Weill Institute for Neurosciences, University of California, San Francisco; the Pediatrics and Developmental Neuroscience Branch, NIMH, Bethesda, Md.; the Analytic and Translational Genetics Unit, Department of Medicine, Massachusetts General Hospital and Harvard Medical School, Boston; the Stanley Center for Psychiatric Research and the Program in Medical and Population Genetics, Broad Institute of Harvard and MIT, Cambridge, Mass.; and the MRC Integrative Epidemiology Unit at the University of Bristol, School of Social and Community Medicine, Bristol, U.K.
Vanessa Bal, Ph.D.
From the Department of Psychiatry, UCSF Weill Institute for Neurosciences, University of California, San Francisco; the Pediatrics and Developmental Neuroscience Branch, NIMH, Bethesda, Md.; the Analytic and Translational Genetics Unit, Department of Medicine, Massachusetts General Hospital and Harvard Medical School, Boston; the Stanley Center for Psychiatric Research and the Program in Medical and Population Genetics, Broad Institute of Harvard and MIT, Cambridge, Mass.; and the MRC Integrative Epidemiology Unit at the University of Bristol, School of Social and Community Medicine, Bristol, U.K.
Elise B. Robinson, Ph.D.
From the Department of Psychiatry, UCSF Weill Institute for Neurosciences, University of California, San Francisco; the Pediatrics and Developmental Neuroscience Branch, NIMH, Bethesda, Md.; the Analytic and Translational Genetics Unit, Department of Medicine, Massachusetts General Hospital and Harvard Medical School, Boston; the Stanley Center for Psychiatric Research and the Program in Medical and Population Genetics, Broad Institute of Harvard and MIT, Cambridge, Mass.; and the MRC Integrative Epidemiology Unit at the University of Bristol, School of Social and Community Medicine, Bristol, U.K.
A. Jeremy Willsey, Ph.D.
From the Department of Psychiatry, UCSF Weill Institute for Neurosciences, University of California, San Francisco; the Pediatrics and Developmental Neuroscience Branch, NIMH, Bethesda, Md.; the Analytic and Translational Genetics Unit, Department of Medicine, Massachusetts General Hospital and Harvard Medical School, Boston; the Stanley Center for Psychiatric Research and the Program in Medical and Population Genetics, Broad Institute of Harvard and MIT, Cambridge, Mass.; and the MRC Integrative Epidemiology Unit at the University of Bristol, School of Social and Community Medicine, Bristol, U.K.
Donna M. Werling, Ph.D.
From the Department of Psychiatry, UCSF Weill Institute for Neurosciences, University of California, San Francisco; the Pediatrics and Developmental Neuroscience Branch, NIMH, Bethesda, Md.; the Analytic and Translational Genetics Unit, Department of Medicine, Massachusetts General Hospital and Harvard Medical School, Boston; the Stanley Center for Psychiatric Research and the Program in Medical and Population Genetics, Broad Institute of Harvard and MIT, Cambridge, Mass.; and the MRC Integrative Epidemiology Unit at the University of Bristol, School of Social and Community Medicine, Bristol, U.K.
Karoline Alexandra Havdahl, Ph.D.
From the Department of Psychiatry, UCSF Weill Institute for Neurosciences, University of California, San Francisco; the Pediatrics and Developmental Neuroscience Branch, NIMH, Bethesda, Md.; the Analytic and Translational Genetics Unit, Department of Medicine, Massachusetts General Hospital and Harvard Medical School, Boston; the Stanley Center for Psychiatric Research and the Program in Medical and Population Genetics, Broad Institute of Harvard and MIT, Cambridge, Mass.; and the MRC Integrative Epidemiology Unit at the University of Bristol, School of Social and Community Medicine, Bristol, U.K.
Stephan J. Sanders, M.D., Ph.D.
From the Department of Psychiatry, UCSF Weill Institute for Neurosciences, University of California, San Francisco; the Pediatrics and Developmental Neuroscience Branch, NIMH, Bethesda, Md.; the Analytic and Translational Genetics Unit, Department of Medicine, Massachusetts General Hospital and Harvard Medical School, Boston; the Stanley Center for Psychiatric Research and the Program in Medical and Population Genetics, Broad Institute of Harvard and MIT, Cambridge, Mass.; and the MRC Integrative Epidemiology Unit at the University of Bristol, School of Social and Community Medicine, Bristol, U.K.
Audrey Thurm, Ph.D.
From the Department of Psychiatry, UCSF Weill Institute for Neurosciences, University of California, San Francisco; the Pediatrics and Developmental Neuroscience Branch, NIMH, Bethesda, Md.; the Analytic and Translational Genetics Unit, Department of Medicine, Massachusetts General Hospital and Harvard Medical School, Boston; the Stanley Center for Psychiatric Research and the Program in Medical and Population Genetics, Broad Institute of Harvard and MIT, Cambridge, Mass.; and the MRC Integrative Epidemiology Unit at the University of Bristol, School of Social and Community Medicine, Bristol, U.K.

Notes

Address correspondence to Dr. Bishop ([email protected]).

Funding Information

National Alliance for Research on Schizophrenia and Depression10.13039/100009670: 22379
Autism Science Foundation10.13039/100008152: 16-009
South-Eastern Norway Regional Health Authority: 2012101
Simons Foundation10.13039/100000893: 307705
Foundation for the National Institutes of Health10.13039/100000009: 06-M-0065, 1K01MH099286-01A1, NCT00271622, P50 MH106934
Supported by the Intramural Program of NIMH. Dr. Robinson was funded by NIMH grant 1K01MH099286-01A1 and NARSAD Young Investigator grant 22379. Dr. Havdahl is a member of the MRC Integrative Epidemiology Unit, which is supported by the University of Bristol and the UK Medical Research Council (MC_UU_12013/1). Drs. Werling and Sanders were funded by the Simons Foundation (research award 307705 to Dr. Sanders). Dr. Werling was funded by NIMH (P50 MH106934 to Dr. Nenad Sestan) and the Autism Science Foundation (16-009 to Dr. Werling).Dr. Bishop has received royalties from Western Psychological Services for the publication of the Autism Diagnostic Observation Schedule, 2nd Edition; all royalties received related to any research in which Dr. Bishop is involved are given to a not-for-profit agency. Dr. Willsey serves on an advisory panel for Daiichi Sankyo. The other authors report no financial relationships with commercial interests.

Metrics & Citations

Metrics

Citations

Export Citations

If you have the appropriate software installed, you can download article citation data to the citation manager of your choice. Simply select your manager software from the list below and click Download.

For more information or tips please see 'Downloading to a citation manager' in the Help menu.

Format
Citation style
Style
Copy to clipboard

View Options

View options

PDF/EPUB

View PDF/EPUB

Login options

Already a subscriber? Access your subscription through your login credentials or your institution for full access to this article.

Personal login Institutional Login Open Athens login
Purchase Options

Purchase this article to access the full text.

PPV Articles - American Journal of Psychiatry

PPV Articles - American Journal of Psychiatry

Not a subscriber?

Subscribe Now / Learn More

PsychiatryOnline subscription options offer access to the DSM-5-TR® library, books, journals, CME, and patient resources. This all-in-one virtual library provides psychiatrists and mental health professionals with key resources for diagnosis, treatment, research, and professional development.

Need more help? PsychiatryOnline Customer Service may be reached by emailing [email protected] or by calling 800-368-5777 (in the U.S.) or 703-907-7322 (outside the U.S.).
Media

Figures

Other

Tables

Share

Share

Share article link

Share