Polygenic Risk: Predicting Depression Outcomes in Clinical and Epidemiological Cohorts of Youths
Abstract
Objective:
Methods:
Results:
Conclusions:
Methods
Samples
Psychometric Measures
Clinical cohort.
The first epidemiological cohort.
The replication epidemiological cohort.
Genotyping Methods
Data Analysis
Results
| Clinical Cohort | Replication Epidemiological Cohort | |||||||||
|---|---|---|---|---|---|---|---|---|---|---|
| Characteristic | Case Subjects (N=279) | Control Subjects (N=187) | Epidemiological Cohort (N=1,450) | Age 8 (N=184) | Age 11 (N=317) | |||||
| N | % | N | % | N | % | N | % | N | % | |
| Female | 190 | 68.1 | 118 | 63.1 | 914 | 63.0 | 91 | 49.2 | 148 | 46.7 |
| Maternal educationa | ||||||||||
| Less than secondary school | 10 | 3.6 | 2 | 1.0 | 708 | 48.8 | 67 | 36.4 | 111 | 35.0 |
| Secondary school or more | 269 | 96.4 | 185 | 98.9 | 742 | 51.2 | 117 | 63.6 | 206 | 65.0 |
| Paternal education | ||||||||||
| Less than secondary school | 13 | 4.7 | 5 | 2.7 | 834 | 57.5 | — | — | — | — |
| Secondary school or more | 266 | 95.3 | 182 | 97.3 | 616 | 42.5 | — | — | — | — |
| Childhood abuse | — | — | — | — | ||||||
| None | 131 | 47.0 | 118 | 63.1 | 1,049 | 72.3 | — | — | — | — |
| One or more mild abuse types | 148 | 53.0 | 69 | 36.9 | 269 | 18.6 | — | — | — | — |
| One or more moderate abuse types | — | — | — | — | 86 | 5.9 | — | — | — | — |
| One or more severe abuse types | — | — | — | — | 46 | 3.2 | — | — | — | — |
| Mean | SD | Mean | SD | Mean | SD | Mean | SD | Mean | SD | |
| Age | 14.76 | 2.00 | 14.67 | 2.45 | 13.99 | 0.92 | 8.12 | 0.30 | 11.32 | 0.52 |
| Depressive symptomsb | ||||||||||
| Self-report | 0.19 | 0.95 | –1.11 | 0.21 | 11.53 | 7.71 | — | — | — | — |
| Maternal report | — | — | — | — | — | — | 55.30 | 6.06 | 55.24 | 6.48 |
| Paternal report | — | — | — | — | — | — | 53.48 | 5.28 | 53.60 | 5.74 |
Clinical Cohort
| Clinical Cohort | Epidemiological Cohort | ||||||||||||||
|---|---|---|---|---|---|---|---|---|---|---|---|---|---|---|---|
| Case-Control Status | Depression Severity | Age at Onset | Depressive Symptoms | Longitudinal Analyses | |||||||||||
| p Threshold | FDR | Original p | R2 | FDR | Original p | R2 | FDR | Original p | R2 | FDR | Original p | R2 | FDR | Original p | R2 |
| p<5×10⁻⁸ | 0.965 | 0.965 | 0 | 0.307 | 0.307 | 0.000 | 0.433 | 0.433 | 0 | 0.834 | 0.834 | 0 | 0.098 | 0.067 | 0.004 |
| p<1×10⁻⁵ | 0.915 | 0.784 | 0.048 | 0.051 | 0.029 | 0.014 | 0.076 | 0.054 | 0.009 | 0.584 | 0.500 | 0.000 | 0.367 | 0.367 | 0.001 |
| p<1×10⁻⁴ | 0.230 | 0.164 | 0.006 | 0.045 | 0.019 | 0.017 | 0.037 | 0.005 | 0.021 | 0.099 | 0.071 | 0.001 | 0.098 | 0.070 | 0.004 |
| p<1×10⁻³ | 0.136 | 0.078 | 0.010 | 0.087 | 0.074 | 0.008 | 0.176 | 0.148 | 0.004 | 0.028 | 0.012 | 0.003 | 0.180 | 0.154 | 0.002 |
| p<0.01 | 0.003 | 0.001 | 0.030 | 0.036 | 0.01 | 0.021 | 0.047 | 0.016 | 0.015 | 0.042 | 0.024 | 0.003 | 0.098 | 0.054 | 0.005 |
| p<0.05 | 4.97×10⁻⁴ | 1.17×10⁻⁴ | 0.050 | 0.029 | 0.004 | 0.018 | 0.047 | 0.02 | 0.016 | 0.020 | 0.005 | 0.004 | 0.067 | 0.010 | 0.009 |
| p<0.10 | 4.97×10⁻⁴ | 1.42×10⁻⁴ | 0.047 | 0.075 | 0.053 | 0.010 | 0.067 | 0.038 | 0.010 | 0.020 | 0.006 | 0.004 | 0.067 | 0.019 | 0.007 |
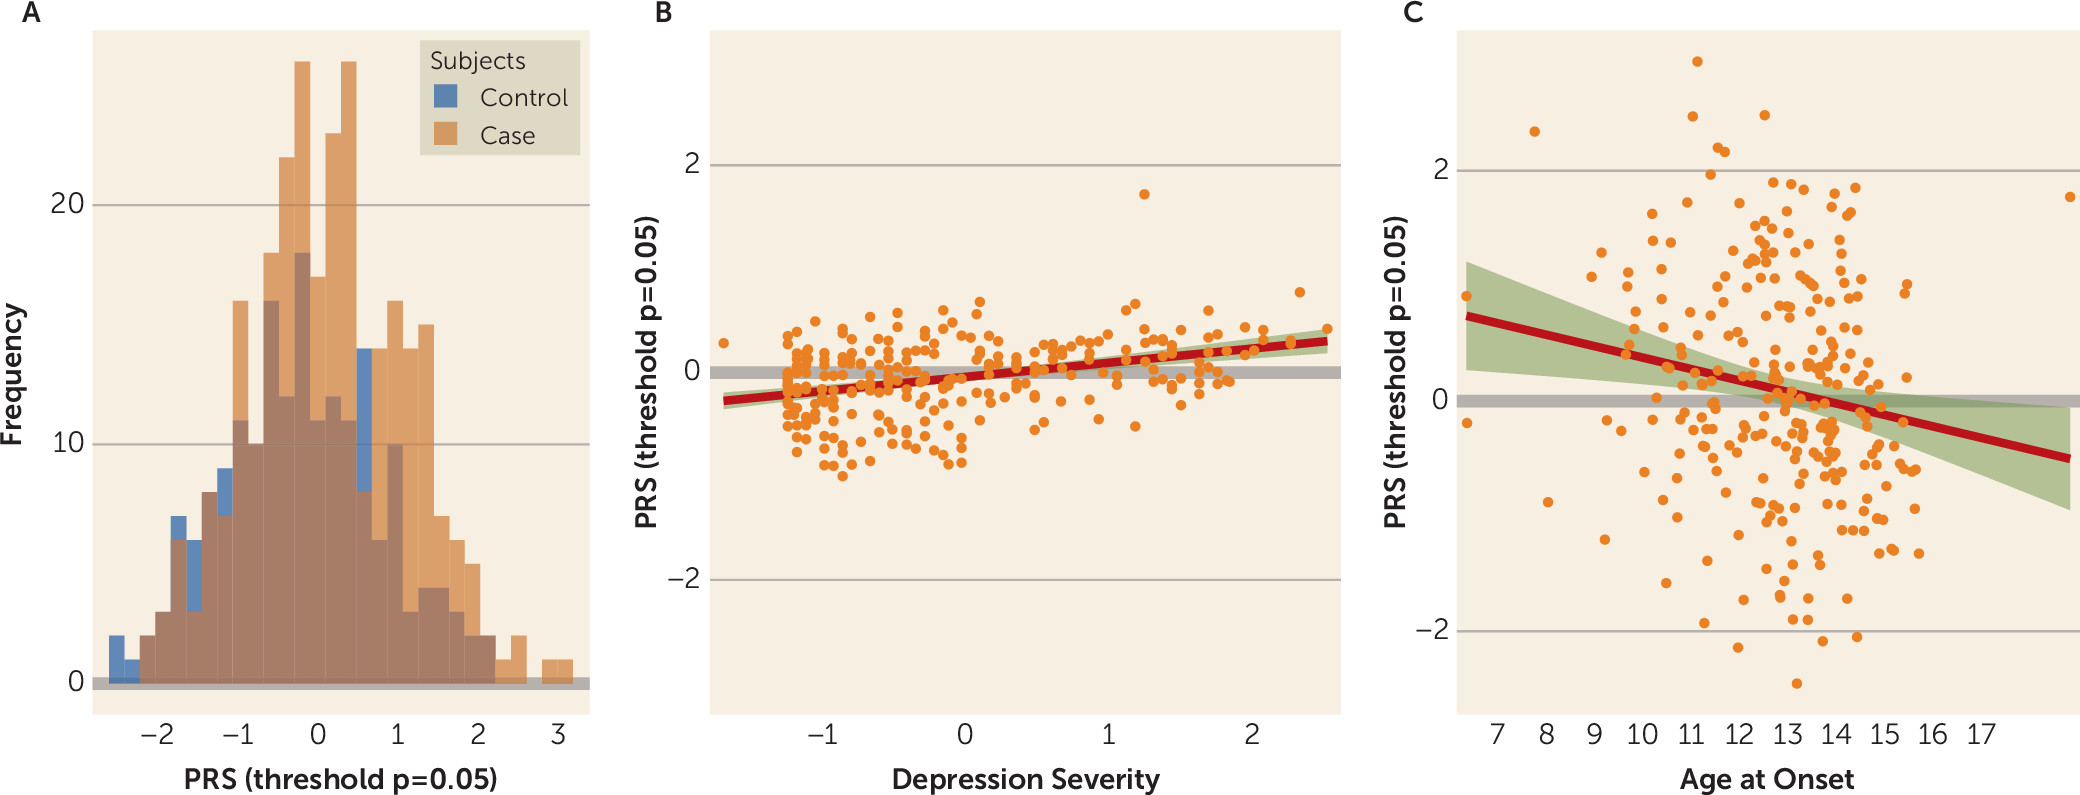
| Cohort, Outcome, and Model | Variable | Odds Ratio, β, or Hazard Ratio | SE | 95% CI | p (false-discovery-rate-corrected) | Original p | R2 | Model Comparison (p) |
|---|---|---|---|---|---|---|---|---|
| Clinical cohort | ||||||||
| Case-control status (odds ratio) | ||||||||
| Null model | — | — | — | — | — | — | 0.030 | — |
| G | PRS | 1.560 | 1.130 | 1.230, 1.980 | 0.001 | 2.48×10⁻⁴ | 0.079 | 1.637×10⁻⁴ |
| G+E | PRS | 1.578 | 1.135 | 1.230, 2.024 | 0.002 | 3.39×10⁻⁴ | 0.179 | 2.807×10⁻¹¹ |
| Childhood abuse | 3.924 | 1.292 | 2.376, 6.472 | 8.12×10⁻⁴ | 9.020×10⁻⁸ | |||
| G×E | PRS | 1.677 | 1.171 | 1.231, 2.284 | 0.003 | 0.001 | 0.181 | 0.436 |
| Childhood abuse | 3.896 | 1.289 | 2.366, 6.411 | 8.12×10⁻⁴ | 8.950×10⁻⁸ | |||
| PRS and childhood abuse interaction | 0.838 | 1.300 | 0.502, 1.401 | 0.501 | 0.501 | |||
| Depression severity (β) | ||||||||
| Null model | — | — | — | — | — | — | 0.058 | — |
| G | PRS | 0.177 | 0.069 | 0.021, 0.288 | 0.010 | 0.004 | 0.077 | 0.004 |
| G+E | PRS | 0.149 | 0.066 | 0.019, 0.279 | 0.043 | 0.026 | 0.135 | 1.220×10⁻⁴ |
| Childhood abuse | 0.494 | 0.126 | 0.247, 0.741 | 0.002 | 6.20×10⁻⁴ | |||
| G×E | PRS | 0.239 | 0.091 | 0.060, 0.417 | 0.020 | 0.009 | 0.139 | 0.153 |
| Childhood abuse | 0.519 | 0.127 | 0.270, 0.768 | 0.087 | 6.250×10⁻⁵ | |||
| PRS and childhood abuse interaction | –0.187 | 0.131 | –0.444, 0.069 | 0.184 | 0.153 | |||
| Age at onset (β) | ||||||||
| Null model | — | — | — | — | — | — | 0.443 | — |
| G | PRS | –0.375 | 0.160 | –0.688, –0.062 | 0.036 | 0.020 | 0.459 | 0.024 |
| G+E | PRS | –0.374 | 0.158 | –0.683, –0.065 | 0.036 | 0.019 | 0.471 | 0.040 |
| Childhood abuse | –0.600 | 0.289 | –1.167, –0.034 | 0.060 | 0.040 | |||
| G×E | PRS | –0.191 | 0.238 | –0.658, 0.276 | 0.450 | 0.425 | 0.471 | 0.307 |
| Childhood abuse | –0.540 | 0.295 | –1.118, 0.038 | 0.089 | 0.069 | |||
| PRS and childhood abuse interaction | –0.321 | 0.313 | –0.934, 0.292 | 0.345 | 0.307 | |||
| Epidemiological cohort | ||||||||
| Depressive symptoms (β) | ||||||||
| Null model | — | — | — | — | — | — | 0.071 | — |
| G | PRS | 0.557 | 0.200 | 0.167, 0.947 | 0.012 | 0.005 | 0.075 | 0.005 |
| G+E | PRS | 0.439 | 0.196 | 0.055, 0.823 | 0.038 | 0.025 | 0.107 | 5.071×10⁻¹³ |
| Childhood abuse | 4.935 | 0.677 | 3.609, 6.262 | 6.080×10⁻⁶ | 5.070×10⁻¹³ | |||
| G×E | PRS | 0.346 | 0.206 | –0.057, 0.748 | 0.112 | 0.093 | 0.108 | 0.131 |
| Childhood abuse | 4.642 | 0.704 | 3.262, 6.022 | 3.620×10⁻⁴ | 6.040×10⁻¹¹ | |||
| PRS and childhood abuse interaction | 1.010 | 0.669 | –0.301, 2.320 | 0.143 | 0.131 | |||
| Epidemiological cohort | ||||||||
| Prospective moderate to severe depressive symptoms (hazard ratio) | ||||||||
| Null model | — | — | — | — | — | — | 0.035 | — |
| G | PRS | 1.202 | 0.071 | 1.045, 1.383 | 0.020 | 0.010 | 0.044 | 0.010 |
| G+E | PRS | 1.171 | 0.073 | 1.016, 1.350 | 0.039 | 0.029 | 0.078 | 4.302×10⁻⁷ |
| Childhood abuse | 2.817 | 0.184 | 1.963, 4.043 | 6.750×10⁻⁵ | 1.940×10⁻⁸ | |||
| G×E | PRS | 1.194 | 0.079 | 1.024, 1.393 | 0.038 | 0.024 | 0.079 | 0.514 |
| Childhood abuse | 2.942 | 0.193 | 2.015, 4.294 | 6.750×10⁻⁵ | 2.250×10⁻⁸ | |||
| PRS and childhood abuse interaction | 0.877 | 0.201 | 0.592, 1.300 | 0.513 | 0.513 | |||
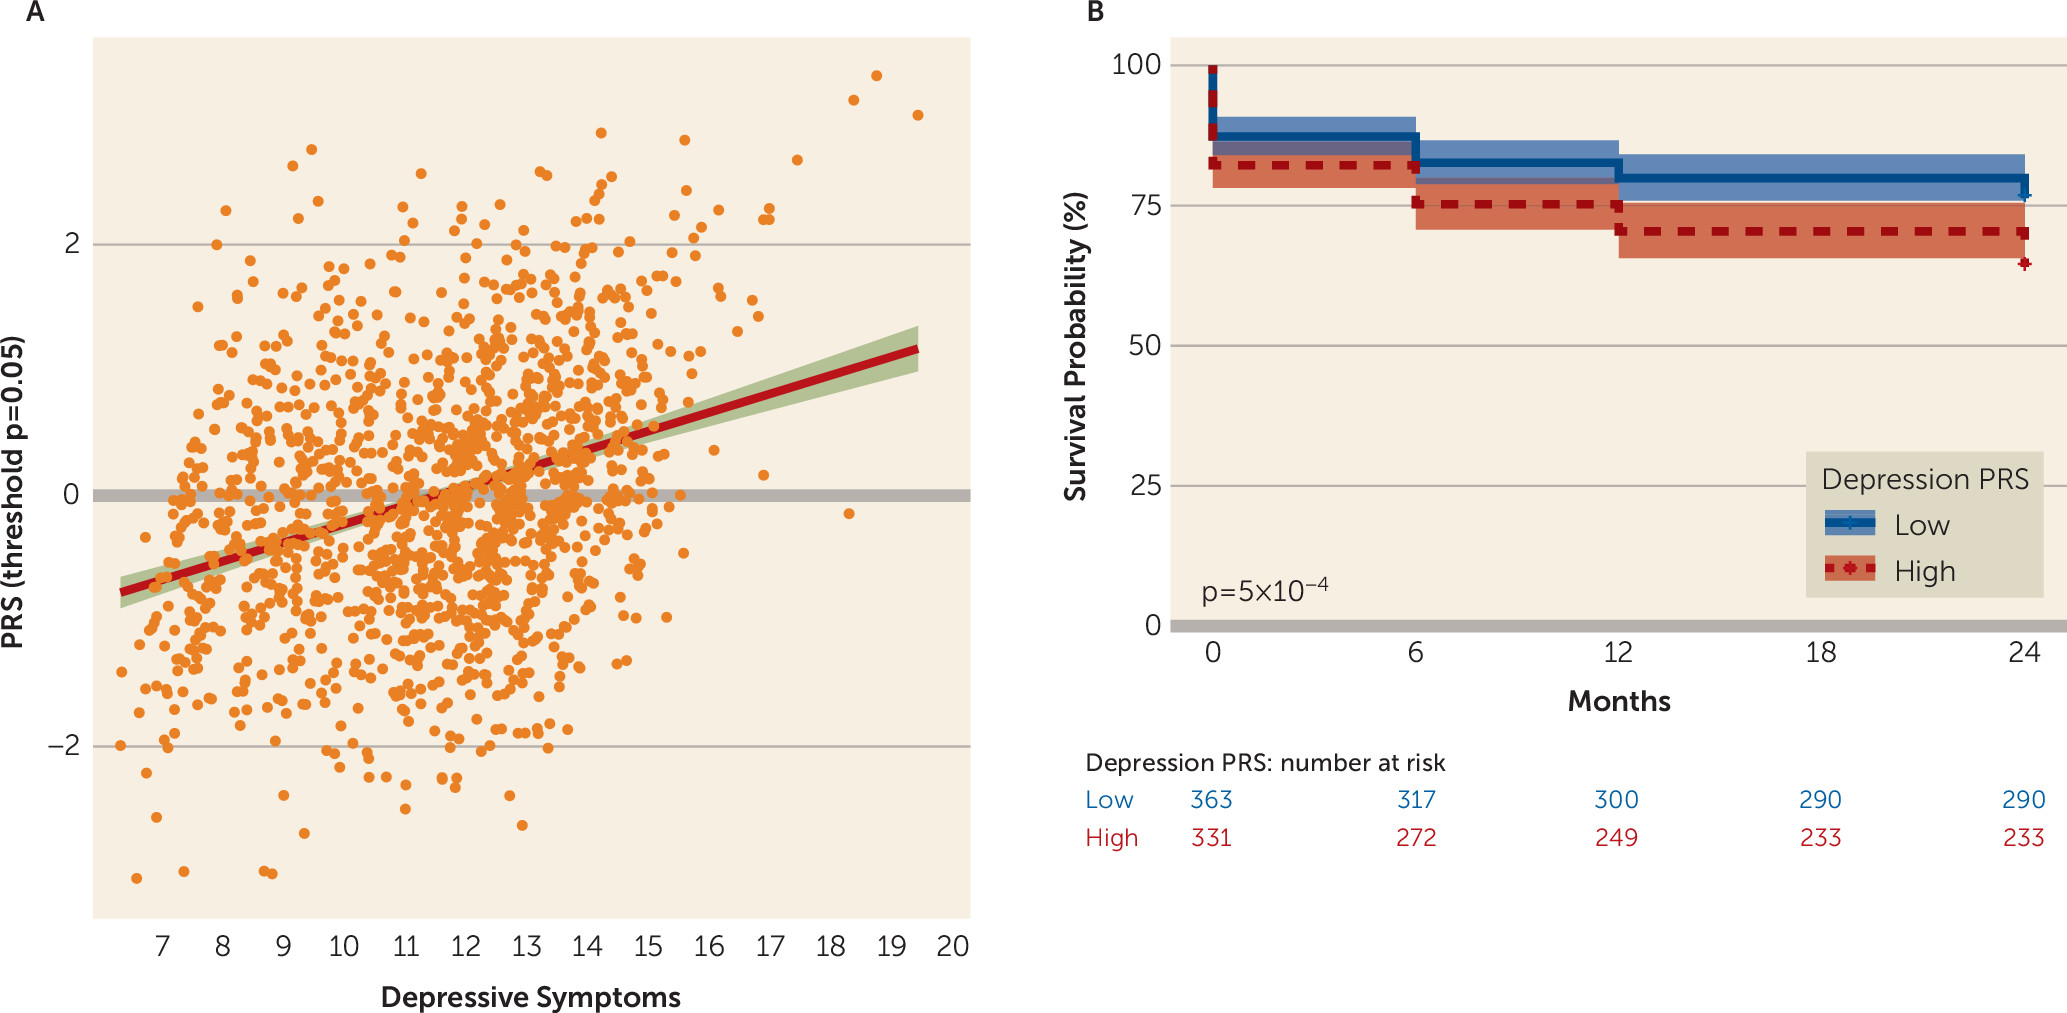
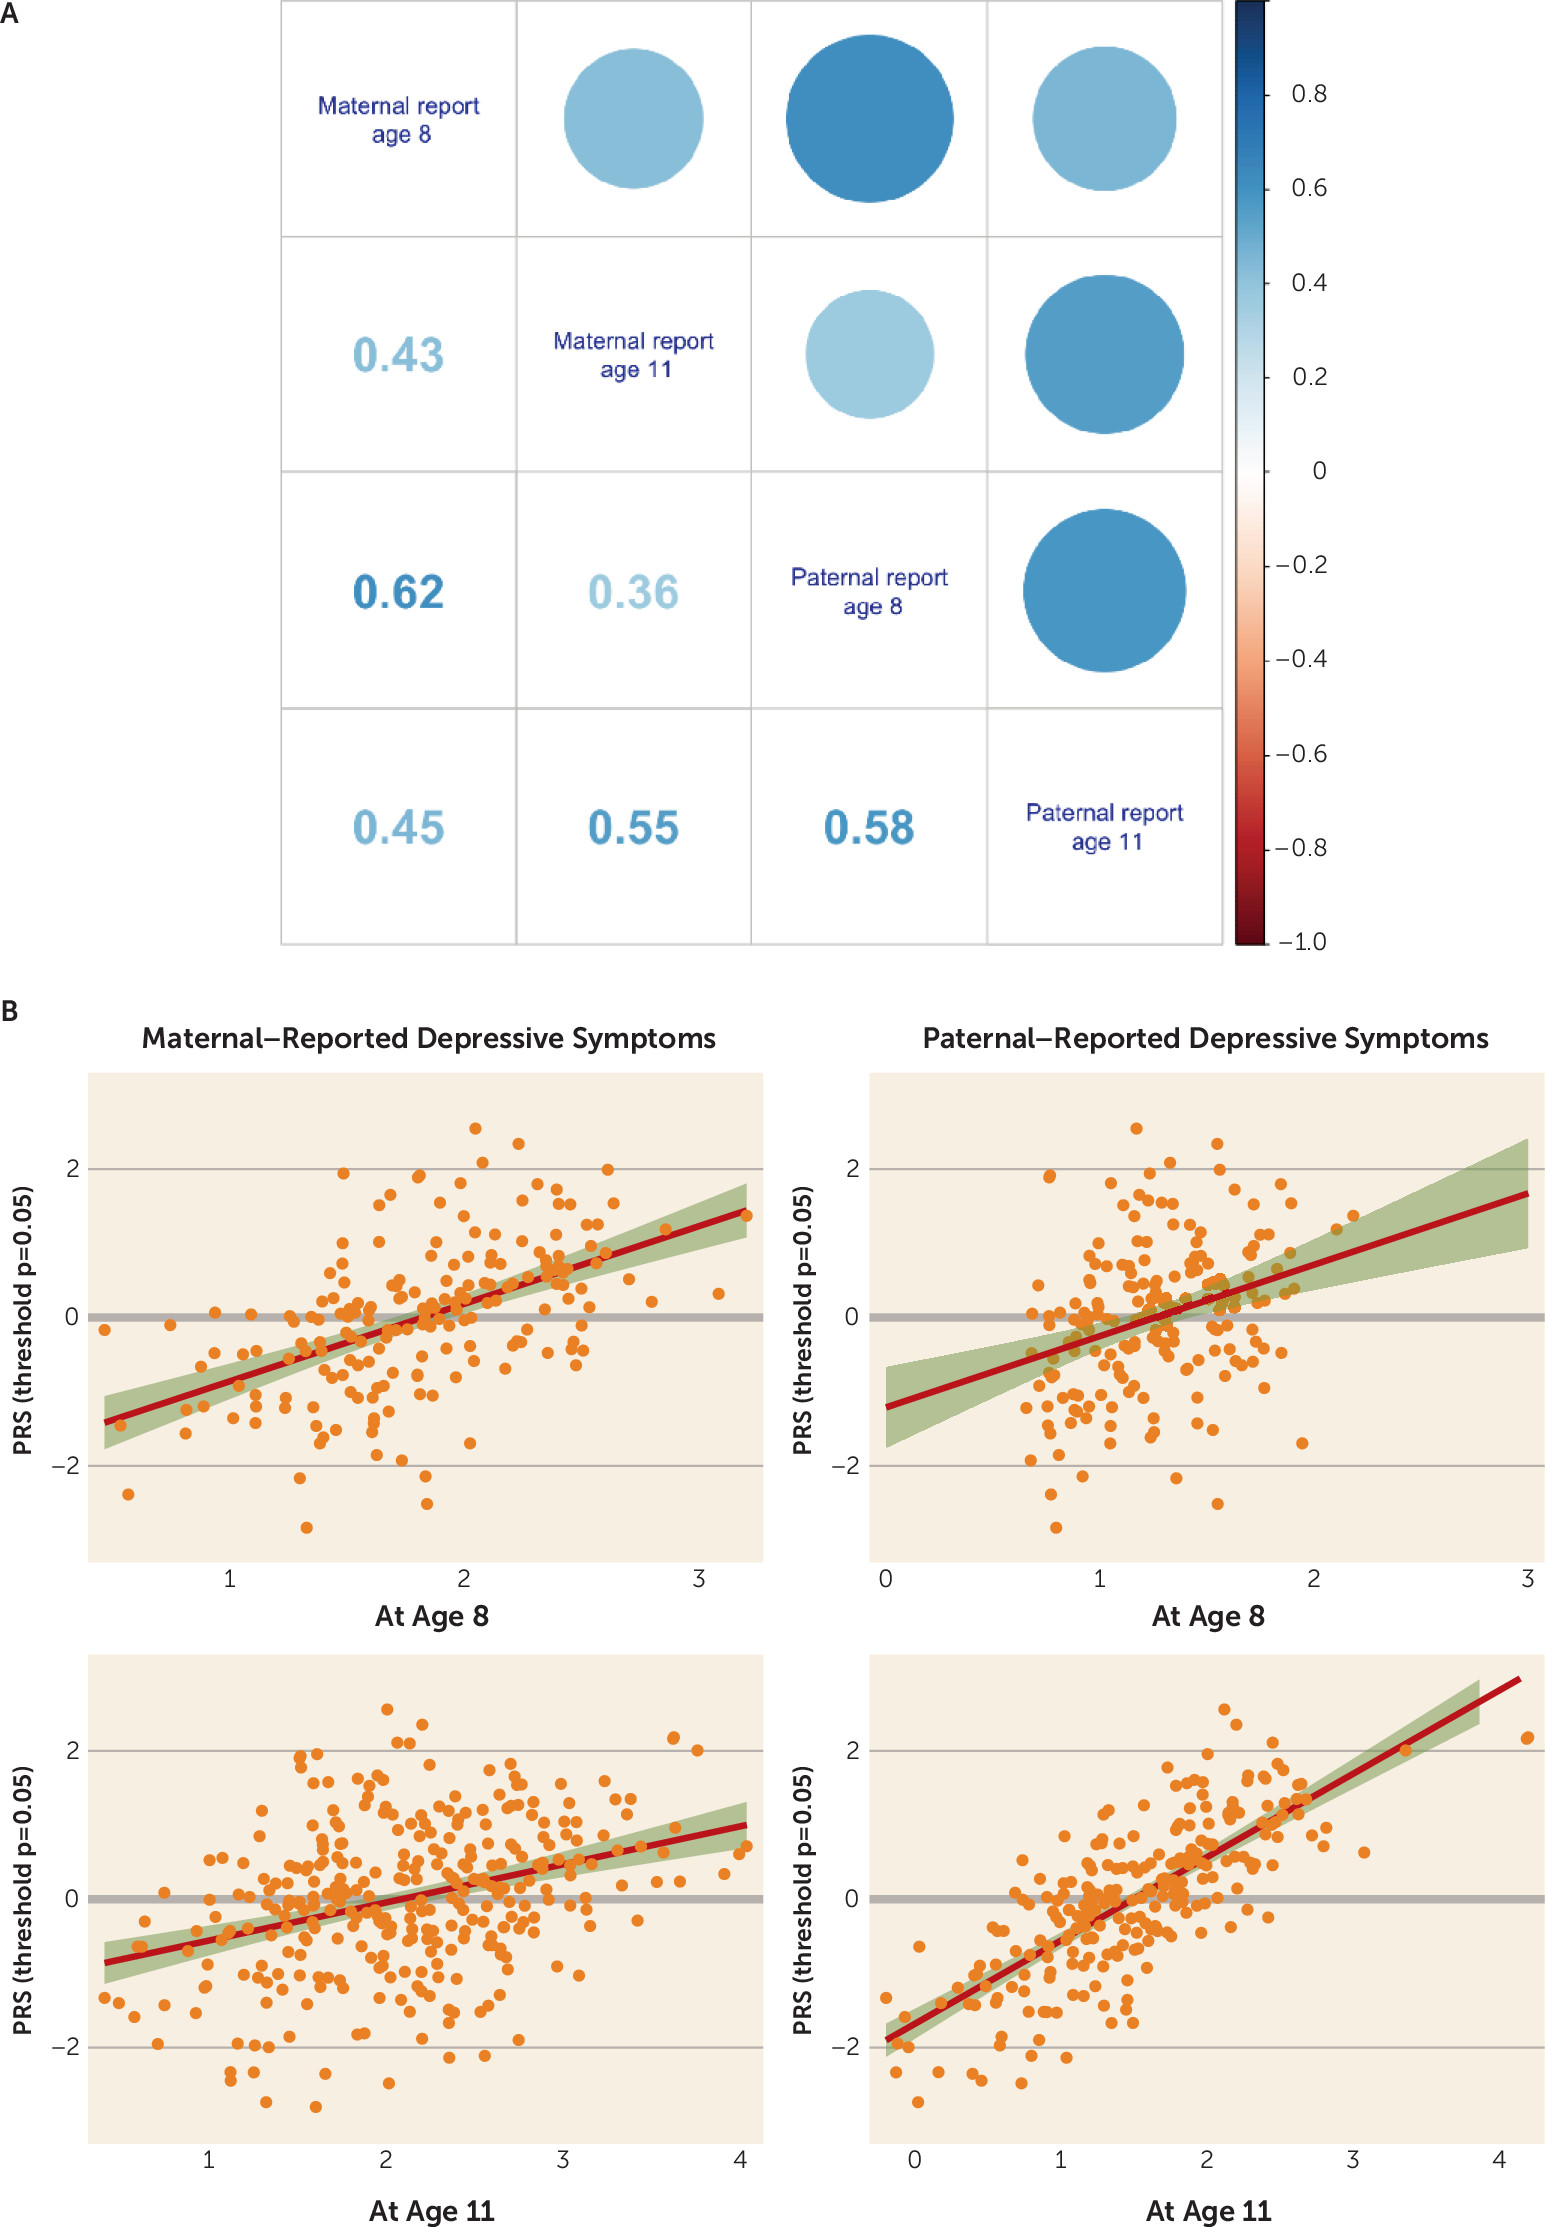
Epidemiological Cohorts
Discussion
PRS, Major Depression, and Child and Adolescent Depression
PRS, Major Depression, and Prediction of Future Risk
Depression PRS and Child Abuse
Limitations
Conclusions
Acknowledgments
Supplementary Material
- View/Download
- 346.84 KB
References
Information & Authors
Information
Published In
History
Keywords
Authors
Author Contributions
Funding Information
Metrics & Citations
Metrics
Citations
Export Citations
If you have the appropriate software installed, you can download article citation data to the citation manager of your choice. Simply select your manager software from the list below and click Download.
For more information or tips please see 'Downloading to a citation manager' in the Help menu.
