The pursuit of imaging-based biomarkers for autism spectrum disorder (ASD) has been challenged by a lack of biological accounts (
1,
2) and divergent research results (
3–
5), owing largely to the constraints of ASD’s substantial heterogeneity and comorbidity with other diseases, such as obsessive-compulsive disorder (OCD) and attention deficit hyperactivity disorder (ADHD) (
6–
8). The high frequency of comorbidity could be a result of shared genetic vulnerability and pathophysiology, secondary effects of growing up with autism, shared symptom domains and associated mechanisms, or overlapping diagnostic criteria (
9,
10). Emerging evidence from recent trans-diagnostic neuroimaging studies reveals that ASD-ADHD and ASD-OCD may share common features of a dysfunctional brain network, such as regions of high hubness (
7,
11). Given the daunting clinical heterogeneity of ASD, a subset of homogeneous samples with a single genetic etiology may help disentangle the complexity of ASD by establishing a tangible, symptom-related pathway from gene to brain to behavior (
12). As extensively demonstrated in both humans (
13) and rodent models (
14,
15), methyl-CpG binding protein 2 (
MECP2) is one of few exceptional genes causing autistic features, including intellectual disability, motor dysfunction, anxiety, and social behavior deficits. Mutation of the X-linked
MECP2 gene is found in 90% of patients with Rett syndrome. Duplications of
MECP2-containing genomic segments cause
MECP2 duplication syndrome, which shares core symptoms with ASD (
13,
16). The most recent reports on nonhuman primates have further demonstrated that
MECP2 gain and loss of function in genetically engineered monkeys recapitulate typical phenotypes in autism, such as less active social contact, increased stereotypical behaviors, and elevated anxiety (
17,
18). More efficiently, acute viral-based molecular manipulation in the primate amygdala has been successfully used to probe a causal role for multiple components of the circuit that may underlie early-life anxiety (
19–
21). Cumulative evidence from primate genetic models suggests that they have substantial potential to deepen our mechanistic understanding of psychiatric disorders and inform the development of effective therapeutics (
12,
17,
18,
22).
Comparative analyses of brain connectomics in closely related species demonstrate a functional resemblance between macaque monkeys and humans under healthy conditions (
23–
25) and have laid the foundation for exploiting knowledge acquired from nonhuman primate disease models to identify viable diagnostic markers for human brain disorders. Nevertheless, there exists no translational road map that describes the brain-wide mapping of neural circuits between a primate genetic model and human psychiatric patients (
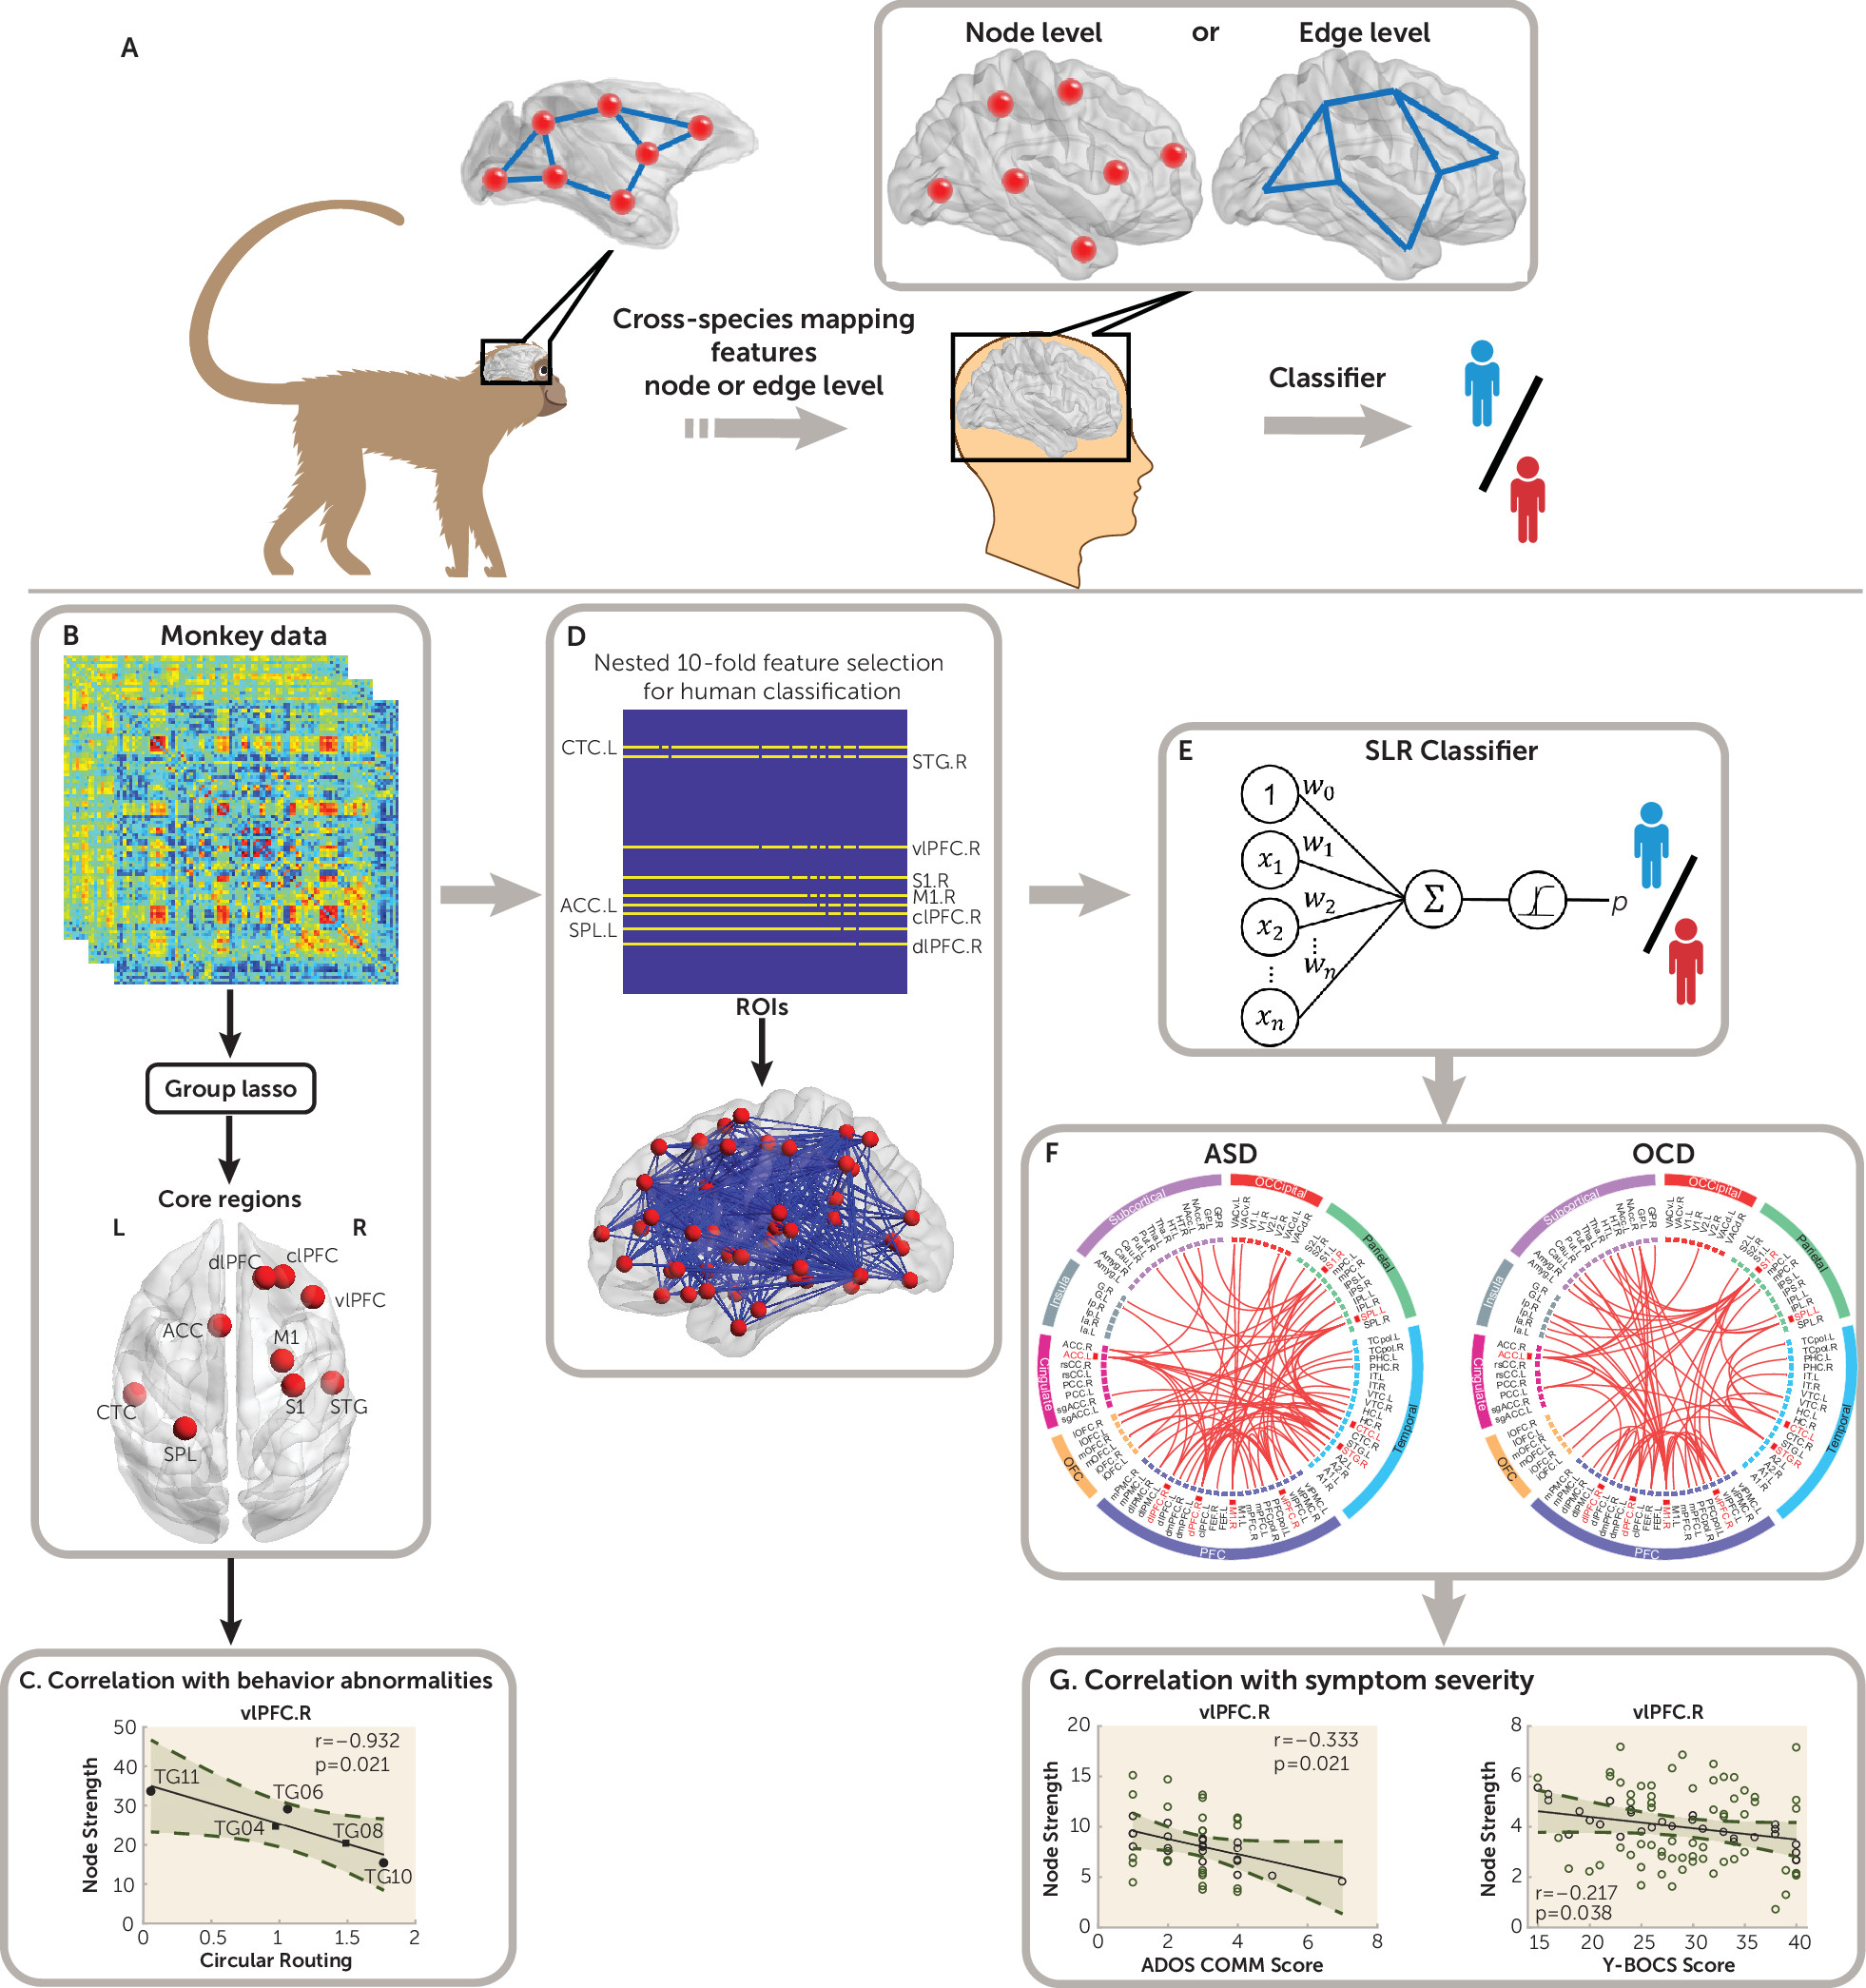
26). Thus, we propose a novel cross-species machine-learning framework that leverages connectome-based features learned from a primate genetic model of autism and then builds a classifier for diagnostic utility in humans.
The conceptual design of this cross-species framework originated from considering what features can be learned from the monkey model that capture the underlying neural pathophysiology that is likely shared with ASD patients. Within the network graph setting (
25), two basic elements of brain circuitry—nodes (brain regions) and interconnecting edges (connections between pairs of nodes)—are considered (
25,
27). Our intuition was that characteristics of nodes are more likely to be homologous between the primate species, given the substantial variations of edges subserving species-specific behavioral and cognitive adaptations (
22,
25,
28). Moreover, supposing that only a subset of brain regions (not the entire brain) are particularly relevant to the core neuropathology of autism (termed “core regions” here) (
4,
29), we deduced that only these core regions are useful for significantly reducing the complexity of cross-species mapping of this framework (
Figure 1A).
We therefore adopted the group lasso feature selection process (
30,
31) to determine core regions by treating all edges connecting to one region as a group (i.e., rows in an adjacency matrix). Next, we performed a one-to-one mapping of the identified core regions in the human brain network and used them as seeds to construct classifiers for patient classification. By using whole-brain functional connectivity data sets obtained from wild-type and
MECP2 transgenic monkeys (
17) and from four human data sets—the Autism Brain Imaging Data Exchange (ABIDE-I), N=1,112 (
3); ABIDE-II, N=1,114 (
32); the ADHD-200 sample, N=776 (
33); and an OCD local institutional database (N=186) (
34)—we aimed to test two specific hypotheses: whether the monkey-derived features (core regions) could inform diagnostic classification in the ASD cohort and whether these monkey-derived features could be generalized to differentiate patients from healthy comparison subjects in the OCD and ADHD cohorts. To further parse the biological accounts of the monkey-derived classifiers, stepwise linear regression models based on features (i.e., functional connections of the monkey-derived classifiers) were built to predict clinical measures of symptom severity in patients.
Methods
Data Sets
In this study, we included one monkey data set and four independent human data sets. The monkey data set comprised five MECP2-duplication transgenic monkeys (Macaca fascicularis: mean age, 4.40 years [SD=0.29], mean weight, 3.26 kg [SD=0.75]; two males and three females) and 11 wild-type monkeys (Macaca fascicularis: mean age, 4.68 years [SD=0.46], mean weight, 3.97 kg [SD=1.36]; four males and seven females). Characteristics of the monkey data set are provided in Table S1 in the online supplement. All experimental procedures for animal subjects were approved by the Institutional Animal Care and Use Committee of the Institute of Neuroscience and the Biomedical Research Ethics Committee of the Shanghai Institutes for Biological Sciences, Chinese Academy of Sciences, and conformed to the National Institutes of Health guidelines for the humane care and use of laboratory animals. Details of animal preparation are provided in the online supplement.
We analyzed data from the two publicly available ABIDE repositories, ABIDE-I (
3) and ABIDE-II (
32), one ADHD cohort from the ADHD-200 sample (
33), and one OCD cohort from our local institutional database. Similar to other ABIDE and ADHD studies, inclusion and exclusion criteria for participants included right-handedness, a full IQ score >80, known current medication status, and images accepted after quality control and meeting head motion criteria. Additional information on the characteristics of the study participants is provided in the
online supplement. Data were available for a total of 336 study subjects from ABIDE-I (ASD group: N=133, male:female ratio, 118:15; healthy control group: N=203, male:female ratio, 167:36) (see also Table S2 in the
online supplement), 149 study subjects from ABIDE-II (ASD group: N=60, male:female ratio, 56:4; healthy control group: N=89, male:female ratio, 62:27) (see also Table S3 in the
online supplement), and 266 study subjects from the ADHD-200 cohort (ADHD group: N=96, male:female ratio, 79:17; healthy control group: N=170, male:female ratio, 97:73) (see also Table S4 in the
online supplement). For the OCD data set, exclusion criteria were translation or rotation in any axis of head motion larger than 3 mm or 3° during scanning; any neurological disorders, psychosurgery, current or past substance abuse or dependence, or pregnancy; and any relevant physical illness, such as brain tumor or brain injury. The OCD cohort comprised 171 participants (OCD group: N=92, male:female ratio, 55:37; healthy control group: N=79, male:female ratio, 51:28) (see also Table S5 in the
online supplement).
Monkey MRI Data Acquisition and Preprocessing
A total of 144 functional MRI (fMRI) data sets from all monkeys were acquired from the Institute of Neuroscience, Chinese Academy of Sciences, on a 3-T whole-body scanner (Trio, Siemens Healthcare, Erlangen, Germany), running with an enhanced gradient coil insert (AC88; 80 mT/m maximum gradient strength, 800 mT/m per second maximum slew rate). Whole-brain resting-state fMRI data were collected using a gradient-echo echo-planar sequence, and high-resolution T
1-weighted anatomical images were acquired using a magnetization prepared rapid gradient echo sequence. The acquisition and preprocessing of monkey MRI data are described elsewhere (
35), as well as in the
online supplement.
Human MRI Data Acquisition and Preprocessing
Details of the public data are available online for ABIDE-I/II and the ADHD-200 sample (
http://fcon_1000.projects.nitrc.org/indi/abide and
http://fcon_1000.projects.nitrc.org/indi/adhd200). For the OCD data set, resting-state fMRI and high-resolution three-dimensional T
1-weighted data sets were collected with a 12-channel head coil on a Siemens Tim Trio 3-T scanner. Details of the scan protocol are provided in Table S6 in the
online supplement. The preprocessing of ABIDE-I was performed by the Preprocessed Connectomes Project (
http://preprocessed-connectomes-project.org/abide/index.html) using the Data Processing Assistant for Resting-State fMRI toolbox (
36). The same preprocessing pipeline was applied to the ABIDE-II, ADHD, and OCD data sets; technical details are summarized in the
online supplement.
Monkey and Human Brain Parcellation and Network Construction
The cortical organizations of both monkeys and humans were parcellated in accordance with the regional map template (
37,
38). Because the regional map parcellation does not include subcortical regions, subcortical parcellation for the two species was added on the basis of the INIA19 primate brain atlas (
39) and the FreeSurfer template (
40), respectively. This generated a whole-brain template with a total of 94 regions of interest for both monkeys and humans. Anatomical regions are listed in Table S7 in the
online supplement. Pearson’s correlation coefficients between the mean time courses of any pair of regions were calculated to represent their functional connectivity, resulting in a 94×94 connectivity network matrix. Fisher’s z transformation was then applied to the connectivity matrix, which was subject to a covariate-regression procedure. Both age (linear and quadratic) and sex were used as covariates for monkey and human data. When information on full IQ score, site, current medication status, and eyes opened/closed condition were available at the time of scanning, they were used as additional covariates for human data.
Cross-Species Diagnostic Classification for Humans
We adopted a sparse linear regression model based on the group lasso penalty (
30,
31), which is designed to eliminate a group of edges simultaneously. Here, we treated all edges connecting to one brain region as a group (i.e., rows in an adjacency matrix): if a specific brain region is irrelevant, then coefficients of all connections should be adjusted to zero. The penalty is deployed to impose a network structure and thereby regularize the problem (i.e., core regions versus nonrelevant regions) (
Figure 1B). It automatically and objectively identified nine core regions (
Figure 1B) from the monkey data. Using these nine core regions as seeds, a monkey-derived classifier composed of the functional connections of the human functional connectome was constructed (
Figure 1D). Specifically, using the standard lasso method with a 10×10 nested cross-validation (
41), we determined a subset of relevant, nonredundant edge features of all 801 functional connections among nine core regions for use in classification. The lasso was applied with L1-norm penalty to achieve a sparse model by excluding the majority of features from the model (
41). The sparsity of the model facilitated the optimization of predictors and reduced the model complexity (
42). A sparse logistic regression (
43) in tandem with leave-one-participant-out cross-validation was then implemented to distinguish patients with ASD from healthy control subjects (for further details, see Figure S1 in the
online supplement).
To test the robustness of the monkey-derived classifier, we compared the predictive accuracies of the monkey-derived classifier with that of the randomization classifier and the human-derived classifier, using McNemar’s test (
44). Specifically, the randomization classifier was constructed on the basis of a randomly selected nine out of 94 regions, and the human-derived classifier was constructed on the basis of core regions identified from the ASD cohort (for further details, see the
online supplement). Finally, the monkey-derived classifier was applied to the OCD and ADHD data sets.
Statistical Analysis and Associations With Symptom Severity
A two-sample t test was applied to evaluate whether a difference in the node strength of nine core regions existed between transgenic and wild-type monkeys. The significance threshold was set at a p value of 0.05 (false-discovery-rate corrected). We quantitatively evaluated the distribution of functional connections for distinguishing patients from healthy comparison subjects in the ASD and OCD cohorts. We sorted functional connections on the basis of lobar location (i.e., prefrontal lobe, orbitofrontal lobe, temporal lobe, parietal lobe, occipital lobe, cingulate cortex, insula, and subcortical region). The spatial profiles of the functional connections were compared by intralobe and interlobe connections (i.e., whether node-to-node functional connections belong to the same lobe or different lobes). One-sided Fisher’s exact test was applied to assess shared and disorder-specific functional connections between ASD and OCD. The significance threshold was set at a p value of 0.05 (one-tailed).
To investigate brain-behavior associations, we conducted Pearson’s correlation analyses between the node strength of each core region and behavior abnormalities in transgenic monkeys (
17) or symptom severity in patients with ASD and OCD (p<0.05, subject to false-discovery-rate correction for multiple comparisons). For the core regions that showed significant correlations with symptom severity scores (but did not withstand false-discovery-rate correction), we conducted a post hoc analysis for core region-based functional connections and dimensional symptom severity using a stepwise linear regression model, which modeled the relationship between the dependent variable (symptom severity score) and independent variables (functional connections to a specific region). For each model, the stepwise regression method iteratively determined a combination of functional connections that were linearly linked to dimensional symptoms. At each iteration, one connection was added or removed from the model for better fitting. The Pearson correlation coefficient and r
2 between the predicted values and its measured values were used to assess the performance of the regression model. The significance threshold of associations of functional connections with dimensional symptoms was set at a p value of 0.05 (subject to false-discovery-rate correction).
Results
Core Region Mapping Between Two Primate Species
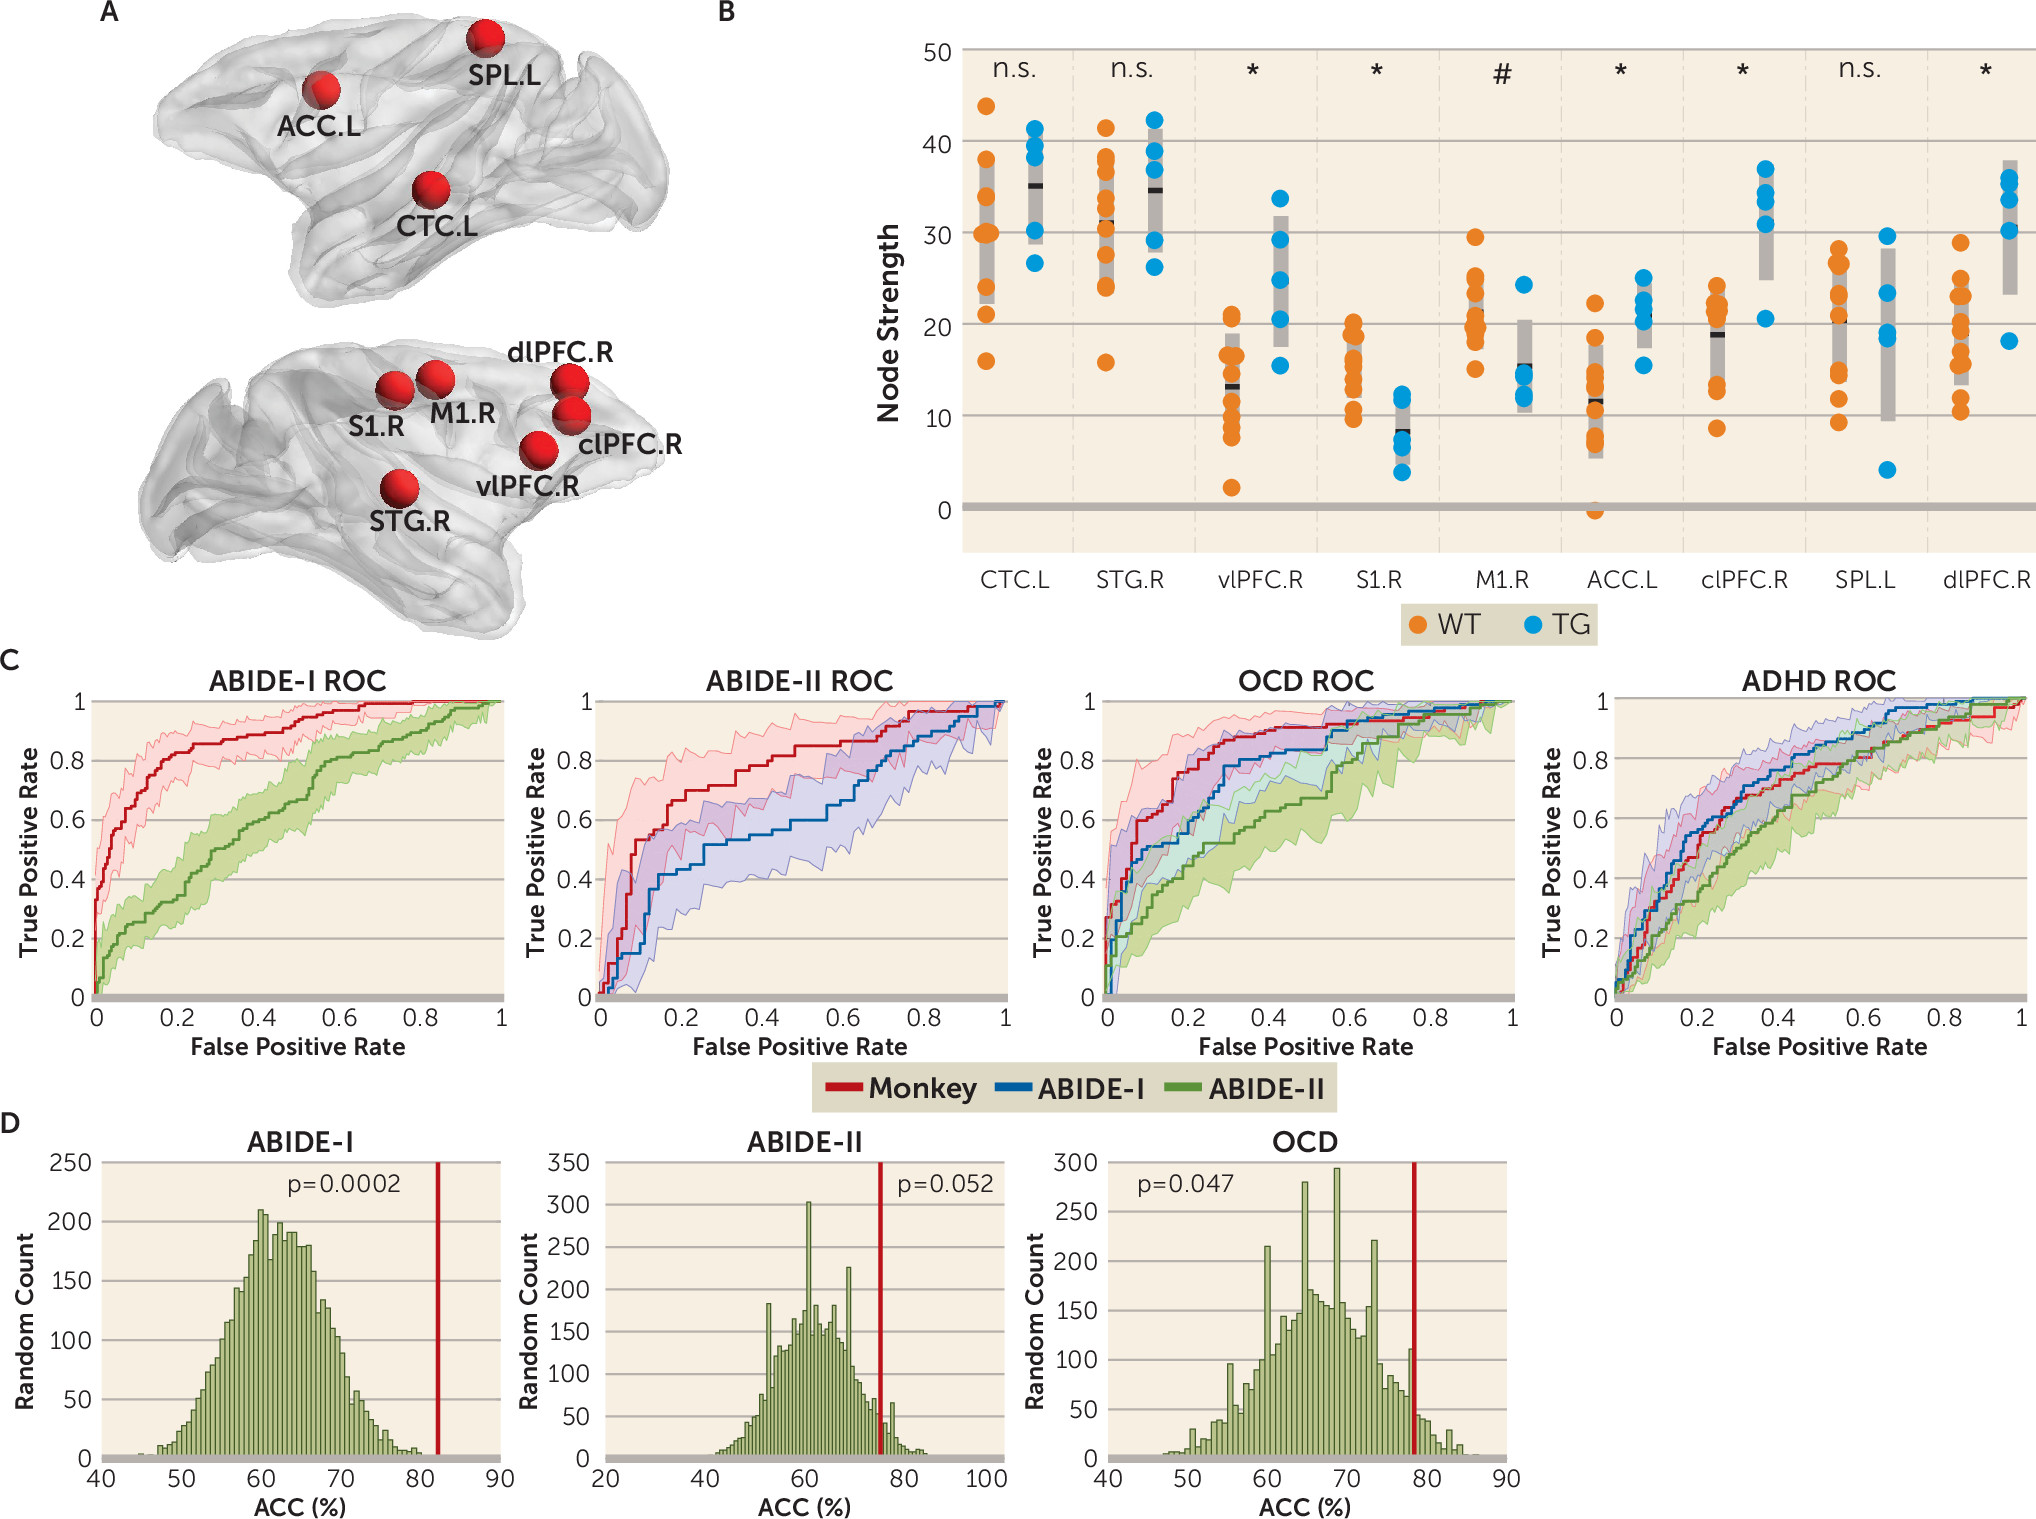
The group lasso algorithm identified nine core regions out of 94 nodes of the monkey brain: the left central temporal cortex, right superior temporal cortex (STG), right dorsolateral prefrontal cortex (dlPFC), right primary somatosensory cortex, right primary motor cortex, left anterior cingulate cortex (ACC), right centrolateral prefrontal cortex, left superior parietal cortex, and right ventrolateral prefrontal cortex (vlPFC) (
Figure 2A). Compared with the wild-type group, the transgenic group exhibited significantly increased node strength in the right vlPFC (p=0.004), left ACC (p=0.008), right centrolateral PFC (p=0.001), and right dlPFC (p=0.004) (
Figure 2B). In contrast, the right primary somatosensory cortex (p=0.002) and right primary motor cortex (p=0.025) showed decreased node strength in the transgenic group (
Figure 2B). In addition, we observed a significant negative relationship between the right vlPFC and circular routing (r=–0.932, p=0.021) and between the left superior parietal cortex and locomotion (r=–0.922, p=0.026) (see also Figure S2 in the
online supplement). Conversely, node strength in the left ACC was positively associated with relative circular routing in the transgenic group (r=0.910, p=0.032) (see also Figure S2 in the
online supplement).
Highly Accurate Monkey-Derived Classifier for ASD
In the ABIDE-I cohort, the monkey-derived classifier achieved an accuracy of 82.14% (95% CI=77.53, 86.00; permutation test, p<0.001 [see also Figure S3 in the
online supplement]), a sensitivity of 79.70% (95% CI=71.66, 85.98), and a specificity of 83.74% (95% CI=77.78, 88.40), corresponding to an area under the receiver operating characteristic curve of 0.884 (
Figure 2C; see also Table S8 in the
online supplement). In the independent ABIDE-II cohort, the monkey-derived classifier also achieved performance with an accuracy of 75.17% (95% CI=67.30, 81.71; permutation test, p=0.014 [see also Figure S3 in the
online supplement]), a sensitivity of 70.00% (95% CI=56.63, 80.80), and a specificity of 78.65% (95% CI=68.43, 86.35), and the area under the curve was 0.769 (
Figure 2C; see also Table S8 in the
online supplement).
In the ABIDE-II data set, the same group lasso algorithm identified nine core regions: the left STG, left dorsal part of the anterior visual area, left secondary visual cortex, right primary motor cortex, left and right ACC, right centrolateral PFC, right vlPFC, and right globus pallidus (see also Figure S4 in the
online supplement). The classifier based on these core regions achieved an accuracy of 61.31% (95% CI=55.85, 66.51), a sensitivity of 56.39% (95% CI=47.53, 64.88), a specificity of 64.53% (95% CI=57.49, 71.02), and an area under the curve of 0.644 in the ABIDE-I cohort (
Figure 2C; see also Table S8 in the
online supplement), which was significantly lower than that for the monkey-derived classifier (p<0.001; see also Table S8 in the
online supplement). Similarly, in the ABIDE-I data set, this group lasso algorithm identified four core regions: the left thalamus, right primary visual area, right secondary visual cortex, and right STG (see also Figure S4 in the
online supplement). The classifier based on these four core regions achieved an accuracy of 60.40% (95% CI=52.04, 68.21), with a sensitivity of 53.33% (95% CI=40.10, 66.14), a specificity of 65.17% (95% CI=54.26, 74.76), and an area under the curve of 0.611 in the ABIDE-II cohort, which was significantly lower than that for the monkey-derived classifier (p=0.003;
Figure 2C; see also Table S8 in the
online supplement).
Because only the identity information of nine core regions was translated from the monkey model to humans, we questioned whether this particular set of nine core regions would outperform an arbitrary choice (i.e., randomly selecting nine of the whole brain nodes as core regions). We observed that the performance of the monkey-derived classifier was significantly better than chance in the ABIDE-I cohort (p=0.0002) and ABIDE-II cohort (p=0.052) (
Figure 2D). Note that some random selections showed higher accuracy than that for the monkey-derived classifier (
Figure 2D). However, on closer examination, we found that even though a random selection of nine regions outperformed the monkey-derived classifier in one cohort, it always failed to achieve reasonable performance in other cohorts, indicating poor generalizability for the random selection of core regions (see also Figure S5 in the
online supplement).
Application of the Monkey-Derived Classifier to Other Human Disorders
Next, we tested the generalizability of the monkey-derived classifier in the OCD and ADHD data sets. In the OCD cohort, the classifier based on the same set of nine core regions from the monkey cohort achieved an accuracy of 78.36% (95% CI=71.29, 84.13; permutation test, p=0.002 [see also Figure S3 in the
online supplement]), a sensitivity of 73.91% (95% CI=63.53, 82.26), a specificity of 83.54% (95% CI=73.14, 90.61), and an area under the curve of 0.848 (
Figure 2C), which outperformed two other human-derived classifiers (ABIDE-I, p=0.044; ABIDE-II, p<0.001; see also Table S8 in the
online supplement), as well as the randomization classifiers (p=0.047) (
Figure 2D). However, in the ADHD cohort, the monkey-derived classifier performed with an accuracy of 68.80% (95% CI=62.80, 74.24), a sensitivity of 56.25% (95% CI=45.76, 66.23), a specificity of 75.88% (95% CI=68.61, 81.96), and an area under the curve of 0.700, which yielded no significant difference compared with other human-derived classifiers (
Figure 2C; see also Table S8 in the
online supplement). Still, core regions identified in the monkey model showed better generalizability than randomly generated ones in the ASD and OCD cohorts (see also Figure S5 in the
online supplement).
Characteristics of Nodes and Edges in the Monkey-Derived Classifier for ASD and OCD
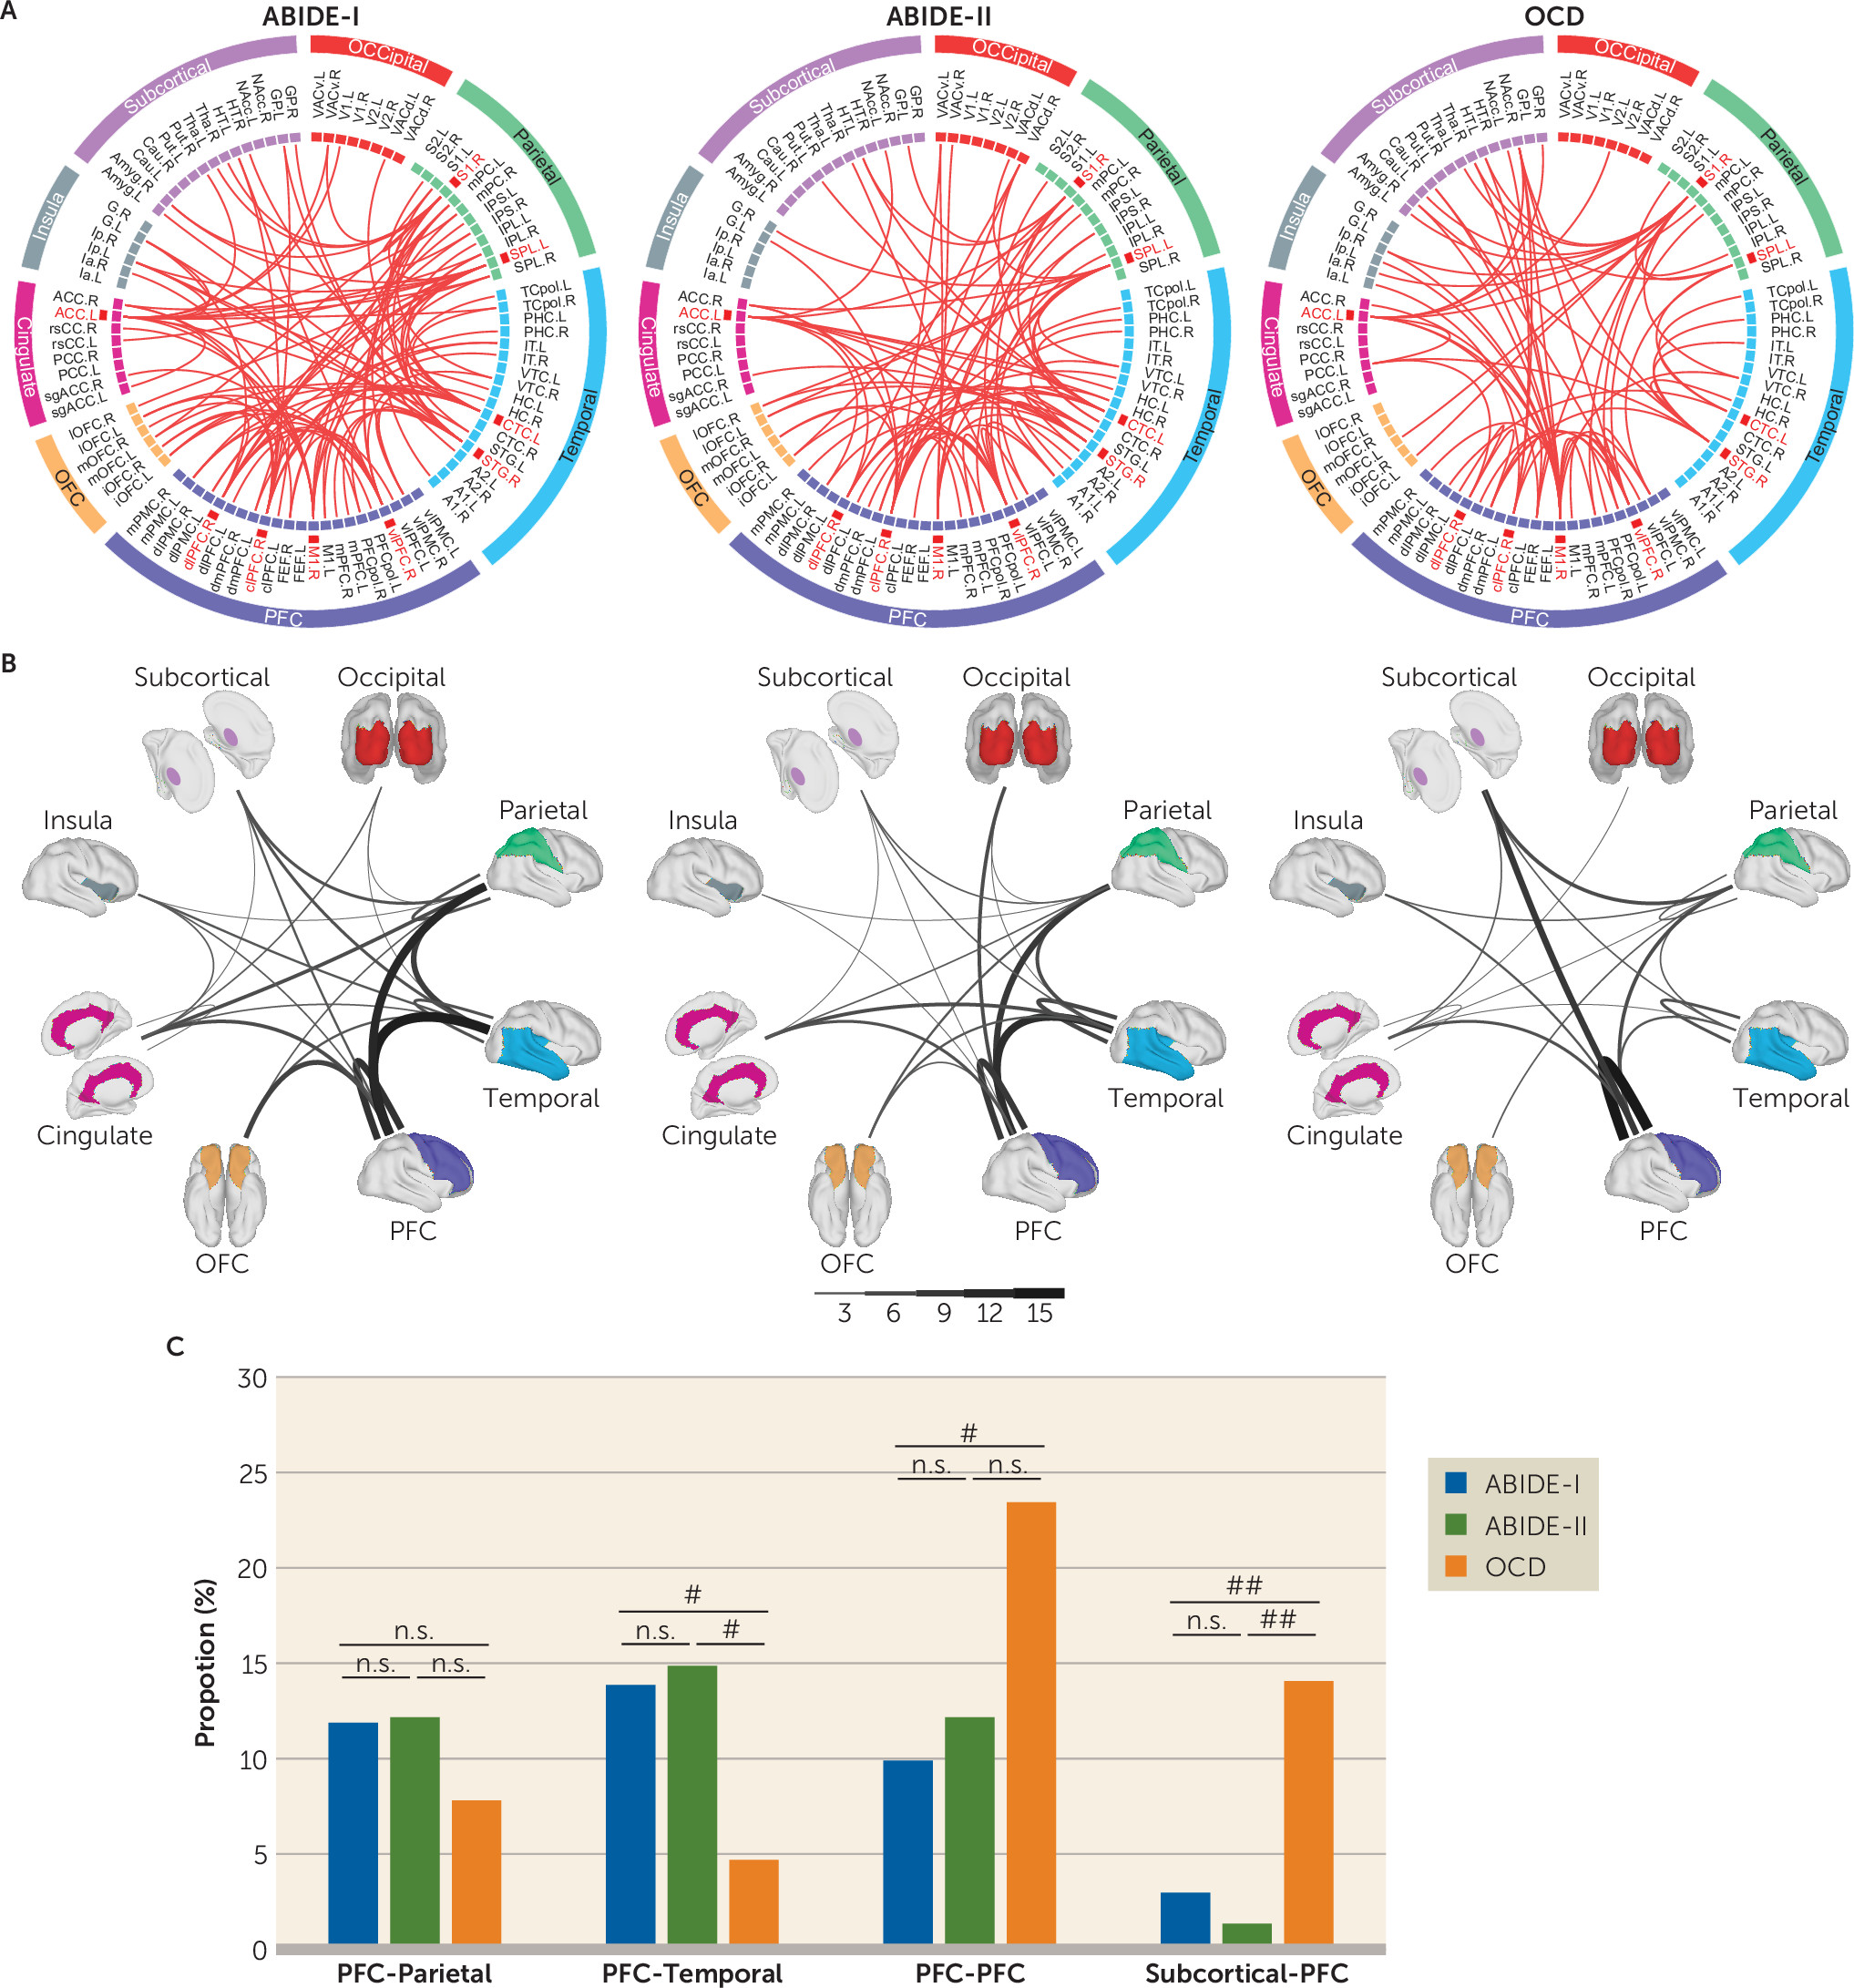
The sparse logistic regression algorithm automatically identified 101, 74, and 64 functional connections from the ABIDE-I, ABIDE-II, and OCD data sets, respectively, for reliable classification of patients and healthy control subjects (
Figure 3A). We observed a biased distribution of intralobe functional connections within the prefrontal lobe in both the ASD and OCD cohorts (ABIDE-I: N=10/101, ABIDE-II: N=9/74, OCD: N=15/64) (
Figure 3B), which exhibited a significant proportional difference between the ABIDE-I and OCD cohorts (p=0.017) but not between the ABIDE-II and OCD cohorts (p=0.065) (Figure 3C). Meanwhile, interlobe functional connections mainly connecting prefrontal lobes with temporal lobes in patients with ASD compared with OCD patients (ABIDE-I: N=14/101, ABIDE-II: N=11/74, OCD: N=3/64) (
Figure 3B) exhibited a significant proportional difference between groups (ABIDE- I compared with OCD, p=0.048; ABIDE-II compared with OCD, p=0.043) (
Figure 3C). In contrast, OCD appeared to have a biased distribution of interlobe functional connections between prefrontal and subcortical areas (ABIDE-I: N=3/101, ABIDE-II: N=1/74, OCD: N=9/64; ABIDE-I compared with OCD, p=0.010; ABIDE-II compared with OCD, p=0.004) (
Figure 3C).
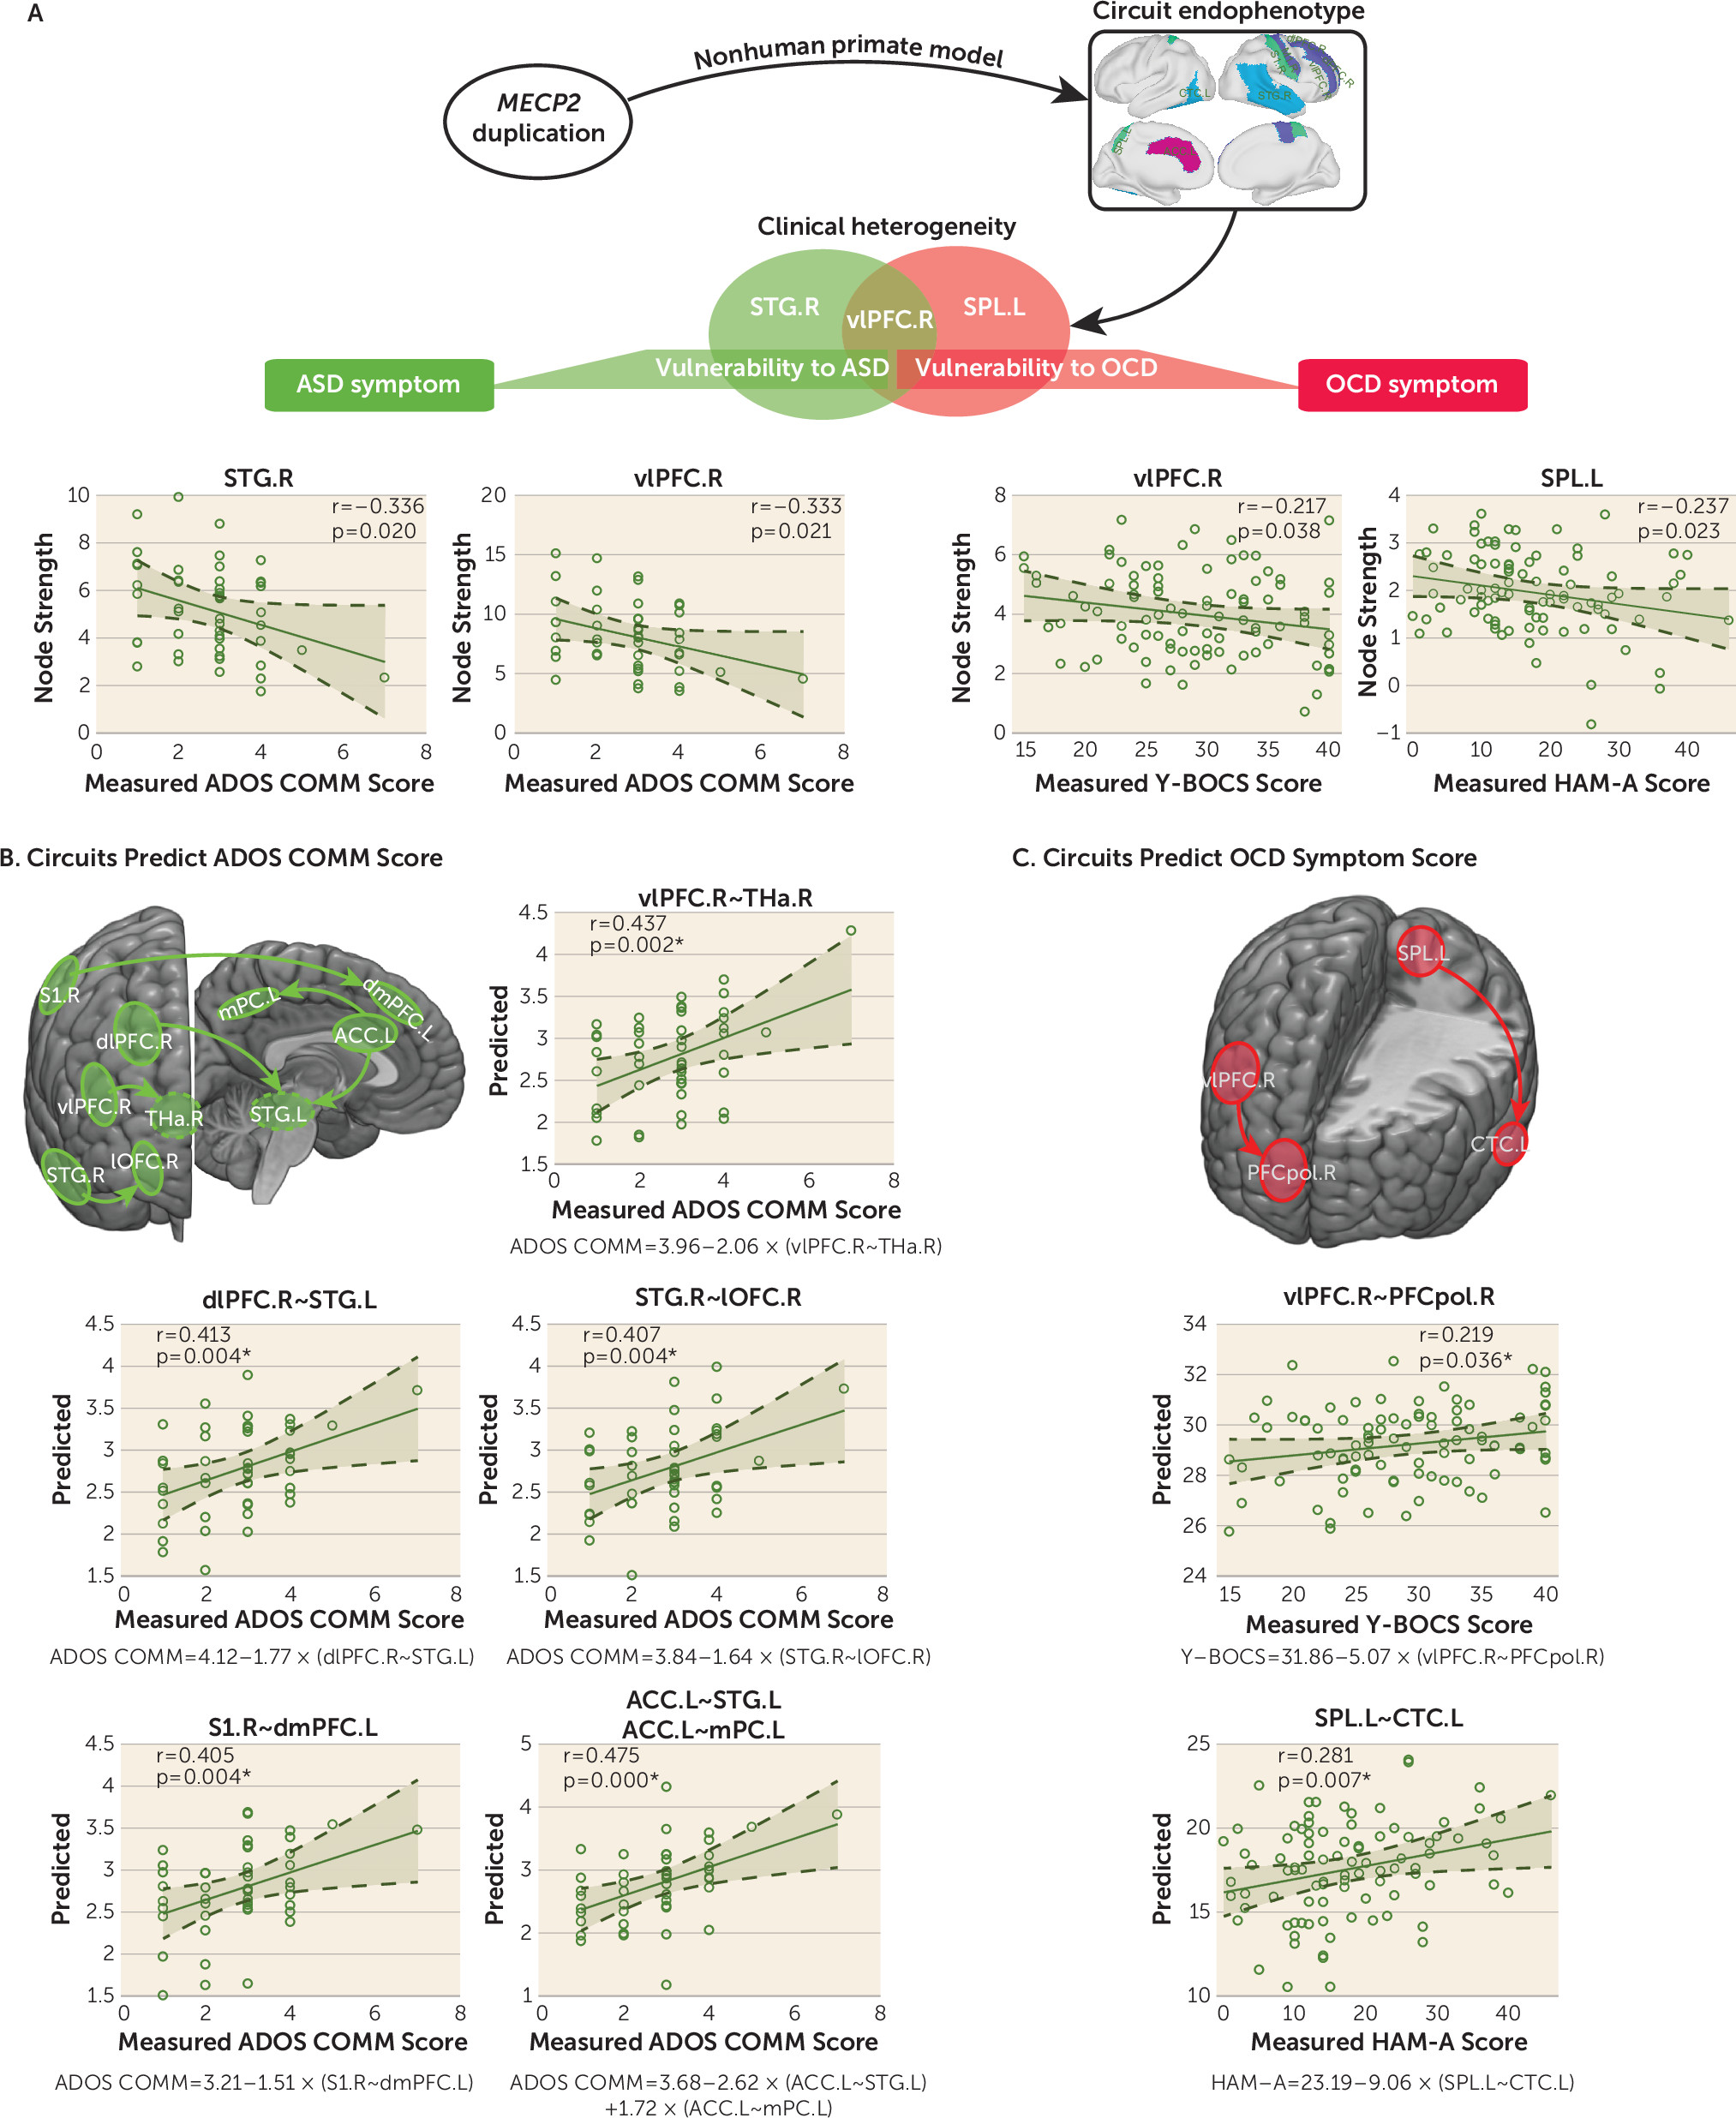
The node strength of the right vlPFC was associated with communication subscores on the Autism Diagnostic Observation Schedule (ADOS) (r=–0.333, p=0.021), administered by research-reliable personnel, in 48 of 60 ASD patients available in the ABIDE-II cohort and was also associated with Yale-Brown Obsessive Compulsive Scale (Y-BOCS) scores (r=–0.217, p=0.038) for OCD patients (
Figure 4A). In addition, the node strength of the left central temporal cortex, right STG, left ACC, right dlPFC, and right primary somatosensory cortex exhibited significant correlations with the ADOS communication subscore for ASD patients (
Figure 4A; see also Table S9 in the
online supplement). By contrast, we found a significant association between the Hamilton Anxiety Rating Scale (HAM-A) scores for OCD patients and the node strength of the left superior parietal cortex (r=–0.237, p=0.023) (
Figure 4A). Note that associations between the node strength of nine core regions and symptom severity in patients with ASD and OCD did not survive correction for multiple comparisons.
We next determined whether functional connections of the classifiers were commonly shared or uniquely linked to symptomatic domains of ASD and OCD. Of all the possible right vlPFC-linked connections, the linear model based on the connection of the right vlPFC and the right thalamus achieved an r correlation of 0.437 (r
2=0.191, p=0.002) between the predicted and measured ADOS communication subscores for patients with ASD in the ABIDE-II group (
Figure 4B; see also Table S10 in the
online supplement). The linear model equation is as follows:
In fact, the ADOS communication subscore was significantly predicted by connections between the right dlPFC and left STG, the right STG and right orbitolateral prefrontal cortex, and the right primary somatosensory cortex and left dorsomedial prefrontal cortex, as well as between the left ACC and both the left medial parietal cortex and left STG (
Figure 4B). By contrast, functional connection between the right vlPFC and right prefrontal polar cortex was predictive of the measured Y-BOCS scores for OCD patients (r=0.219, r
2=0.048, p=0.036;
Figure 4C; see also Table S10 in the
online supplement). The model equation is as follows:
Of all left superior parietal cortex-linked connections, the predicted HAM-A scores based on the functional connection between the left superior parietal cortex and left central temporal cortex were significantly correlated with the actual HAM-A scores of these OCD patients (r=0.281, r
2=0.079, p=0.007;
Figure 4C; see also Table S10 in the
online supplement).
Discussion
We demonstrated that a set of nine core regions, although identified in a relatively small number of biologically homogeneous transgenic monkeys, is sufficiently powerful to set the stage for cross-species mapping and prioritization of features for reducing clinical heterogeneity. This is probably because predisposition of a single genetic manipulation in animal models can be highly susceptible to specific neural circuits and pathways, revealing the extent of a tangible circuit endophenotype and its manifestation in the behavioral domain (
45). These findings speak to the great heuristic value of identifying and investigating biologically homogeneous samples in future clinical studies.
This machine-learning framework enables the search for some straightforward explanations regarding how a neural circuit informs diagnostic classification for different human cohorts, thus allowing us to gain illuminating insights into the mechanisms by which these features were linked to symptom domains of ASD and OCD. This is illustrated by the results showing that the core regions, mostly distributed in frontal and temporal lobes (including the right vlPFC and right STG), were correlated with social communicative deficits (
4,
29,
46). The right vlPFC and left ACC play an important role in the stop circuit (
47,
48), which is heavily implicated in relation to restricted, repetitive behaviors and interests in ASD (
49). Moreover, the functional connection between the left superior parietal cortex and left central temporal cortex predicted the severity of anxiety, reiterating the relationship between anxiety and attention in OCD (
50). Additionally, our findings highlight the crucial role of two core regions—the primary somatosensory cortex and primary motor cortex—indicating their attributes to motor impairment in ASD (
51) and impaired social-communicative skill development (
51,
52), since deficits in the primary somatosensory cortex may affect the ability to master motor skills (
53). Because sensory and motor disturbances have been hypothesized as some of the earliest signs of abnormality in children with ASD (
52), studies characterizing the trajectory of sensorimotor disturbance and the downstream effects on social and communicative interaction in later development would be invaluable to addressing its biological basis and developing early therapeutics in autistic children. Intriguingly, the set of nine core regions identified in transgenic monkeys must be treated as one indiscerptible group to achieve desirable performance compared with randomly generated ones. Although structural abnormalities of some of these nine regions, including gray matter volume and white matter tracts, have been reported in part (
7,
54,
55), our observation suggests an integrated functional role of these nine regions, which calls for further investigation for the underlying neurobiological substrates.
From a circuit perspective, these core regions may simultaneously function as critical hubs for forming differential patterns of functional coupling with the rest of the brain, and which underlie distinct clinical symptom profiles in a variety of diseases. ASD-specific features exhibit apparently marked distribution of fronto-temporal and fronto-parietal connections, prominently involved in cognitive control and social communication (
56). By contrast, dysconnectivity in OCD shows a significant bias toward the fronto-subcortical pathways, largely involved in response inhibition and cognitive flexibility (
4,
47). Additionally, dissection of two distinct vlPFC-centered circuits from the monkey-derived classifier has revealed dual neuropathology-dependent roles for the vlPFC (the social communication of ASD and the compulsivity of OCD), thus emphasizing both unitary and diverse features contributing to the overlap of pathophysiological circuits between these disorders (
8,
47).
This is, to our knowledge, the first study to propose this cross-species machine-learning method for defining circuit endophenotypes across multiple psychiatric disorders, and therefore caution is warranted. Replication to validate the present predictive algorithm with data from other populations and settings will be critical to extend the current use of genetically engineered animal models to broader human application scenarios, which also represents an important criterion for validating a primate genetic model. Considering the complex genetic architecture of ASD and related disorders, further work is essential to fully assess the predictive validity of nonhuman primate models based on single gene manipulation.
Conclusions
In this possibly unique study, we explored the homologous nature of primate brain connectomes, showing that specific brain regions or circuits derived from genetically edited animal models may serve as a basis for defining a biologically defined circuit endophenotype shared between ASD and OCD. Such a circuit endophenotype associates genetics with distinct symptomatic domains across multiple current categorical diagnoses, which may represent an alternative route to deconstructing inherent heterogeneity and complex comorbidity. In addition, this translational framework can serve as an innovative general road map for a wide range of genetic animal models that bridge gaps between diagnostic categories of complex brain diseases and genetic and circuit mechanisms.
Acknowledgments
The authors thank Hu Zhang, Zhiwei Wang, Jinqiang Peng, and Wenwen Yu for assistance with monkey data acquisition, Zhiwei Wang and Xiaoyu Chen for assistance with data preprocessing, and Drs. John Gore, Ravi Menon, Valerie Voon, and Tieniu Tan for editorial assistance.
