Electroconvulsive therapy (ECT) is an effective treatment for major depressive episodes, with remission rates of 60%–75% in modern clinical trials (
1,
2). Most patients respond to ECT in clinical practice and pragmatic trials, but remission rates are lower (30%–50%) (
3–
5). Identifying biomarkers associated with improvement after ECT may facilitate the clinical decision to prescribe ECT.
It has long been thought that ECT is most effective for patients with a severe, episodic, heritable, and possibly “biological” type of depression (
6,
7), but the evidence is limited. In a meta-analysis of 34 studies, symptom severity predicted quantitative response but was negatively associated with qualitative remission (
8). As for other severity measures, psychotic features predict response and remission, but results for melancholic features have been inconclusive, partly because of definitional variation (
2,
8). Notably, ECT is similarly effective in unipolar and bipolar depression (
9,
10). Bipolar disorder has a higher estimated heritability than major depressive disorder (
11), but we recently showed (
12) that the single-nucleotide polymorphism (SNP)–based heritability of ECT-treated depression is considerably higher (29%–34%) than that of mild to moderate depression (6.5%–8.0%), suggesting that more heritable “biological” depression is more likely to be treated with ECT.
Polygenic risk scores (PRSs) are quantitative measures of the polygenic liability for complex traits, calculated from the summary statistics of genome-wide association studies (GWASs) (
13). Although PRSs are not yet sufficiently predictive to inform clinical decisions, polygenic liabilities for psychiatric disorders have been associated with response to specific therapeutics (
14–
18). A recent study of 266 patients experiencing major depressive episodes found that greater PRS for schizophrenia was associated with greater improvement after ECT, even among patients without clinical psychotic features (
19). The notion that ECT works best in more heritable forms of major depressive episode also suggests that improvement after ECT might be associated with greater polygenic liability for major depressive disorder and bipolar disorder, the two disorders for which ECT is recommended as a treatment for a severe major depressive episode (
20).
Our aim in the present study was to investigate whether therapeutic response following ECT for a major depressive episode is associated with PRSs for major depressive disorder, bipolar disorder, and schizophrenia. To this end, we analyzed a large cohort of Swedish patients who had received ECT for a major depressive episode.
Methods
Study Population
The study population was derived from the Predictors for ECT (PREFECT) study, conducted in Sweden (
12). Recruitment occurred between 2013 and 2017. Study participants had received at least one acute ECT series that was registered in the Swedish National Quality Register for ECT (Q-ECT) (
http://ect.registercentrum.se). Q-ECT was launched nationally in Sweden in 2011, although some hospitals started registration in 2008. As of 2014, Q-ECT covered 89% of all ECT series in Sweden (
20). Local hospital staff routinely enter data on each treatment series into the register via a web-based platform.
The study sample has been described previously (
12,
21). Briefly, a letter of invitation was sent to patients ≥18 years old registered in Q-ECT. Those who volunteered to participate completed a telephone interview and donated blood that was sent via overnight mail to Karolinska Institutet Biobank. Additional participants were prospectively recruited at eight Swedish hospitals prior to receiving ECT for a major depressive episode. Blood samples were stored at −20°C pending shipment to Karolinska Institutet Biobank for DNA extraction and long-term storage.
A total of 2,880 participants provided DNA and had received at least one acute ECT treatment series for a major depressive episode. After exclusion of participants whose genotyping failed quality control (N=40), genetic ancestral outliers (N=138), and those with no registered primary outcome in Q-ECT (N=382), we categorized the remaining 2,320 eligible participants into two groups, as previously described (
12): The broadly defined group included participants with a major depressive episode occurring in the context of any one of the following: 1) a unipolar depressive disorder (ICD-10 codes F32–F33, F41.2, F53.0), 2) bipolar disorder (code F31), 3) another severe mood disorder with a pretreatment score ≥20 on the self-rated Montgomery-Åsberg Depression Rating Scale (MADRS-S) (mixed anxiety and depressive disorder, code F41.2; schizoaffective disorder, code F25.9; or mood disorder not otherwise specified, code F34.9), or 4) major depressive episode as indicated by free text, or by a pretreatment MADRS-S score ≥20 if the specific indication for treatment was missing. The narrowly defined group consisted of the subset of participants who received ECT for a major depressive episode in the context of a unipolar depressive episode only. Psychotic features were considered present if the indication for ECT was coded with any of ICD-10 codes F323, F333, F315, and F259, or if the indication in free text implied delusions and/or hallucinations.
All participants provided written informed consent. The study was approved by the regional ethical review board in Stockholm (approval nos. 2012/1969-31/1 and 2020-10151).
Outcome Measures
Participants could have several registered treatment series in Q-ECT (
Table 1). Here, outcome data were captured from the first or only ECT treatment series. Our primary outcome measure was the Clinical Global Impressions improvement (CGI-I) score (
22), rated immediately after the ECT series. We chose the CGI-I because it had the lowest proportion of missing information. CGI-I scores were available for the first registered treatment series of 92.8% of participants (N=2,154). CGI-I score, which ranges from 1 (very much improved) to 7 (very much worse), was treated as an ordinal variable. Secondary outcome measures were response and remission according to the MADRS-S (
23). Both pre- and posttreatment MADRS-S scores were available for 52.0% of the sample (N=1,207), of which 79.2% (N=956) provided MADRS-S ratings at their first registered treatment series. The MADRS-S includes nine items rated from 0 to 6 (maximum score=54), which correspond to the items in the observer-rated MADRS except “apparent sadness.” Response was defined as a reduction ≥50% in MADRS-S score from pre- to posttreatment assessment. Remission was defined as a posttreatment MADRS-S score ≤10.
A subset of 1,052 participants had both MADRS-S and CGI-I data available from the same treatment series. There was a moderate correlation between CGI-I and MADRS-S response (Spearman’s ρ=0.48, p<0.001) and MADRS-S remission (Spearman’s ρ=0.42, p<0.001).
ECT Procedure
ECT was administered using bidirectional, constant-current, brief-pulse devices from Mecta (Mecta Corp., Lake Oswego, Ore.) or Thymatron (Somatics, Inc., Lake Buff, Ill.). Propofol or thiopental was used for anesthesia. Suxamethonium was used for muscle relaxation. Seizure time was registered with electroencephalography. From Q-ECT, we retrieved data on electrode placement (bilateral or right unilateral at first or last ECT), and charge (mC) and pulse width (categorized into 0.25–0.49 ms, 0.5 ms, and 0.51–1.20 ms) used at the first session of each treatment series. All participating clinics administered ECT three times per week (Monday, Wednesday, and Friday).
Genotype Quality Control and Imputation
Genotype quality control and imputation have been described in detail elsewhere (
12). Briefly, DNA was extracted from peripheral blood, and samples were genotyped on the Illumina GSA-MD SNP array (version GSAMD-24v1-0_20011747_A1) at Life & Brain GmbH (Bonn, Germany). Standard quality control was applied using the PGC RICOPILI pipeline (
24). All potential samples were included in quality control, but the final association analysis was performed on the phenotyped subsets outlined above that passed quality control. Samples were excluded (N=40) for genotype missingness >0.02 (after first filtering SNPs with call rate <0.95), genotypic sex ambiguous or not matching phenotypic data, or autosomal heterozygosity |F|>0.2. SNPs were excluded for call rate <0.99, difference in missingness between cases and controls >0.005, minor allele frequency <0.01, or deviating from Hardy-Weinberg equilibrium in cases or controls (p<10
–6). Ancestry outliers were identified by projecting study samples on principal components with respect to 1000 Genomes Project data (phase 3 v5) (
25). Individuals further than three standard deviations from the European reference population mean for principal components 1 or 2 were excluded (N=138), and then the principal components were regenerated for use in the study analyses as covariates to capture residual confounding by genetic ancestry. Potentially related individuals were identified, and one from each pair was flagged for exclusion (estimated identity-by-descent sharing >0.2). Samples that passed quality control were imputed using the Haplotype Reference Consortium (HRC) r1.1 reference panel on the Sanger Imputation Service using Eagle2 and positional Burrows-Wheeler transform (PBWF) for phasing and imputation (
26). The genome build was hg19.
Polygenic Risk Score Generation
PRSs were calculated for major depression and bipolar disorder using discovery GWAS summary statistics from the Psychiatric Genomics Consortium (
https://www.med.unc.edu/pgc/download-results/) based on large GWASs for each phenotype (major depressive disorder: “mdd2019edinborough” [
27]; bipolar disorder: “bip2019” [
28]; schizophrenia: “scz2022” [
29]). Although the PREFECT sample has not been included in any previous GWAS, we nevertheless removed all Swedish samples from the GWAS summary statistics to reduce the possibility of spurious associations.
PRSs were generated for the PREFECT samples as the sum of the risk allele scores, weighted by their effect size in the discovery samples. We performed linkage disequilibrium clumping (R
2 <0.1 in 1-Mb windows) on any overlapping SNPs with the 1,000 Genomes Project European samples for the reference (phase 3 v5) (
25). PRSs were calculated using PLINK, version 1.9 (
30). PRSs were coded as risk increasing and standardized to a mean of 0 and a standard deviation of 1 for interpretability. To reduce the number of comparisons, we used the PRSs calculated at a p threshold of ≤0.05 as exposures in our main analyses, in alignment with previous research (
17). Table S1 in the
online supplement contains the details on the number of SNPs used in the calculation of each PRS.
Statistical Analysis
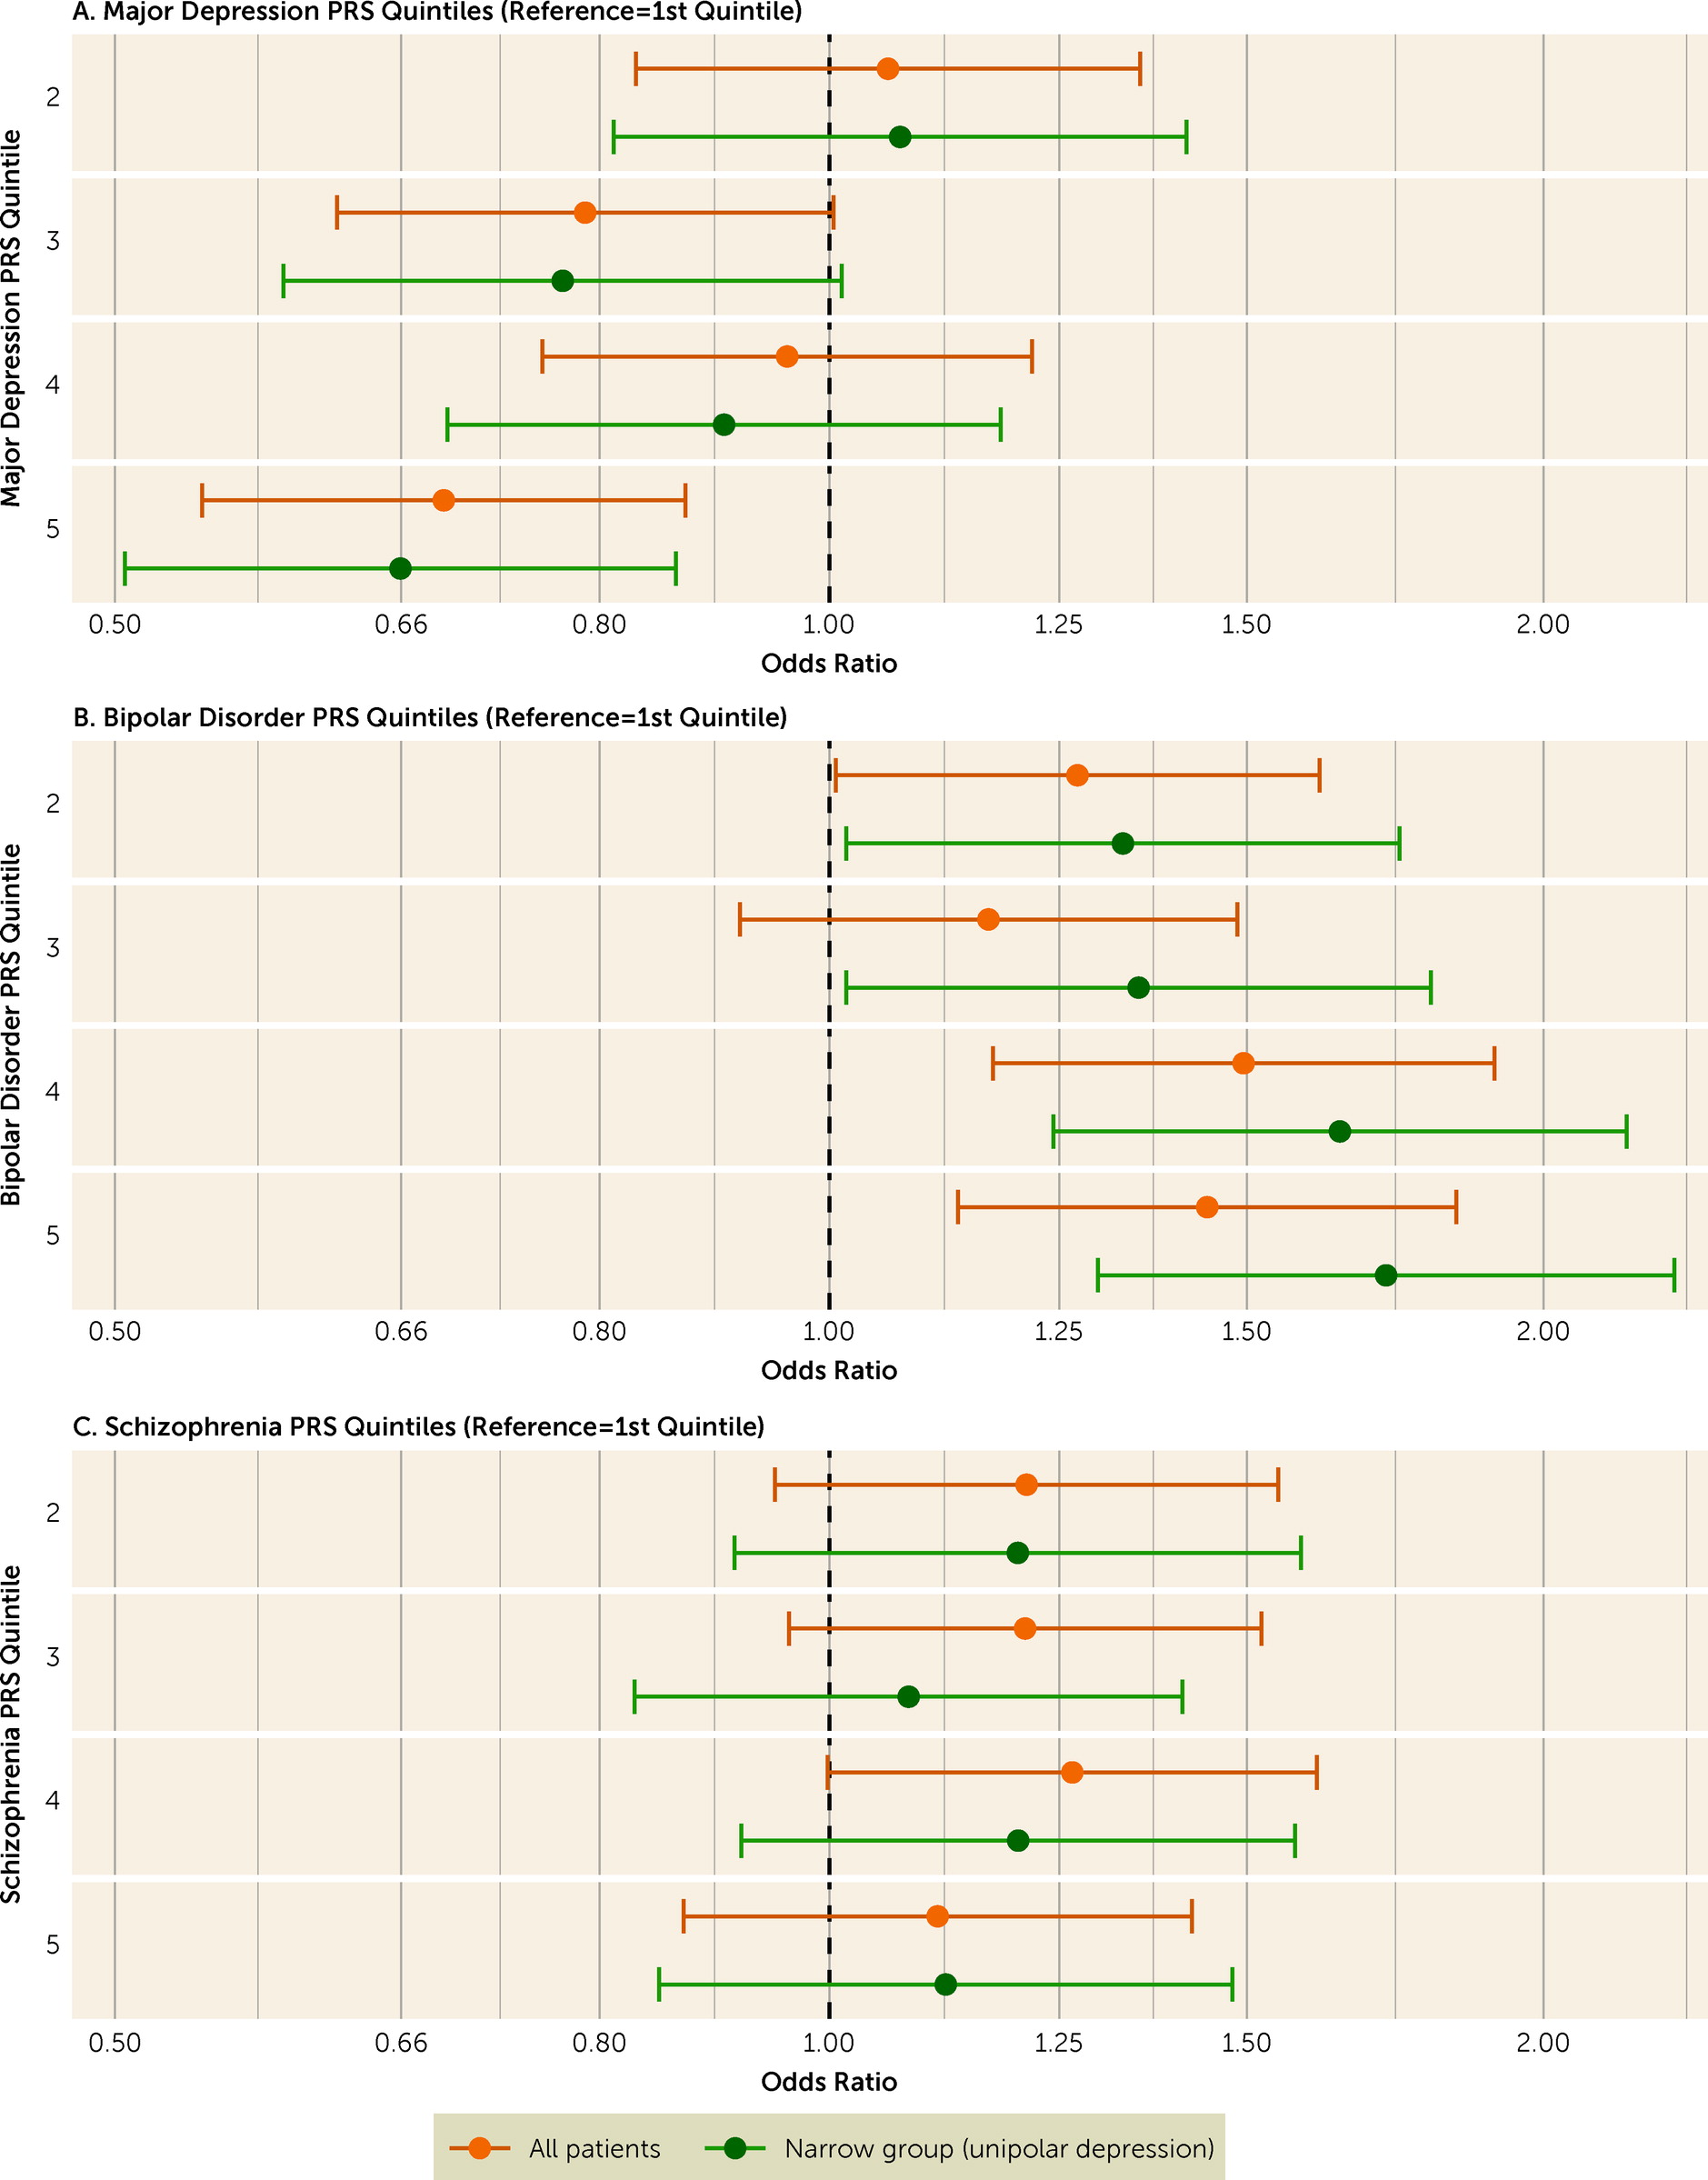
We present the descriptive characteristics of the sample using frequency (and percent) or median (and interquartile range). Our primary analyses investigated the associations of PRSs for major depression, bipolar disorder, and schizophrenia with CGI-I score. We used a multivariable proportional odds ordinal logistic regression model adjusting for the first five genetic ancestry principal components. To facilitate interpretation, we reversed the CGI-I values such that odds ratios >1 represent improvement. We also examined the association between quintiles of each PRS and CGI-I, using the lowest quintile as the reference, in multivariable ordinal logistic regressions, given that higher PRS values may carry greater risks. We conducted approximate likelihood-ratio tests to examine violation of the proportional odds assumption. For the secondary analyses of the association between each PRS and MADRS-S remission and response (defined above), we used multivariable logistic regression analyses adjusted for MADRS-S prior to ECT, and the first five genetic ancestry principal components. We present all results as odds ratios with 95% confidence intervals. For all analyses, we calculated the proportion of variance explained by each PRS as the difference between the Nagelkerke pseudo R2 of the full multivariable model and that of a model excluding the PRS.
We performed four sensitivity analyses of the primary outcome (CGI-I). First, we repeated the analyses for the subset of participants with a narrowly defined major depressive episode. Second, we repeated the analyses using PRS calculated on the basis of alternative p-value inclusion thresholds (≤5E−8, 1E−5, 1E−3, 0.01, 0.1, 0.5, 1.0). Finally, we repeated the analysis separately for participants with unilateral electrode placement only (vs. bilateral placement) at first or last ECT, and for participants with versus without psychotic features.
We applied a two-tailed Bonferroni-adjusted significance level (p=0.05/3=0.017) in our primary analyses involving CGI-I scores because of the analyses of three PRSs. In our secondary and sensitivity analyses, which were exploratory, we applied the uncorrected statistical significance level (p<0.05). We used SPSS, version 26 (IBM Corp., Armonk, N.Y.) for data management, and STATA, version 16 (StataCorp, College Station, Tex.) for statistical analyses. Figures were produced in R, version 4.0.5 (R Foundation for Statistical Computing, Vienna) using
ggplot2, version 3.3.3 (
31).
Discussion
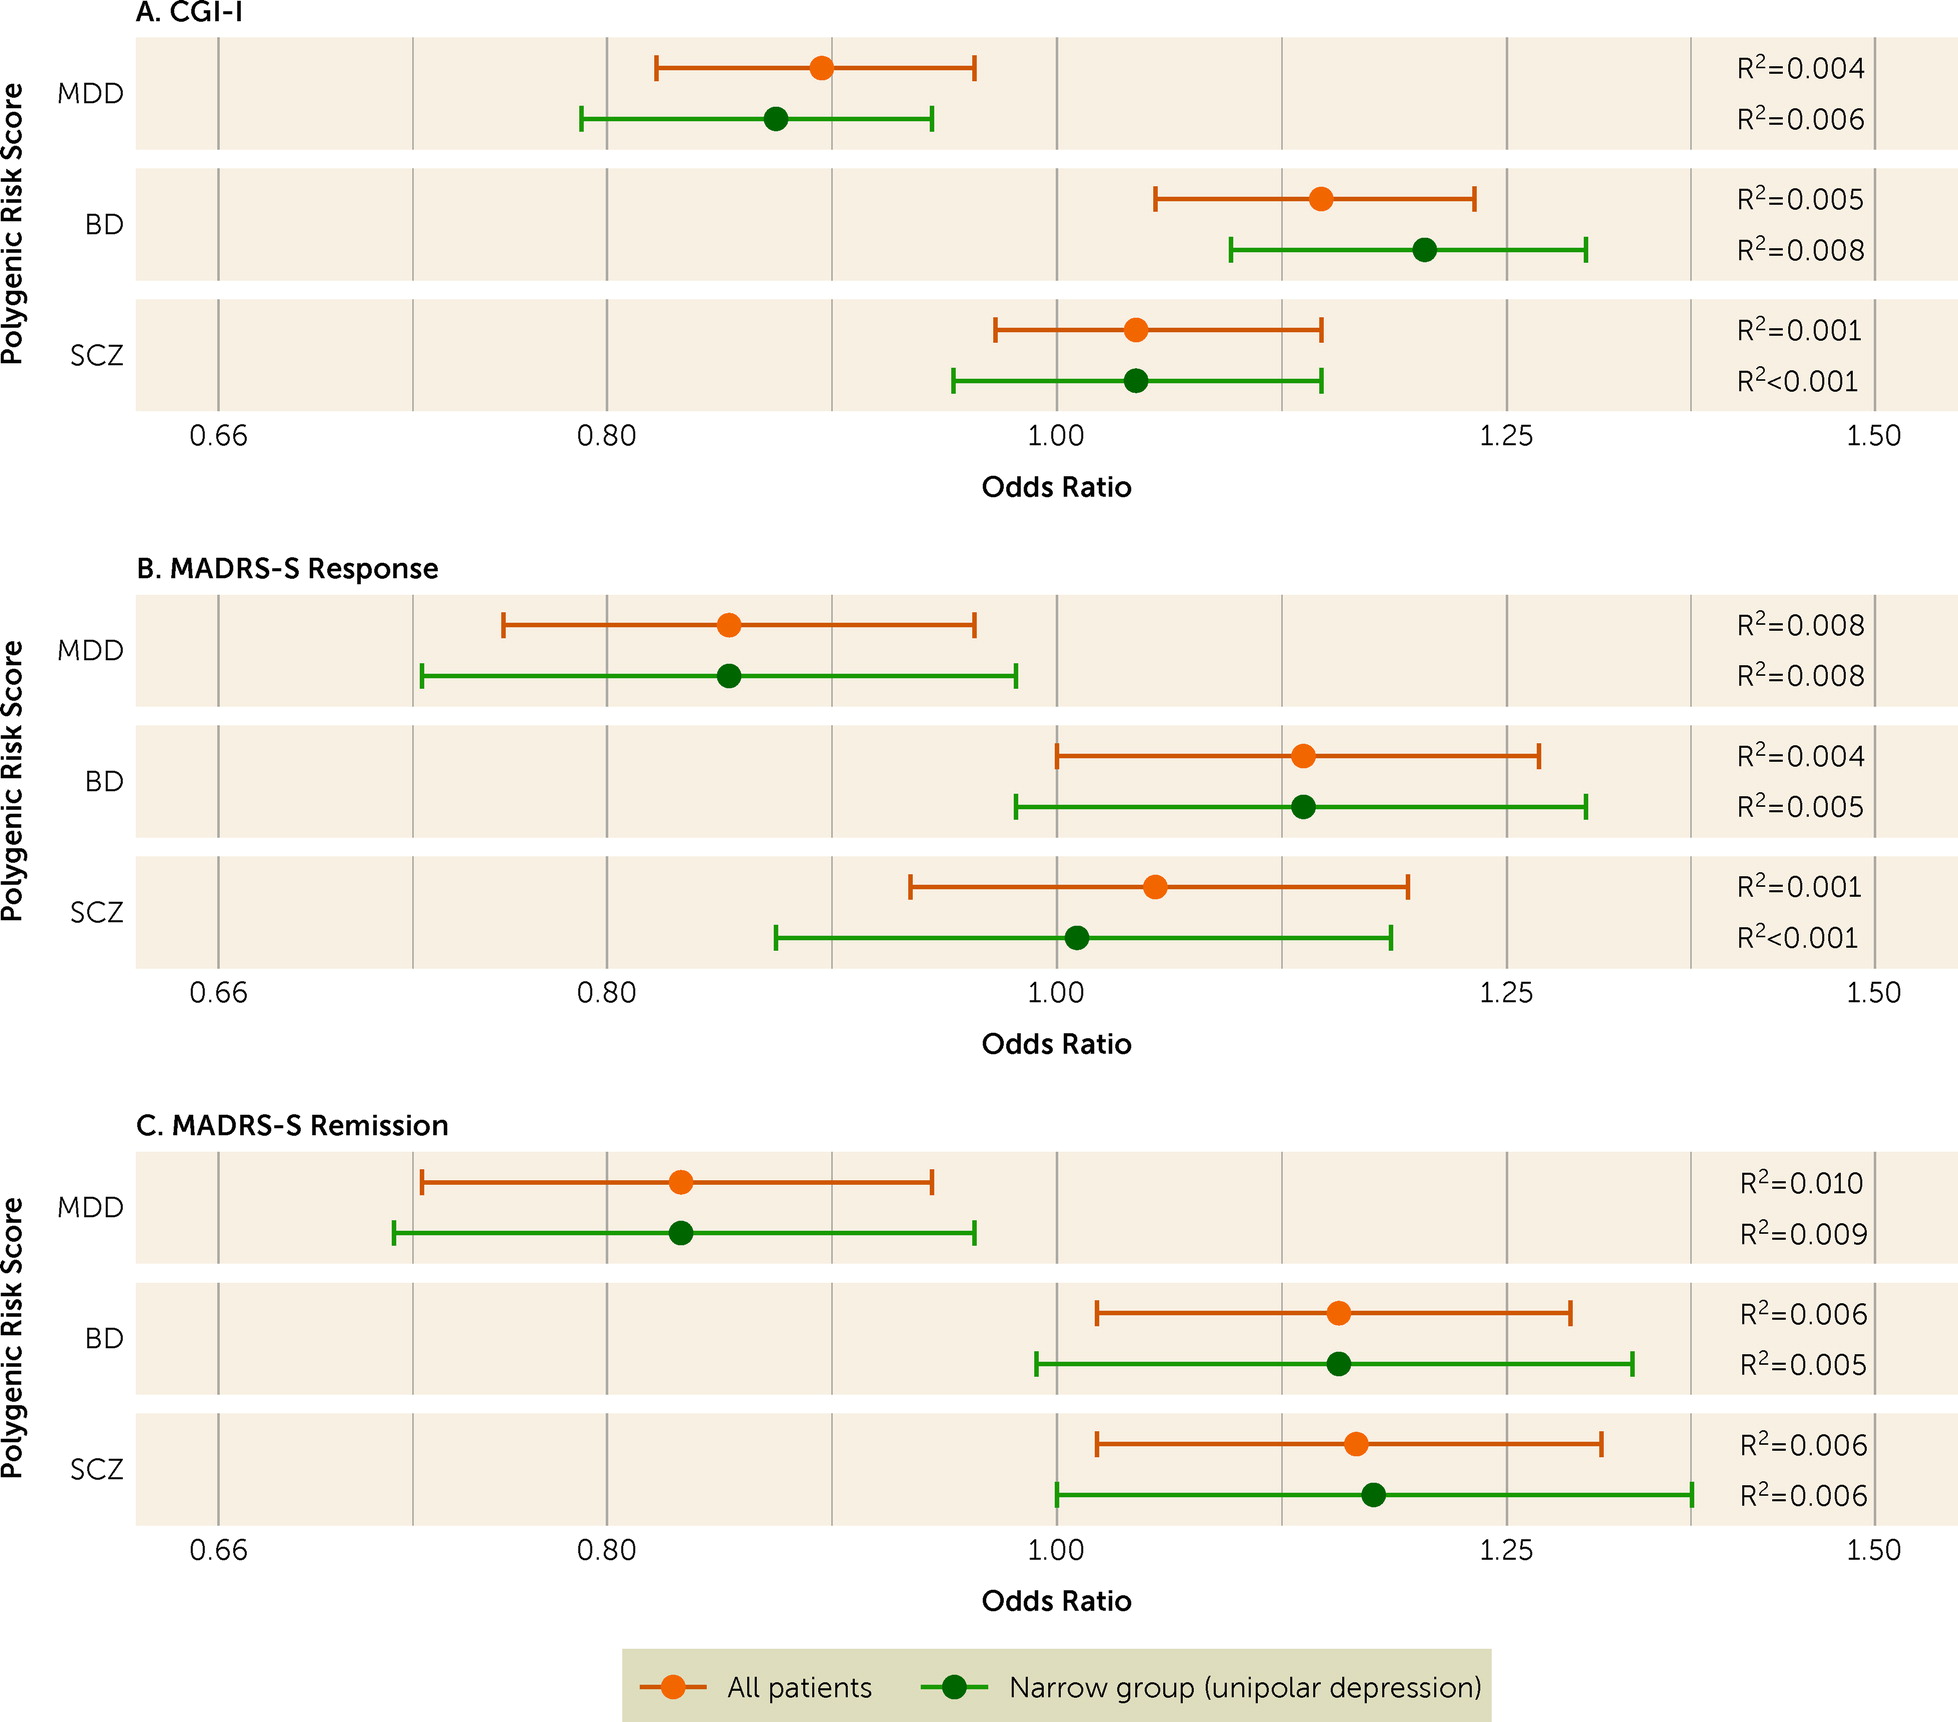
We investigated whether improvement after ECT was associated with polygenic liability for major depression, bipolar disorder, and schizophrenia in a cohort of 2,320 patients with a major depressive episode. We found that higher polygenic liability for major depression was associated with lower chance of improvement after ECT, whereas higher polygenic liability for bipolar disorder was associated with higher chance of improvement. In our primary analysis, we could not replicate the relatively strong association between increasing schizophrenia PRS and more improvement reported from a previous smaller study (
19), although we did find that schizophrenia PRS was positively associated with remission according to MADRS-S score. In our study, the proportions of participants who received bilateral ECT and who had psychotic features were considerably smaller than in the previous study. But our sensitivity analysis did not suggest that associations between PRS and improvement differed by these factors.
There is a small but growing literature on PRSs and therapeutics for mood disorders. Major depression PRS and schizophrenia PRS have been associated with lower likelihood of lithium response in patients with bipolar disorder (
14,
15), while bipolar disorder PRS had no such association (
18). No robust associations have been found with PRSs for psychiatric disorders and response to antidepressants (
33–
35); nominal associations of major depression PRS with less improvement on citalopram/escitalopram (
34) or esketamine in treatment-resistant major depression (
35) did not survive correction for multiple testing. Major depression PRS was not associated with outcome after cognitive-behavioral therapy for major depressive episode (
17).
It is noteworthy that higher major depression PRS has been associated with poorer response to antidepressant treatments rather than the opposite. Higher major depression PRS has been related to more severe major depression (
36), which in turn is believed to predict response to ECT (
6,
8). But the measures of depression severity that have been associated with higher major depression PRS—early age at onset, higher symptom count, and a chronic/unremitting course of illness (
36)—do not necessarily correspond to severity as measured by the sum score on symptom scales, which has been used to index severity as a predictor of response to ECT (
8). In fact, younger age at treatment and longer duration of current depressive episode (i.e., chronic illness) have previously been associated with poorer response to ECT (
8,
10).
In contradistinction to major depression PRS, we found that higher polygenic liability for bipolar disorder was associated with better response to ECT. The discrepancy between major depression PRS and bipolar disorder PRS is noteworthy, as the efficacy of ECT does not differ between bipolar and unipolar depression (
9,
10). Importantly, the association was similar or more pronounced among the subset of patients with unipolar depression.
We have previously reported higher bipolar disorder PRS in patients with a severe major depressive episode treated with ECT than in patients with more moderate depression treated with Internet-based cognitive-behavioral therapy (
12). Higher bipolar disorder PRS might thus reflect a genetic liability to develop not only bipolar disorder but also more severe depression. Our findings indicate that high polygenic liability for bipolar disorder may also be associated with response to biological treatments, including ECT. Further research is needed to confirm this.
The effect sizes of PRSs in this study were small, which echoes other genetic studies of response to psychiatric treatments (
14–
16). Although effect sizes may increase with larger genomic studies (
37), the power of PRS to explain treatment effects may be limited in cohorts with similar phenotypes and relatively small variations in treatment outcome. Also, the genetic correlation between major depression and bipolar disorder seems to be due to pleiotropic genetic variants, meaning that genetic risk for bipolar disorder cannot be used to delineate major depression subgroups (
38). Thus, PRSs of bipolar disorder and major depression may not be suitable for identification of a subgroup of “super responders” to ECT. The genetics of ECT response may also overlap with the genetics of phenotypes associated with poor ECT response, such as personality disorders and substance use (
5). Indeed, the genetic architecture of categorically defined psychiatric disorders may differ from that of treatment response. These possibilities should be addressed by further studies, and ultimately by a GWAS of response to ECT, which is an objective of the International Consortium on the Genetics of ECT and Severe Depressive Disorder (GenECT-IC), aiming to recruit 30,000 participants (
39).
The strengths of this study include the large and well-characterized sample with data on treatment outcomes after ECT. Further, the direction and magnitude of effects were consistent between the primary (CGI-I) and secondary (MADRS-S) outcome measures. Sensitivity analyses provided further convergent evidence. Limitations of the study include, first, that data were collected in routine clinical practice, limiting quality supervision. This probably adds noise compared with controlled studies. Second, the MADRS-S is self-rated while the CGI-I is observer-rated, which may explain why CGI-I and MADRS-S were only moderately correlated. Moreover, MADRS-S ratings were missing for more than half of the participants, primarily prior to ECT. This is likely explained by poor mental states that precluded the completing of a self-rated instrument, and it might bias the results by excluding severely ill patients, who are expected to respond well to treatment. However, this bias should not affect the results regarding the observer-rated CGI-I. Third, we had limited data on factors known to predict the outcome of ECT, such as duration of the current episode and nonresponse to antidepressant medication (
10). It remains to be examined to what extent the association between, for example, PRS for major depression and treatment outcome is independent of these variables. Last, given that our sample size was <4,000, the study was powered neither for a GWAS of ECT outcomes nor for computing heritability estimates for the studied outcomes (
40).
In summary, we found that response to ECT is associated with lower genetic burden for major depressive disorder and higher genetic burden for bipolar disorder. Yet, the predictive power of the studied polygenic risk scores to predict outcome after ECT was small. It remains to be studied whether polygenic risk scores alongside clinical or demographic factors might add predictive value beyond known clinical predictors of response to ECT.


