Open access
RESEARCH ARTICLES
Published Online: 9 October 2020

Clinical Features of Psychotic Disorders: Comparing Categorical and Dimensional Models

Publication: Psychiatric Research and Clinical Practice

Abstract

Objective

Despite research demonstrating the value of dimensional approaches, standard systems for classifying psychotic disorders rely primarily on categorization of patients into distinct diagnoses. We present the first study comparing analyses of dimensional features, categories, and standard diagnoses, all derived from the same sample.

Methods

Using symptom ratings from 934 patients hospitalized for psychosis, we examined dimensional models, fit using factor analysis, categorical models, fit to factor‐based scores from the dimensional model, and their correspondence with DSM‐defined diagnoses. We compared the ability of each model to discriminate patients' assignment to medication regimen as a clinical validator.

Results

Dimensional modeling identified four factors (manic, depressive, negative symptoms, and positive symptoms), which corresponded to factors in prior studies and appeared robust to statistical approach. Scores based on these factors overlapped substantially among DSM diagnoses. Patients assigned to clusters had less overlap in factor‐based scores. However, categorical models were sensitive to statistical approach. The addition of DSM diagnoses, but not cluster assignments, improved the fits of models with dimensional scores alone as the clinical predictors for some medication classes.

Conclusions

The results highlight the variability of symptom presentation within DSM‐defined diagnostic categories, the utility of symptom dimensions or factors, and a potential lack of robustness of data‐driven categorical approaches. Findings support initiatives to develop updated diagnostic systems that complement categorical classification of psychotic illness with factors representing dimensional ratings of symptoms.

HIGHLIGHTS

This study compared results from dimensional and categorical models fit to symptom ratings from a large sample of patients hospitalized for psychosis.
Dimensional information, which was not fully captured by data‐derived or DSM‐defined categorical assignments, best predicted medication classes at discharge overall.
These findings support the incorporation of dimensional ratings into categorical classification systems for psychotic illness.
It is becoming increasingly clear that we cannot distinguish satisfactorily between these two illnesses, and this brings home the suspicion that our formulation of the problem may be incorrect. Email Kraepelin, 1920 (1)
Defining the key features of patients with psychotic disorders is an ongoing enterprise. Categorical systems, such as the Diagnostic and Statistical Manual of Mental Disorders (DSM) and the International Classification of Deseases (ICD), are the standards. However, many patients with psychotic disorders do not fit well in their categories (2, 3, 4). That observation is not new. The originators of the systems on which current diagnoses are based concluded that categories were not a good model for the range of cases seen (1). Periodic updates to the categories have not greatly increased the fit of classifications to the illnesses observed (3).
Any model of conditions as complexly expressed and determined as the psychoses will necessarily be oversimplified. Still, there may be unused features that would add value in evaluating patients, studying mechanisms of illness, and developing treatments. Hybrid models with both categorical and dimensional features have been proposed (5, 6, 7).
In refining the models, categories are in place. Dimensions remain exploratory. Some dimensional measures appear in DSM5 (8), but are relegated to a section on “Emerging Measures and Models,” separate from the main section on diagnoses (2, 8). In ICD11, dimensions are also proposed (9), but as in the DSM, categories remain central.
Outside DSM and ICD, alternative dimensional models have been suggested (e.g., HiTOP, see Krueger et al. 2018 (10)). In research, neurobiological domains (e.g., RDoC (11)) have been explored as possibly more strongly associated with underlying mechanisms than diagnostic categories. Various clusters of symptoms exist both as freestanding and co‐morbid conditions (12), and these clusters may be key structural elements of illness. Similarly, some symptoms, such as paranoia or suicidality, appear across disorders and are worth exploring as individual items, separate from diagnosis (13).
Ultimately, progress in applying dimensional features depends on finding the right dimensions (4, 9). They must accurately characterize illnesses, contribute information beyond categorical diagnoses, and be practical to implement. Previously, we reviewed the evidence on categorical and dimensional classifications of psychoses (4). Past studies were relatively consistent in observing similar dimensional features in patients with psychoses. Among 41 studies, four or five factors were common, often including positive, negative, and affective symptoms. Only two studies, of modest size, compared the relative fit of categories and dimensions, both derived from their own sample (14, 15). No studies compared categories and dimensions derived from the same sample to one another, to standard diagnoses and to any external validator. The current study does and its results provide guidance on modifications of diagnostic systems and the design of future investigations on the architecture of psychoses.

Methods

Study Participants

Subjects (N=934) were from McLean Hospital inpatient units specializing in psychotic disorders (16). Information on medications was collected from discharge records. The Partners HealthCare Institutional Review Board approved the study. All subjects provided informed consent.

Clinical Assessments

Clinical interviews were performed by trained research staff who completed regular exercises to maintain consistency and reliability. Interviews included the Young Mania Rating Scale (YMRS) (17), Montgomery‐Asberg Depression Rating Scale (MADRS) (18), and the Positive and Negative Symptom Scale (PANSS) (19). DSM‐IV diagnoses were based on the Structured Clinical Interview for DSM‐IV‐TR (20).

Statistical Analysis

The first stage of analysis explored the dimensional structure of the item ratings under the assumption that the items were indicators of an underlying set of latent continuous variables. Items on the YMRS, MADRS, and PANSS were submitted for exploratory factor analysis using maximum likelihood estimation and oblique geomin rotation. The primary analysis used the ratings as originally coded, treating them as continuous. Sensitivity analyses treated the items as ordinally rated and collapsed categories for items with a skewed rating distribution. Candidate solutions including different numbers of factors were evaluated based on scree plots of the factor eigenvalues, the root mean squared error of approximation (RMSEA), the standardized root mean squared residual value (SRMR), the Bayesian information criterion (BIC), interpretability of the solution, and robustness of the solution to choice of statistical method. After choosing a solution, items with loadings less than 0.40 on all factors and items with loadings greater than 0.40 on more than one factor were omitted. The resulting fit was submitted for confirmatory factor analysis to obtain factor‐based scores. Factor analysis was conducted using MPLUS (version 6.0) statistical software, which accommodates missing item‐level data under the missing‐at‐random assumption (21). To characterize differences in symptom presentation among DSM‐IV diagnoses and variability of symptom presentation within DSM‐IV diagnoses, we plotted the distribution of factor‐based scores by DSM‐IV diagnosis. Malhalanobis distance (22) was used as a summary metric for describing the distance of an individual's set of factor‐based scores from the mean for each diagnosis.
The second stage of analysis explored the categorical structure of the data using the factor‐based scores, agnostic to DSM categories. Multivariate normal mixture modeling, a method closely related to Malhalanobis distance, was used to identify clusters of patients with similar symptom presentations based on their factor scores. Fits of models with more constraints on the variance of scores within clusters were compared to fits of models with fewer constraints using the BIC. Fits of models with different numbers of clusters were compared using the BIC and the bootstrap likelihood ratio test. The approximate correct model probability (CmP) was used to quantify the certainty that our choice of model was correct under the assumption that the correct model was included among our candidate models (23, 24). A sensitivity analysis compared results obtained from multivariate normal mixture modeling to results obtained by categorizing factor‐based scores based on standard deviation units and submitting category indicators to latent‐class analysis (LCA). Fits of LCA models with different numbers of classes were compared using the BIC and the Vuong‐Lo‐Mendell‐Rubin likelihood ratio test. Multivariate normal mixture modeling was conducted using the mclust package (25) for R statistical software (version 3.5.0), and latent‐class models were fit using MPLUS (version 6).
In the third stage of analysis, logistic regression evaluated factor scores, DSM‐IV diagnoses, and cluster membership as predictors of psychotropic medications at discharge. The c‐statistic was used to compare the discrimination of models with alternate clinical predictors. Factor scores were evaluated both with and without categorical predictors in the model to assess if inclusion of both factors and categories improved discrimination over the use of either feature alone. All logistic regression models controlled for age and sex and were fit using SAS software (version 9.3).

Results

DSM‐IV diagnoses of subjects are in Table 1. The sample was 45% female with a mean age of 37 years and was highly educated, reflecting the local population.
TABLE 1. Characteristics of the sample by DSM‐IV diagnosis
 Full sampleBipolar disorderSchizophreniaSchizo‐affective disorderMajor depressive disorderOtherb
n (%)934 (100%)408a (44%)233 (25%)202 (22%)47 (5%)44 (5%)
Female, n (%)420 (45%)202 (50%)74 (32%)98 (49%)26 (55%)20 (45%)
Age, mean (SD)37.2 (12.9)36.7 (13.4)37.8 (12.5)37.8 (12.1)41.2 (12.0)31.8 (12.1)
Educationc, n (%)
No high school graduation66 (7%)12 (3%)33 (14%)19 (9%)1 (2%)1 (2%)
High school graduate/GED136 (15%)49 (12%)45 (19%)34 (17%)4 (9%)4 (9%)
Some college359 (39%)159 (39%)86 (37%)81 (40%)16 (35%)17 (40%)
2‐year college degree52 (6%)33 (8%)8 (3%)6 (3%)4 (9%)1 (2%)
4‐year college degree175 (19%)81 (20%)38 (16%)38 (19%)10 (22%)8 (19%)
Some graduate school53 (6%)27 (7%)9 (4%)11 (5%)3 (7%)3 (7%)
Graduate degree9 (10%)47 (12%)12 (5%)13 (6%)8 (17%)9 (21%)
GED=Tests of General Educational Development diploma.
a
398 bipolar 1, 8 Bipolar 2, and 2 Bipolar NOS.
b
Other diagnoses include psychosis NOS (n=25), schizophreniform disorder (n=15), delusional disorder (n=3), and brief psychosis (n=1).
c
Education was missing for four patients: two with schizophrenia, one with major depressive disorder, and one with a diagnosis in the “other” category.

Factor Analysis

A four‐factor solution was chosen among candidates including between three and ten factors. This solution was suggested as most favorable by the scree plot, was the most parsimonious solution with RMSEA and SRMR estimates below our preferred thresholds of 0.08 and 0.05, and had a solution that was clinically meaningful and robust to decisions made in the course of analysis. Factor loadings for items in the final exploratory factor analysis model are in Table S1. The four factors corresponded to clinical presentations that fit the descriptions: manic, depressive, negative symptoms, and positive symptoms. YMRS and MADRS items loaded almost exclusively on the manic and depressive factors, respectively. PANSS items loaded on all four factors. This solution had an RMSEA estimate of 0.07 and SRMR value of 0.04, values generally associated with adequate model fit (26, 27).
Three items were excluded prior to analysis: insight from YMRS, hostility from PANSS‐P, and inner tension from MADRS. The first two items were excluded because of similarity to items from other scales, reflected in high observed correlations, and the third because it was interpreted inconsistently by raters. Seven additional items were excluded in the course of arriving at a final solution: five because they did not meet the 0.40 threshold for loading on any factor (appearance from YMRS and somatic concern, tension, disorientation, and preoccupation from PANSS‐G) and two because of similar loadings on multiple factors (concentration difficulties from MADRS and conceptual disorganization from PANSS‐G). These cognitive symptoms are known features of all psychoses (28). Likelihood‐based fit statistics did not contribute to choice of solution because, as is common for large datasets, model fit consistently improved with inclusion of additional factors, even when solutions had no clear interpretation and only one or two items loaded on one or more factors. Results for the four‐factor solution were qualitatively similar when treating the items as ordinally rather than intervally scaled, when excluding more extreme item values, and when using least‐squares estimation rather than maximum‐likelihood estimation. The six‐factor solution, which included factors appearing to correspond to thought disturbance and hostility‐aggression, in addition to those identified using the four‐factor solution, was considered as an alternative solution because of potential clinical relevance. However, the six‐factor solution only minimally improved fit over the four‐factor solution, and treatment of the items as ordinally rated resulted in a six‐factor solution with a factor loading on sleep items replacing the thought disturbance factor.

Agreement of Factor Scores with DSM Diagnoses

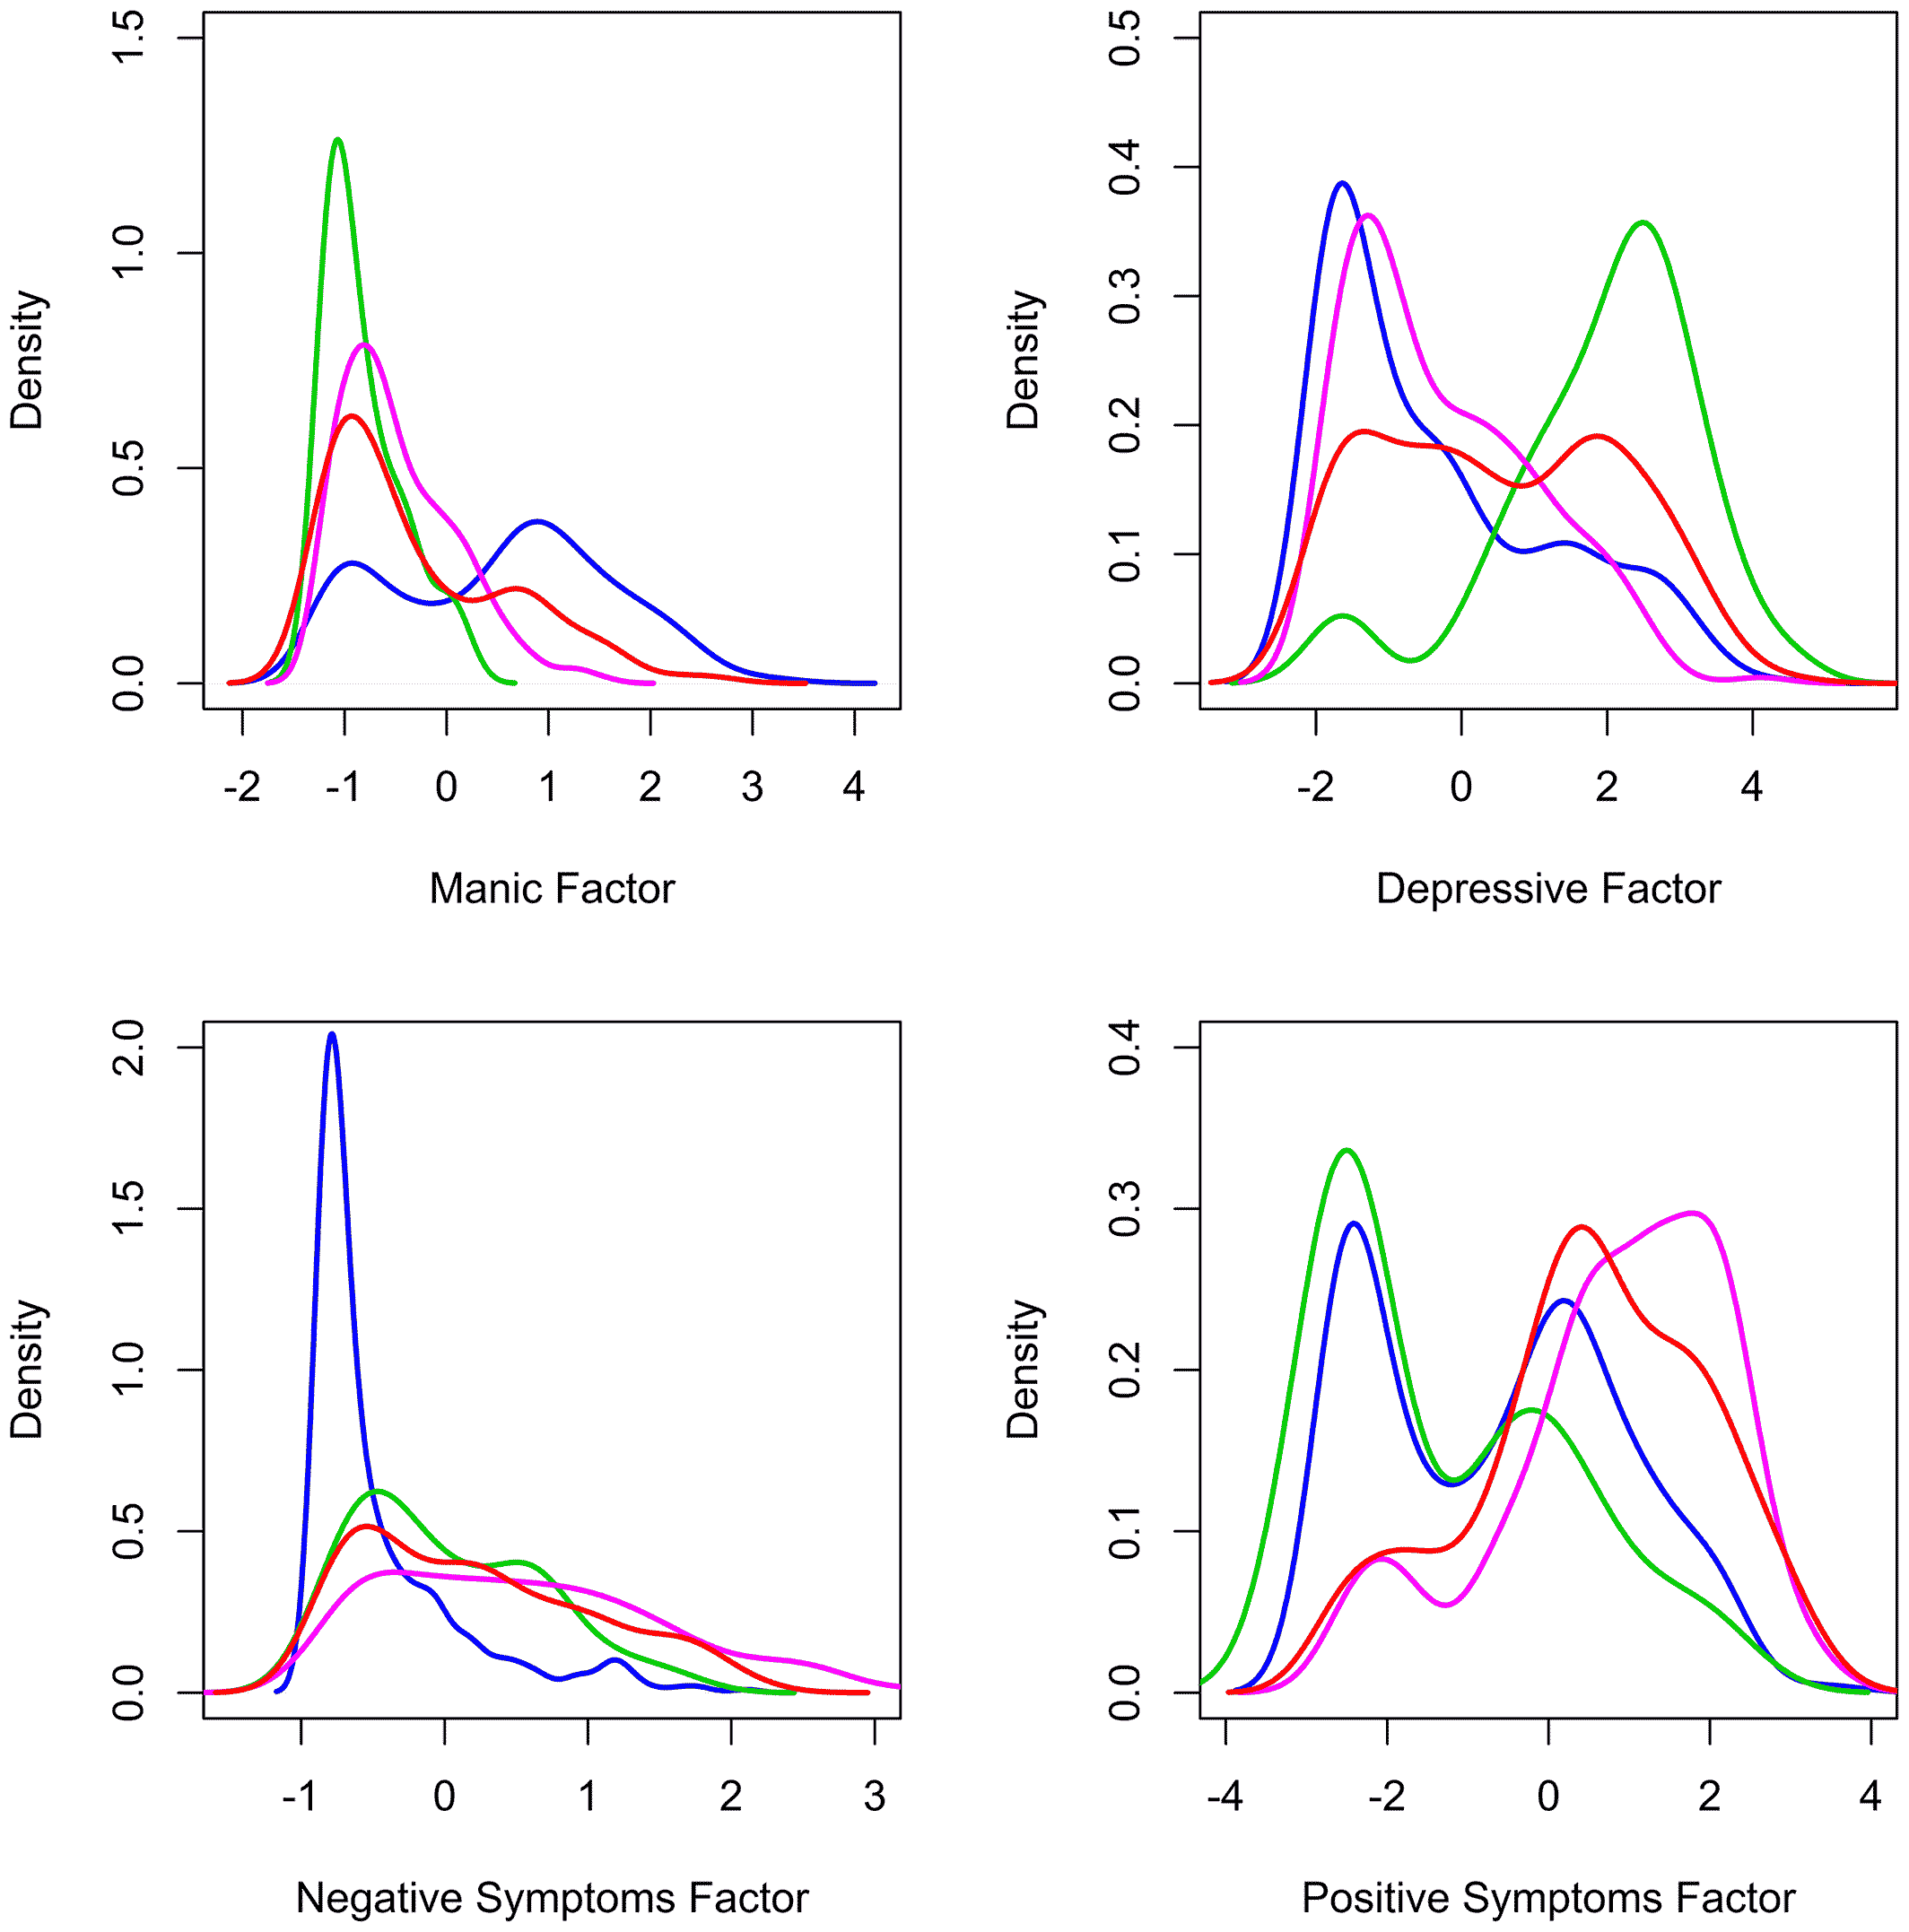
Figure 1 shows density plots of factor‐based scores for the four most common DSM diagnoses in the sample. Overall, means on the factor‐based scores differ among diagnoses in expected ways. Patients with schizophrenia and schizoaffective disorder have the highest average factor scores for positive and negative symptoms. Patients with major depressive disorder are distinguished by higher scores on the depressive factor. Patients with bipolar disorder are distinguished by higher scores on the manic factor and lower scores on the negative symptom factor. However, the plots also show the substantial overlap in symptom presentation among patients categorized by DSM diagnoses for all four factors. That is, at the individual level, many symptom presentations are observed in multiple DSM diagnoses.
image
FIGURE 1. Density plots of factor‐based scores for the four most common DSM‐IV diagnoses in the sample: magenta=schizophrenia, red=schizoaffective disorder, blue=bipolar disorder, and green=major depressive disorder
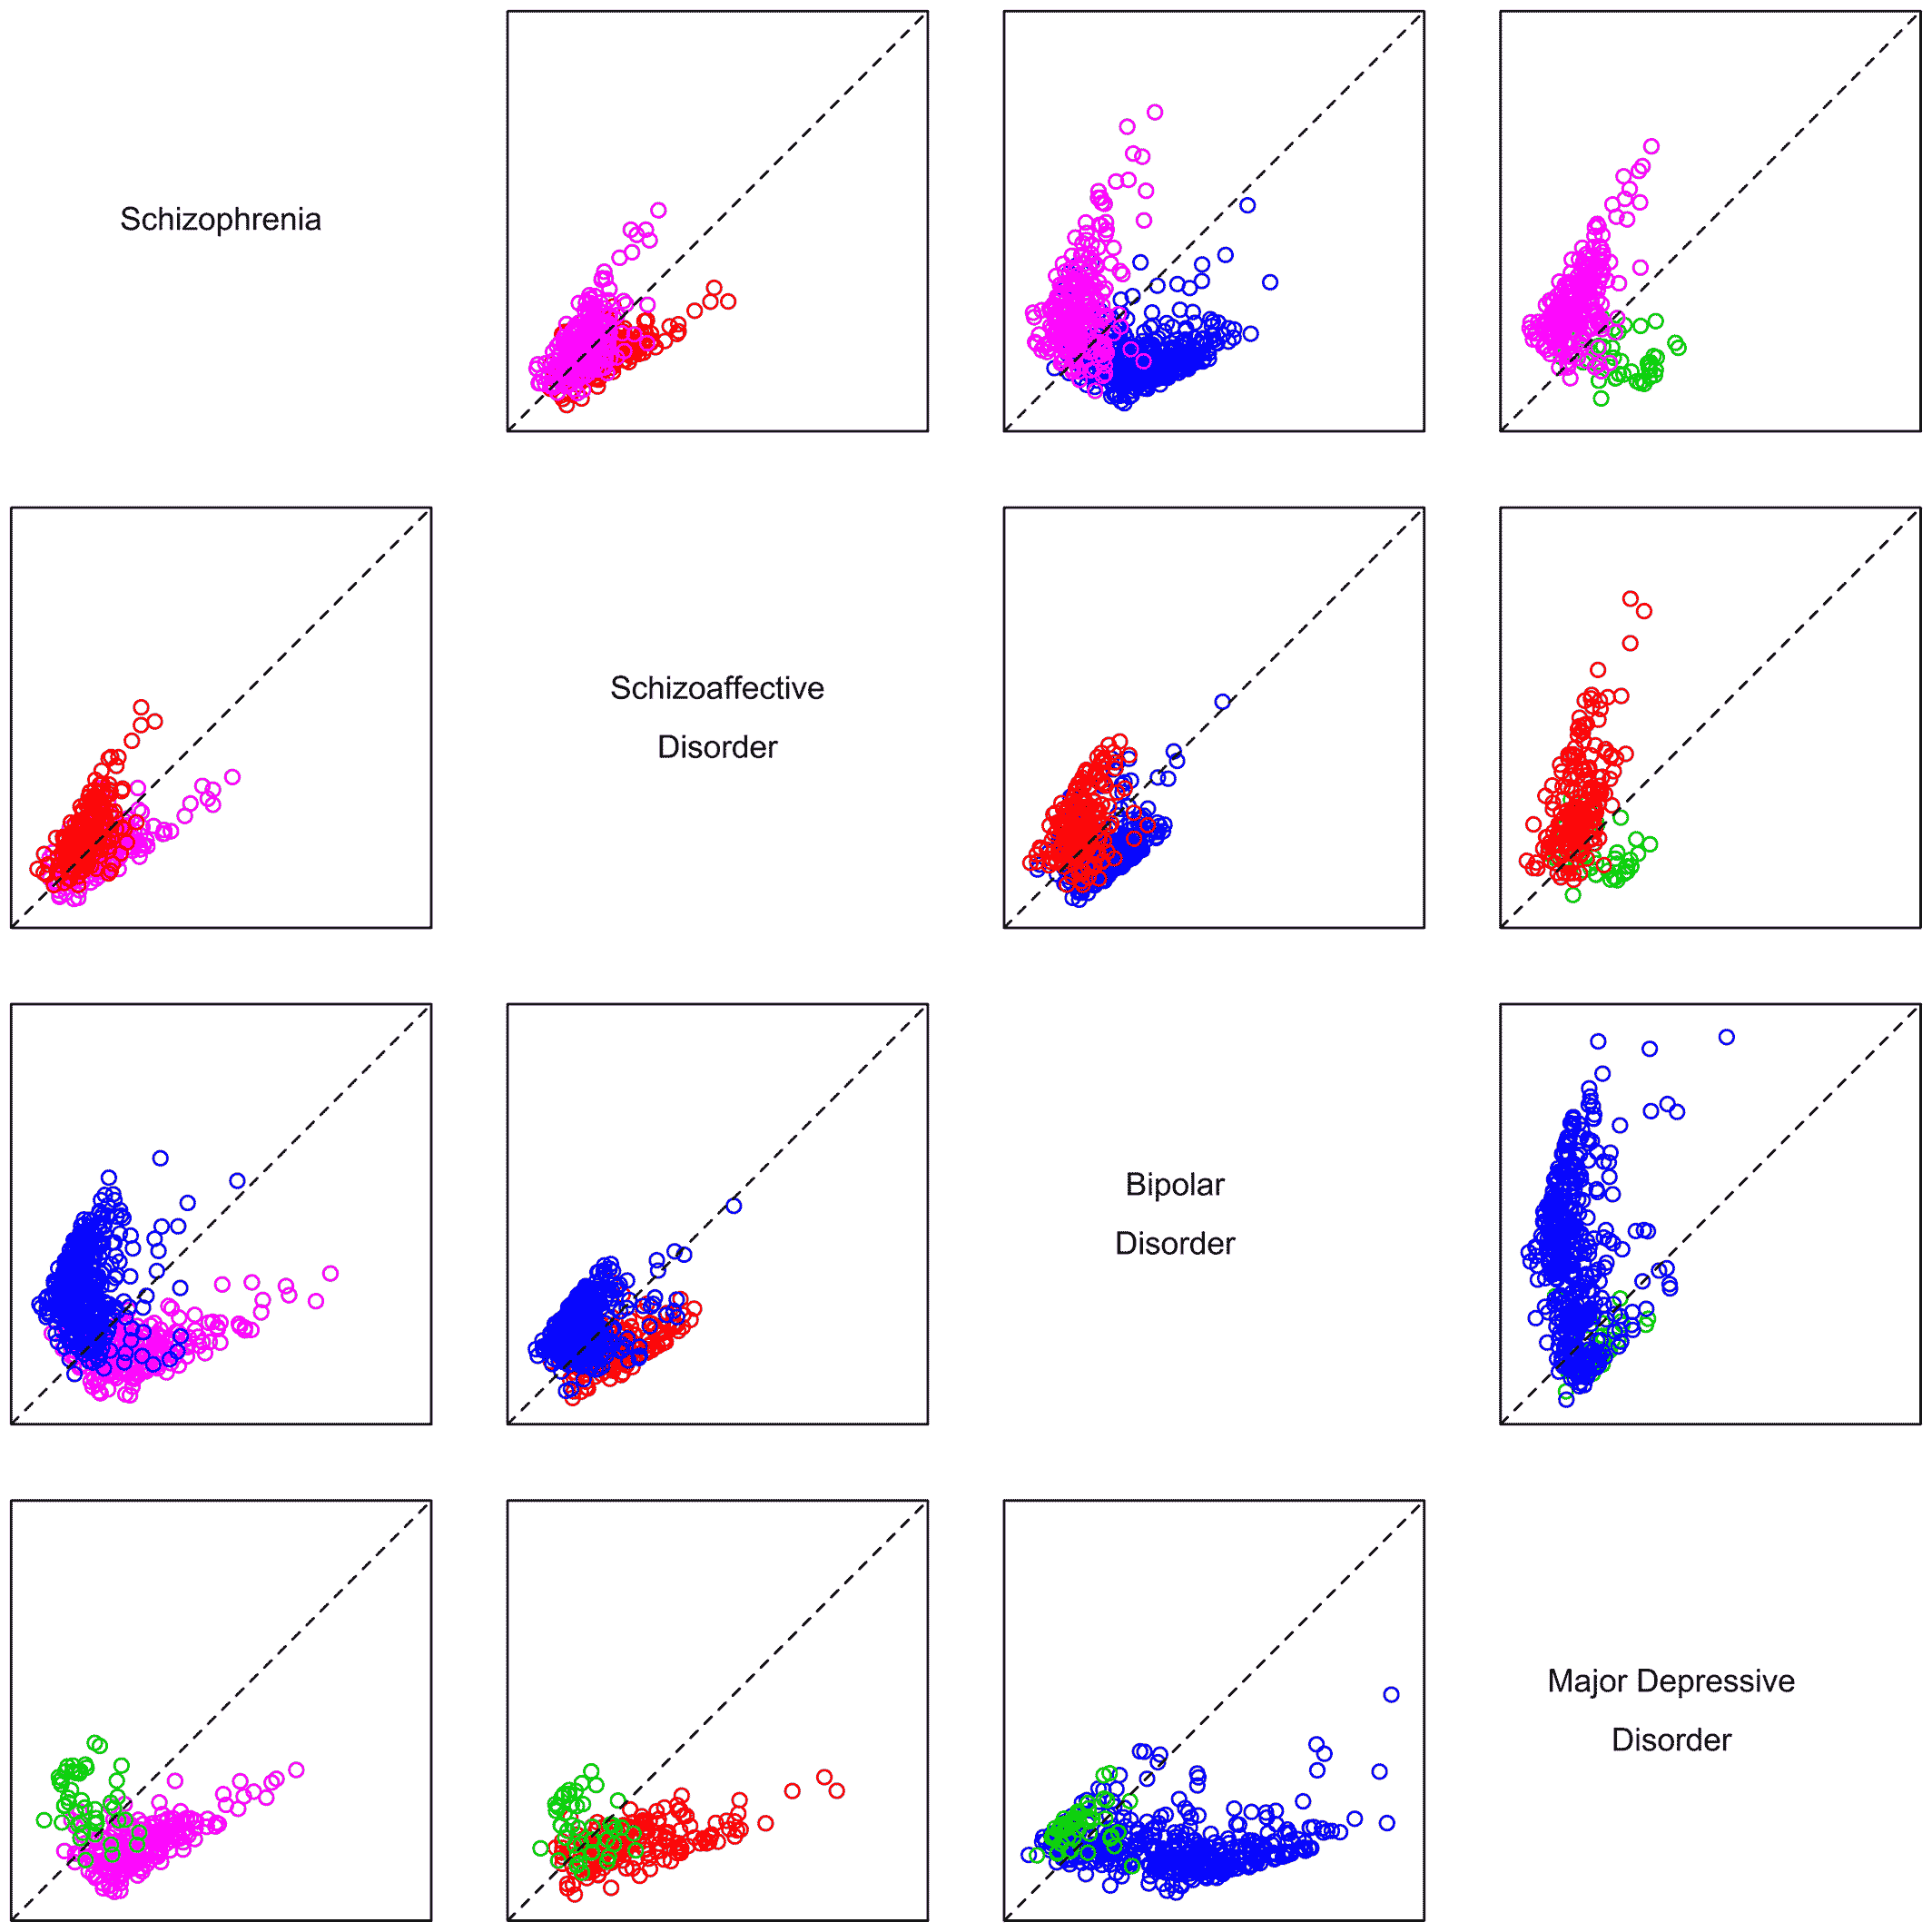
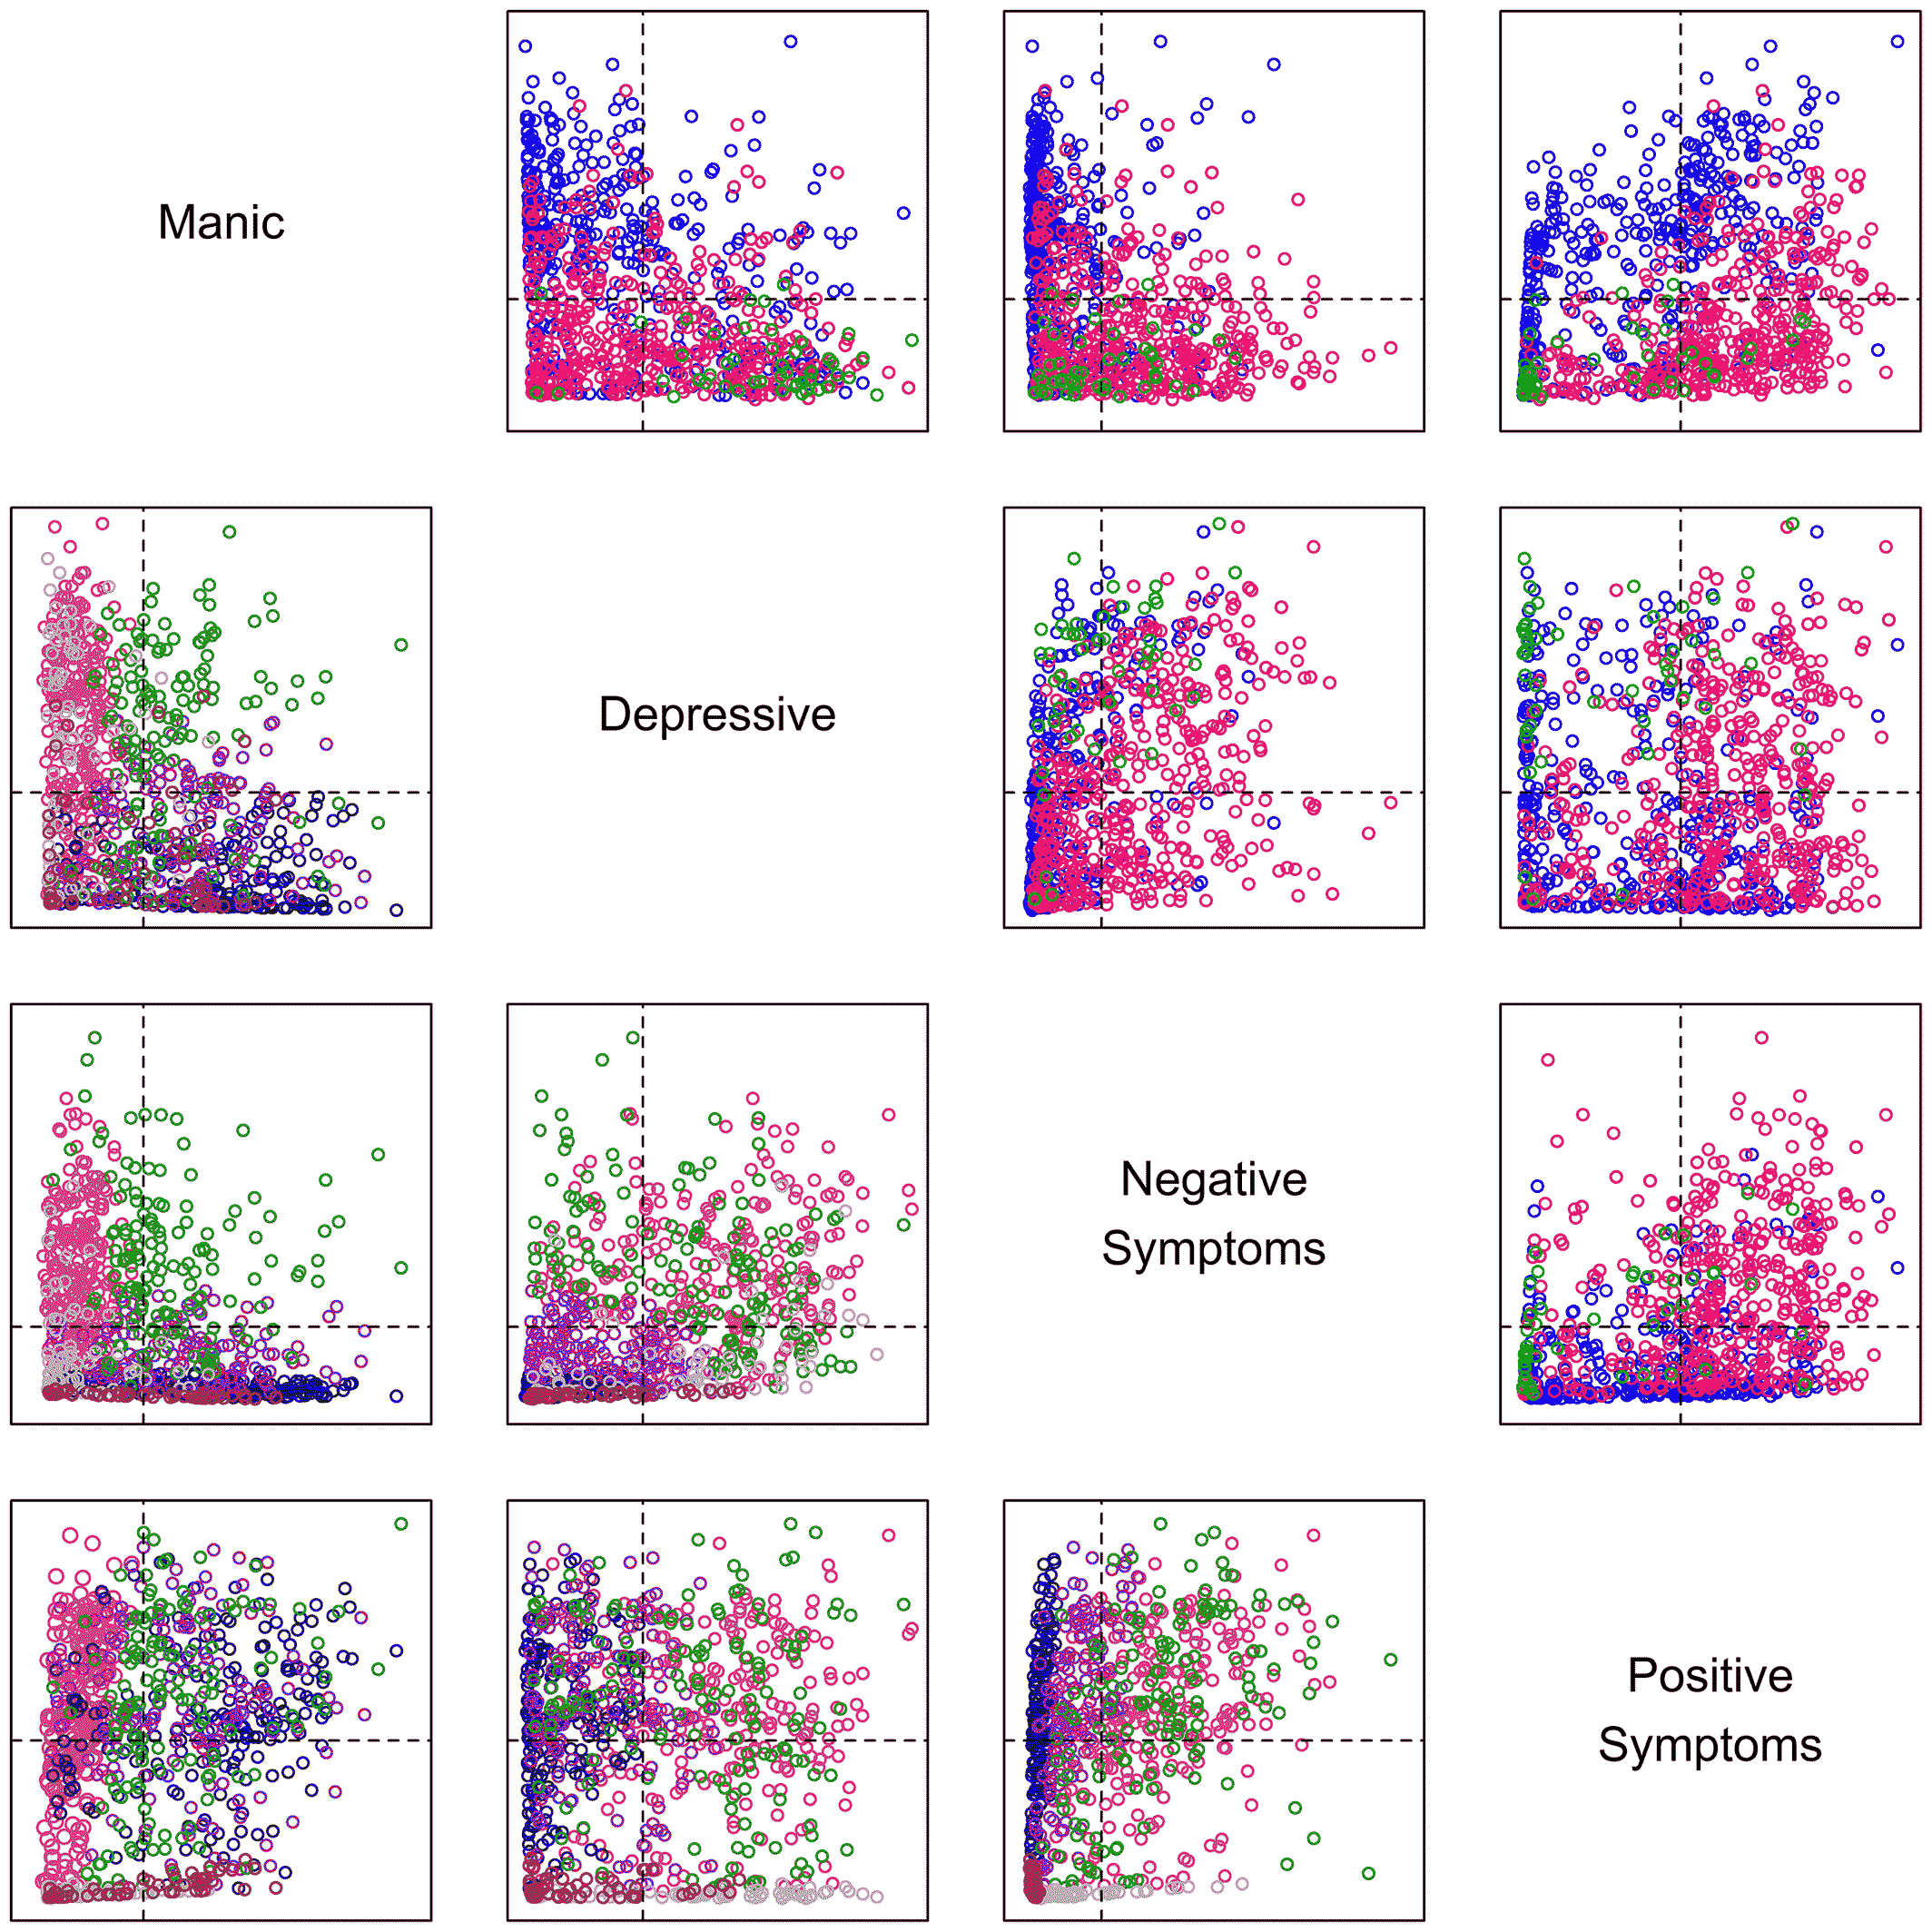
The overlap in symptom presentations is further reflected in scatterplots of factor‐based scores. The plots along the upper diagonal of Figure 2 show the substantial variability in scores within each diagnostic category and the substantial overlap in symptom profiles between diagnoses for each pair of scores. Differences across all four factor‐based scores by diagnosis are summarized in Figure 3, which displays the Malhalanobis distance, or the multivariate distance of each patient's set of factor scores from the observed means for different DSM diagnoses. As seen, all pairs of diagnoses had many patients with factor‐based scores more consistent with alternate DSM diagnoses than their own DSM diagnosis.
image
FIGURE 2. Scatterplots of the column factor‐based scores (y‐axis) versus the row factor‐based scores (x‐axis) for the four most common DSM‐IV diagnoses and the six highest membership clusters. The black dashed lines cross at the origin (the sample mean for the two scores). Scores are plotted by DSM‐IV diagnosis in the upper diagonal, magenta=schizophrenia, red=schizoaffective disorder, blue=bipolar disorder, and green=major depressive disorder. Scores are plotted by cluster in the lower diagonal, Dnp=orange, Mnp=navy, mdnp=purple, DNmp=green, Dn=gray, and m=brown
image
FIGURE 3. Malhalanobis distance plots showing the multivariate distance of each patient's factor‐based scores from his or her assigned DSM‐IV diagnosis versus alternative DSM‐IV diagnoses. Distances for patients with either the row diagnosis (X axis) or column diagnosis (Y axis) are displayed in each plot, magenta=schizophrenia, red=schizoaffective disorder, blue=bipolar disorder, and green=major depressive disorder. For diagnoses that are easily differentiated, patients will have small distances corresponding to their assigned diagnosis and large distances corresponding to the alternative diagnosis; that is, points corresponding to the row diagnosis should cluster in the upper left quadrant of each plot. For poorly distinguished diagnoses, some patients will have distances more consistent with the alternative diagnosis than their own diagnosis; that is, some points corresponding to the row diagnosis will cross the diagonal line separating the top and bottom areas of the plot

Data‐Derived Clusters

Based on BIC, the best‐fitting parsimonious categorical model allowed seven different distributions (or clusters) and allowed both the variance of factor‐based scores and the correlations between factor‐based scores to differ across clusters. The CmP of the selected model among all 36 candidate models (a minimum of one and a maximum of nine clusters for each of four possible covariance structures) was 1.00, highly favoring our selection. Patients were assigned to clusters for which they had the highest probability of membership. Average estimated probability of assigned membership was 87%, and 99% of patients had an estimated probability greater than 50%. Details of the clusters derived from our sample are provided in Table S2. In brief, the analysis identified seven clusters named according to their profiles of mean factor‐based scores, with capital letters indicating a mean factor‐based score in the high range (>0.75) and lowercase letters indicating scores in the medium range (≥−0.75 and ≤0.75). In order of highest prevalence in the sample, the clusters were Dnp, Mnp, mdnp, DNmp, Dn, m, and dn (M=manic, D=depressive, N=negative, and P=positive).
All clusters contained substantial numbers of patients with all three most common diagnoses: schizophrenias, schizoaffective disorders, and bipolar disorders (see Table S2 and Figure S1). Unlike the results of factor score analysis, results of cluster analysis demonstrated substantial sensitivity to statistical assumptions and modeling approach. Placing additional constraints on variance tended to produce results favoring different numbers of clusters with different mean profiles. For example, assumptions of equal variance of factor‐based scores across clusters and zero correlation between scores within clusters, which are equivalent to the assumptions underlying traditional profile analysis (29), resulted in the selection of a nine cluster solution (using BIC‐based criterion). In contrast, the latent‐class approach using cut‐points of the factor scores to predict class membership favored the choice of three classes, none of which could be characterized as combinations of the clusters.

Association with Medications Prescribed at Discharge

Physicians prescribe medications based on their overall evaluation of their patients. All three groups of clinical predictors were significantly associated with the use of all four classes of psychotropic medications at discharge (Table 2). Models with only factor‐based scores had discrimination better than or comparable to models with only DSM categories or only clusters as predictors (Table 2). When both factor‐based scores and DSM categories were included, both were significant as predictors for antidepressants and mood stabilizers, but only factor‐based scores remained significant for antipsychotic use. When both factor‐based scores and cluster assignments were included, only factor‐based scores were significant predictors for antipsychotics, antidepressants, and mood stabilizers. Neither factor‐based scores, DSM diagnoses, nor cluster assignments were significant in models with both scores and categories as predictors of anxiolytic use, and models had fair to poor discrimination for this treatment.
TABLE 2. Areas under the curve (C‐statistics) and p‐values associated with models for use of different classes of psychotropic medication at discharge with alternate sets of clinical predictors
 AntipsychoticsAntidepressantsMood stabilizersAnxiolytics
Factor‐based scores
c‐Statistic0.720.800.770.60
p‐Value<0.001<0.001<0.0010.01
DSM categories
c‐Statistic0.650.710.790.59
p‐Value<0.001<0.001<0.0010.02
Clusters
c‐Statistic0.690.760.700.60
p‐Value<0.001<0.001<0.0010.006
Factor‐based scores and DSM categories
c‐Statistic0.730.810.820.61
p‐Value factors<0.001<0.001<0.0010.08
p‐value DSM categories0.28<0.001<0.0010.09
Factor‐based scores and clusters
c‐Statistic0.730.800.770.61
p‐Value, factors<0.001<0.001<0.0010.34
p‐Value, clusters0.100.610.230.10
Note: C‐statistics are for logistic regression models with age, sex, and the designated clinical scores or categories as predictors. Associated p‐values are for multiple‐degree‐of‐freedom tests of the significance of the clinical predictor.
Odds ratios for prescription of the four medications at discharge are provided in Table S3. For antipsychotics, the model with only factor‐based scores had good discrimination (c=0.72). Higher positive symptom scores were most strongly associated with use of antipsychotics (OR=1.4, 95% CI=1.2–1.6 for a one standard deviation increase in score). For antidepressant and mood stabilizer use, discrimination was excellent (c=0.81 antidepressants, c=0.82 mood stabilizers, models with both factor‐based scores, and DSM diagnoses). Antidepressant use was more likely for patients with lower scores for the manic factor (OR=0.4, 95% CI=0.3–0.5), higher scores for the depressive factor (OR=1.4, 95% CI=1.3–1.6), and a DSM diagnosis of major depressive disorder (OR vs. schizophrenia=2.0, 95% CI=0.9–4.5). Antidepressant use was less likely for patients with diagnoses of psychosis NOS and bipolar disorder (OR vs. schizophrenia=0.5, 95% CI=0.2–1.6 for psychosis NOS; 0.6, 95% CI=0.3–1.0 for bipolar disorder). Prescription of mood stabilizers was more likely for patients with higher scores for the manic factor (OR=1.5, 95% CI=1.2–1.9), and DSM diagnoses of bipolar disorder (OR vs. schizophrenia=9.7, 95% CI=5.8–16.4), and schizoaffective disorder (OR vs. schizophrenia=3.8, 95% CI=2.4–6.0).

Discussion

The results of these analyses of clinical presentation confirm factors as valuable descriptive features of psychoses. The factors observed are robust, having been repeatedly documented as key features in this and past studies. And they better characterize patients in this data set than traditional (DSM) categories or alternative categories derived from the very patients studied. The patients' clinical presentations are well described by the identified factors. By comparison, clinical characteristics do not reliably suggest categories of patients. Rather, individual patients are spread throughout the multidimensional space described by the factors, suggesting their illnesses do not fall into clusters with clear divisions.
The existing literature has highlighted roles for both categorical and dimensional features in nosology of psychoses. Ours is the first study, to our knowledge, comparing categories and factors derived from the same patient population with one another and with standard diagnoses, as well as the only such study with an external validator. We derived the same factors observed in other samples, suggesting that the findings are generalizable to a broader population of patients with psychoses. And as noted, they strongly suggest that using factors improves characterization of clinical presentation over DSM‐defined categories or data‐derived categories alone. While there is no gold standard for defining the structure of the psychoses, effective treatment, as determined by the responsible physician, likely reflects important aspects of illness. Thus, the correlation of factors with treatment is compelling evidence supporting the value of describing patients by factors in addition to categories.
The underlying architecture of the psychoses is complex. Thousands of genes and various external stressors work through numerous processes to determine clinical presentation (13). Although clinical episodes vary in type and degree of symptoms, they have typically been modeled with a small number of categories, notably schizophrenia‐like or affective‐like psychoses, but with a telling intermediate category of schizoaffective disorders, suggesting either a continuum, co‐morbid illnesses, or a multidimensional structure of psychoses. The three‐category model has never satisfied the field as accounting for the diffuse range of patient presentations (30). Many causes, including gene variants, and numerous higher‐level mechanisms, including circuit anomalies, are shared across diagnostic categories (31, 32, 33). Standard categories are not homogeneous with regard to these underlying mechanisms (13, 31). Further, symptoms and mechanisms producing those symptoms, are likely not only shared across illnesses, but also with the rest of the population (34, 35). Current diagnoses provide a useful way to dichotomize people into ill and well groups and categorize people by approximate type of illness for treatment and study, but the illnesses are not all or none; they are dimensional (6). Features of illness vary in severity and dimensions can help model the psychoses. Among these dimensional features are the factors consistently observed among the many studies of the psychoses. These factors are naturally complementary to categorical structures in characterizing psychoses (5). They address aspects of psychosis missing in categorical models and thought to be relevant to a full description of these disorders.
There are limitations to this study. While it presents comparisons not previously examined, and is an order of magnitude greater than past studies of categorical and dimensional models, it is not large enough to provide fine details on the important components of either the categories or factors derived. In addition, the items contributing to the analysis were all from well‐established and validated clinical scales supporting dimensional assessment. This helped to ensure inclusion of the most common clinical features of the disorders and to capture the range of symptom severity, but also may have favored those items fitting well into a dimensional framework and tending to reliably correlate with the clinical features the scales were designed to assess. We are not suggesting that the factors we studied are the only factors to be considered. Rather, they are prominent and relevant ones that we and others have evaluated and found to be useful.
Cognitive symptoms were underrepresented and mood symptoms overrepresented in our study relative to some past studies investigating the structure of psychoses. Inclusion of additional items assessing cognition may have resulted in the identification of a cognitive factor, particularly given that a cognitive dimension has been identified in a number of other studies (4) and a thought disturbance factor was represented in an alternate, less robust factor solution in our study. We have not addressed anxiety and substance abuse as factors, in part because they are not specific features of psychoses and present across all of our patient groups. However, we realize that they matter and require future consideration (16). Similarly, we did not analyze for suicidality, which is associated with all psychiatric disorders and has, to some degree, its own genetic and experiential determinants (36, 37). The sample population was examined cross‐sectionally. We modeled current states of the patients, the ones in which they presented for treatment. Additional data of value would include the course of symptom and diagnostic variability. Such data might be available in clinics with large groups of longitudinally treated populations. Incorporation of information on history in the diagnostic process may have given DSM‐based categories an advantage over data‐derived categories in our analysis. Our patients required hospitalization, which means they represent a more severe cohort than those seen in a community sample. We did not include data from experimental technologies, such as brain imaging, genomics or cell biology, but did use a variety of comprehensive symptom scales to characterize clinical presentation. Biomarkers, as they develop, can add value in modeling psychoses.
Our statistical approaches have limitations. We would have preferred to compare fits of dimensional, categorical, and hybrid models based on individual symptom ratings rather than identify categories based on the results of dimensional modeling. Our data did not support fitting models of this complexity. Finite mixture modeling, used to identify our clusters, has the potential to identify spurious categories when the assumption of multivariate normality is violated (38). More generally, this and other approaches to identifying latent categories do not prove the existence of categories but rather describe the categories identified under a chosen set of rules and assumptions. Despite limitations, we can note that categories identified in our patients were sensitive to approach and, therefore, may not provide an optimal system for describing patients.
Categorical classifications of psychiatric disorders, as used for over 100 years, have shown utility in clinical work and for investigation (6). However, psychiatric disorders only partially fit any categorical diagnostic model (39). Current diagnostic categories group people with different symptoms and different causes and mechanisms of illness together. Concurrently, they separate people with overlapping genomic risk factors or who share aspects of altered brain structure and function into different cohorts. Improving the accuracy and detail of patient description by adding dimensions could be worthwhile (6, 10).
The current results identify key dimensional factors that can be of utility in the nosology of psychoses and provide validation on the importance of those factors, including their fit as an accurate model of psychoses. The factors are not complex to assess and could easily be used for clinical and research purposes, as a complement to categorical models. The factors identified and validated here may be associated with particular sets of genes, particular biomarkers, particular altered developmental pathways, or particular targets for treatment. The same may be true for other factors mentioned but not further evaluated in our study. There is already evidence of the value of such comparisons of genes (40) and other biomarkers (33, 41) to factors, not just to standard diagnoses, in research on psychoses. Treatment decisions already follow factors, as suggested by the analyses in this study and the results of previous studies (42).
Ultimately, categorical and dimensional models are complementary. A combined model should be best, as suggested by the current analysis. Neither the dimensional characterization of psychotic disorders nor the particular dimensions suggested by our analysis are new; DSM and ICD 11 have introduced dimensional features in exploratory fashion for psychoses (2, 9). Rather, our results support the inclusion of these dimensional features in more completely characterizing the disorders and serve as a reminder that even validated and informative categorical classification systems may benefit from incorporating dimensional information. More research on categorical and dimensional models, on hybrid models combining the two, in new onset and established illnesses, in both cross‐sectional and longitudinal studies, and for clinical and research purposes, should all prove worthwhile going forward. Specifically, measures of the presence and severity of the factors noted here should be added to the diagnostic model and tested to refine their practicality and utility.
Supplementary Material

File (rcp21007-sup-0001-table_s1.docx)
Supporting Information

References

REFERENCES

1.
Kraepelin E: Die erscheinungsformen des Irreseins. Zeitschrift für die gesamte Neurologie und Psychiatrie 1920; 62(1):1–29. translation in Hoff and Beer, 1992, Hist Psychiatry 1993(1912):1499–1529
2.
Barch DM, Bustillo J, Gaebel W, et al: Logic and justification for dimensional assessment of symptoms and related clinical phenomena in psychosis: relevance to DSM‐5. Schizophr Res 2013; 150(1):15–20
3.
Heckers S, Barch DM, Bustillo J, et al: Structure of the psychotic disorders classification in DSM‐5. Schizophr Res 2013; 150(1):11–14
4.
Potuzak M, Ravichandran C, Lewandowski KE, et al: Categorical vs dimensional classifications of psychotic disorders. Compr Psychiatry 2012; 53(8):1118–1129
5.
Helzer JE, Kraemer HC, Krueger RF: The feasibility and need for dimensional psychiatric diagnoses. Psychol Med 2006; 36(12):1671–1680
6.
Kendler KS: Classification of psychopathology: conceptual and historical background. World Psychiatry 2018; 17(3):241–242
7.
Peralta V, Cuesta MJ: A dimensional and categorical architecture for the classification of psychotic disorders. World Psychiatry 2007; 6(2):100–101
8.
American Psychiatric Association : Diagnostic and Statistical Manual of Mental Disorders, 5th ed. Arlington, VA, American Psychiatric Association, 2013
9.
Reed GM, First MB, Kogan CS, et al: Innovations and changes in the ICD‐11 classification of mental, behavioural and neurodevelopmental disorders. World Psychiatry 2019; 18(1):3–19
10.
Krueger RF, Kotov R, Watson D, et al: Progress in achieving quantitative classification of psychopathology. World Psychiatry 2018; 17(3):282–293
11.
Cuthbert BN, Insel TR: Toward the future of psychiatric diagnosis: the seven pillars of RDoC. BMC Med 2013; 11:126
12.
Plana‐Ripoll O, Pedersen CB, Holtz Y, et al: Exploring comorbidity within mental disorders among a Danish national population. JAMA Psychiatry 2019; 76(3):259–270
13.
Cohen BM: Embracing complexity in psychiatric diagnosis, treatment, and research. JAMA Psychiatry 2016; 73(12):1211–1212
14.
Peralta V, Cuesta MJ, Giraldo C, et al: Classifying psychotic disorders: issues regarding categorial vs. dimensional approaches and time frame to assess symptoms. Eur Arch Psychiatry Clin Neurosci 2002; 252(1):12–18
15.
Murray V, McKee I, Miller PM, et al: Dimensions and classes of psychosis in a population cohort: a four‐class, four‐dimension model of schizophrenia and affective psychoses. Psychol Med 2005; 35(4):499–510
16.
Young S, Pfaff D, Lewandowski KE, et al: Anxiety disorder comorbidity in bipolar disorder, schizophrenia and schizoaffective disorder. Psychopathology 2013; 46(3):176–185
17.
Young RC, Biggs JT, Ziegler VE, et al: A rating scale for mania: reliability, validity and sensitivity. Br J Psychiatry 1978; 133:429–435
18.
Montgomery SA, Asberg M: A new depression scale designed to be sensitive to change. Br J Psychiatry 1979; 134:382–389
19.
Kay SR, Fiszbein A, Opler LA: The positive and negative syndrome scale (PANSS) for schizophrenia. Schizophr Bull 1987; 13(2):261–276
20.
First MB, Spitzer RL, Gibbon M, et al: Structured clinical interview for DSM‐IV‐TR axis I disorders, research version, patient edition. (SCID‐I/P). New York, Biometrics Rsearch, New York State Psychiatric Institute, 2002
21.
Muthén LK, Muthén BO: Mplus User's Guide, 6th ed. Los Angeles, CA, Muthén & Muthén, 1998– 2010
22.
Brereton RG: The Mahalanobis distance and its relationship to principal component scores. J Chemometr 2015; 29(3):143–145
23.
Masyn KE: Latent class analysis and finite mixture modelling; in The Oxford Handbook of Quantitative Methods in Psychology Vol. 2 Statistical Analysis. Edited by Little TD. Oxford University Press, 2013. https://doi.org/10.1093/oxfordhb/9780199934898.013.0025
24.
Nagin DS: Group‐Based Modeling of Development. Cambridge, MA, Harvard University Press, 2005
25.
Scrucca L, Fop M, Murphy TB, et al: mclust 5: clustering, classification and density estimation using Gaussian finite mixture models. R J 2016; 8(1):289–317
26.
Schreiber JB, Nora A, Stage FK, et al: Reporting structural equation modeling and confirmatory factor analysis results: a review. J Educ Res 2006; 99(6):323–338
27.
Fabrigar LR, Wegener DT, MacCallum RC, et al: Evaluating the use of exploratory factor analysis in psychological research. Psychol Methods 1999; 4(3):272–299
28.
Lewandowski KE, Cohen BM, Ongur D: Evolution of neuropsychological dysfunction during the course of schizophrenia and bipolar disorder. Psychol Med 2011; 41(2):225–241
29.
Lanza ST, Collins LM: Latent Class and Latent Transition Analysis with Applications in the Social, Behavioral, and Health Sciences. Hoboken, NJ, John Wiley & Sons, 2010
30.
McGorry PD, Bell RC, Dudgeon PL, et al: The dimensional structure of first episode psychosis: an exploratory factor analysis. Psychol Med 1998; 28(4):935–947
31.
Hyman SE: New evidence for shared risk architecture of mental disorders. JAMA Psychiatry 2019; 76(3):235–236
32.
Smoller JW, Andreassen OA, Edenberg HJ, et al: Psychiatric genetics and the structure of psychopathology. Mol Psychiatry 2019; 24(3):409–420
33.
Xia CH, Ma Z, Ciric R, et al: Linked dimensions of psychopathology and connectivity in functional brain networks. Nat Commun 2018; 9(1):3003
34.
Jollans L, Whelan R: Neuromarkers for mental disorders: harnessing population neuroscience. Front Psychiatry 2018; 9:242
35.
Taylor MJ, Martin J, Lu Y, et al: Association of genetic risk factors for psychiatric disorders and traits of these disorders in a Swedish population twin sample. JAMA Psychiatry 2019; 76(3):280–289
36.
Currier D, Mann JJ: Stress, genes and the biology of suicidal behavior. Psychiatr Clin North Am 2008; 31(2):247–269
37.
Fiori LM, Wanner B, Jomphe V, et al: Association of polyaminergic loci with anxiety, mood disorders, and attempted suicide. PLoS One 2010; 5(11):e15146
38.
Lubke GH, Spies JR. Choosing a “correct” factor mixture model: Power, limitations, and graphical data exploration; in Advances in Latent Variable Mixture Models. Edited by Hancock GR, Samuelsen KM. Charlotte, NC, Information Age Publishing, 2008;343–361
39.
Kassraian‐Fard P, Matthis C, Balsters JH, et al: Promises, pitfalls, and basic guidelines for applying machine learning classifiers to psychiatric imaging data, with autism as an example. Front Psychiatry 2016; 7:177
40.
Bipolar Disorder and Schizophrenia Working Group of the Psychiatric Genomics Consortium : Genomic dissection of bipolar disorder and schizophrenia, including 28 subphenotypes. Cell 2018; 173(7):1705–1715
41.
Reininghaus U, Böhnke JR, Chavez‐Baldini U, et al: Transdiagnostic dimensions of psychosis in the bipolar‐schizophrenia network on intermediate phenotypes (B‐SNIP). World Psychiatry 2019; 18(1):67–76
42.
Mattila T, Koeter M, Wohlfarth T, et al: Impact of DSM‐5 changes on the diagnosis and acute treatment of schizophrenia. Schizophr Bull 2015; 41(3):637–643

Information & Authors

Information

Published In

Go to Psychiatric Research and Clinical Practice
Psychiatric Research and Clinical Practice
Pages: 29 - 37

History

Received: 18 December 2019
Revision received: 15 June 2020
Accepted: 19 June 2020
Published online: 9 October 2020
Published in print: Spring 2021

Authors

Details

Caitlin Ravichandran, Ph.D.
Harvard Medical School, Boston, Massachusetts (C. Ravichandran, D. Ongur); McLean Hospital, Belmont, Massachusetts (C. Ravichandran, D. Ongur, B. M. Cohen); Lurie Center for Autism, Lexington, Massachusetts (C. Ravichandran); Robertson Steele Professor of Psychiatry, Harvard Medical School, Boston, Massachusetts (B. M. Cohen)
Dost Ongur, M.D., Ph.D.
Harvard Medical School, Boston, Massachusetts (C. Ravichandran, D. Ongur); McLean Hospital, Belmont, Massachusetts (C. Ravichandran, D. Ongur, B. M. Cohen); Lurie Center for Autism, Lexington, Massachusetts (C. Ravichandran); Robertson Steele Professor of Psychiatry, Harvard Medical School, Boston, Massachusetts (B. M. Cohen)
Bruce M. Cohen, M.D., Ph.D.
Harvard Medical School, Boston, Massachusetts (C. Ravichandran, D. Ongur); McLean Hospital, Belmont, Massachusetts (C. Ravichandran, D. Ongur, B. M. Cohen); Lurie Center for Autism, Lexington, Massachusetts (C. Ravichandran); Robertson Steele Professor of Psychiatry, Harvard Medical School, Boston, Massachusetts (B. M. Cohen)

Notes

Send correspondence to Dr. Cohen ([email protected])

Metrics & Citations

Metrics

Citations

Export Citations

If you have the appropriate software installed, you can download article citation data to the citation manager of your choice. Simply select your manager software from the list below and click Download.

For more information or tips please see 'Downloading to a citation manager' in the Help menu.

Format
Citation style
Style
Copy to clipboard

View Options

View options

PDF/EPUB

View PDF/EPUB

Login options

Already a subscriber? Access your subscription through your login credentials or your institution for full access to this article.

Personal login Institutional Login Open Athens login

Not a subscriber?

Subscribe Now / Learn More

PsychiatryOnline subscription options offer access to the DSM-5-TR® library, books, journals, CME, and patient resources. This all-in-one virtual library provides psychiatrists and mental health professionals with key resources for diagnosis, treatment, research, and professional development.

Need more help? PsychiatryOnline Customer Service may be reached by emailing [email protected] or by calling 800-368-5777 (in the U.S.) or 703-907-7322 (outside the U.S.).

Media

Figures

Other

Tables

Share

Share

Share article link

Share