Full access
Articles
Published Online: 11 May 2022

Standardized Versus Tailored Implementation of Measurement-Based Care for Depression in Community Mental Health Clinics

Abstract

Measurement-based care (MBC) systematically tracks patient symptoms and informs treatment but is rarely used in psychotherapy. The authors compared standardized and tailored MBC implementation. Tailored implementation resulted in better Patient Health Questionnaire completion for depression in mental health clinics.

Abstract

Objective:

Measurement-based care (MBC) is an evidence-based practice that is rarely integrated into psychotherapy. The authors sought to determine whether tailored MBC implementation can improve clinician fidelity and depression outcomes compared with standardized implementation.

Methods:

This cluster-randomized trial enrolled 12 community behavioral health clinics to receive 5 months of implementation support. Clinics randomized to the standardized implementation received electronic health record data captured with the nine-item Patient Health Questionnaire (PHQ-9), a needs assessment, clinical training, guidelines, and group consultation in MBC fidelity. Tailored implementation support included these strategies, but the training content was tailored to clinics’ barriers to MBC, and group consultation centered on overcoming these barriers. Clinicians (N=83, tailored; N=71, standardized) delivering individual psychotherapy to 4,025 adults participated. Adult patients (N=87, tailored; N=141, standardized) contributed data for depression outcome analyses.

Results:

The odds of PHQ-9 completion were lower in the tailored group at baseline (odds ratio [OR]=0.28, 95% CI=0.08–0.96) but greater at 5 months (OR=3.39, 95% CI=1.00–11.48). The two implementation groups did not differ in full MBC fidelity. PHQ-9 scores decreased significantly from baseline (mean±SD=17.6±4.4) to 12 weeks (mean=12.6±5.9) (p<0.001), but neither implementation group nor MBC fidelity significantly predicted PHQ-9 scores at week 12.

Conclusions:

Tailored MBC implementation outperformed standardized implementation with respect to PHQ-9 completion, but discussion of PHQ-9 scores in clinician-patient sessions remained suboptimal. MBC fidelity did not predict week-12 depression severity. MBC can critically inform collaborative adjustments to session or treatment plans, but more strategic system-level implementation support or longer implementation periods may be needed.

HIGHLIGHTS

Measurement-based care (MBC) is an evidence-based practice that is rarely used in psychotherapy.
Use of a tailored approach to MBC implementation can improve MBC measure completion.
Neither implementation group nor MBC fidelity affected depression symptom change in this study.
Additional supports, including system-level strategies, may be needed to improve MBC fidelity and patient outcomes.
Measurement-based care (MBC) is an evidence-based practice defined as the systematic evaluation of patient symptoms before or during a patient-clinician encounter to inform treatment. MBC fidelity is assessed with three elements: completion of a patient self-report measure, score review by the clinician, and discussion of scores between clinician and patient to inform session and treatment plans (1). MBC has been touted as the minimal intervention needed to change usual care (2) to improve outcomes (3). Despite its transtheoretical (i.e., MBC can be integrated across theoretical orientations) and transdiagnostic (i.e., MBC can be used across many diagnoses) potentials, MBC is rarely used, with <20% of behavioral health providers reporting use of MBC consistent with its evidence base (1).
Barriers at the patient, provider, organization, and system levels prevent MBC use with fidelity. It is unclear whether a standardized or a tailored approach is needed to support MBC implementation into mental health care. Although standardized approaches (i.e., one-size-fits-all approaches) may offer greater scale-out potential, mounting research suggests that tailored approaches (i.e., those that are customized and collaborative) may be needed to address a specific clinic’s needs and barriers (4, 5).
This study reports the design and results of a cluster-randomized trial (6) that compared the effects of standardized MBC implementation with those of tailored MBC implementation on clinician (e.g., fidelity to MBC) and patient (i.e., depression severity) outcomes in Centerstone, one of the United States’ largest nonprofit community behavioral health systems (1). We hypothesized that the tailored implementation would outperform the standardized implementation in terms of clinician fidelity and patient depression improvement and that MBC fidelity would be associated with greater improvements in patient depression severity.

Methods

Trial Design

Twelve community behavioral health clinics across Indiana and Tennessee enrolled in a dynamic cluster-randomized trial conducted from June 2015 to June 2019. MBC was optional for clinics (i.e., not mandated) during this trial. Randomization was conducted similarly to methods described by Chamberlain et al. (7), with a sequential design for clustered observations. Clinics were matched on urbanicity, number of clinicians, and number of patients seeking depression treatment. Eight clinic clusters were randomly created to fill four cohorts (first) and two groups (second) by creating 10,000 random permutations and selecting a clustering with optimal similarity between the two groups. No blinding to group was used. Eligible clinicians at all clinics were offered a 4-hour MBC training, followed by 5 months of active implementation support. Details of the study protocol are described elsewhere (8). All study procedures were approved by the institutional review board at Indiana University.

Implementation Groups

No usual care comparison group was used; clinics in both groups, that is, standardized MBC implementation and tailored MBC implementation, were offered active MBC implementation support (4). The standardized implementation consisted of empirically informed strategies to enhance MBC use with fidelity to the following clinical guideline: administer, review, and discuss patient-reported outcome measures (PROMs) at each clinical session for adult patients with depression. These strategies included electronic health record (EHR) enhancements for MBC data capture, a needs assessment, interactive workshop training informed by adult learning theory (4), the aforementioned clinical guideline, and triweekly group consultation with an MBC expert during the 5-month active implementation phase. On average, six clinicians per site participated in consultation meetings. Tailored implementation included these strategies, and the workshop training was tailored to clinics’ barriers to MBC delivery informed by a mixed-methods needs assessment at baseline. Clinics could also adapt the MBC guideline (e.g., expand the number of patients receiving MBC) and had 5 months of triweekly implementation team meetings with an MBC implementation expert focused on overcoming contextual barriers to MBC use (e.g., task shifting administration of measures to staff at the front desk). On average, seven staff members per site participated in the meetings, including clinic administrators (N=13), office professionals (N=5), and clinicians (N=22). Across implementation groups, between five and 14 clinicians participated in the workshop training, with an average of 10 clinicians per site. A previous study provides a full description of the implementation groups (4).

Participants

Clinicians (N=154) offering individual psychotherapy to depressed adults across 12 clinics participated in this study (recruited in person or via e-mail from June 3, 2015, to October 18, 2016). (See an online supplement to this article for further details.) Clinicians were coded as primarily serving adults (N=107, 69%) versus children and families (N=47, 31%). Clinicians who served primarily children and families were included in this study only if their caseload had a significant portion of adult patients, given the focus of the MBC intervention on adults in this study. Across clinicians, 15,686 sessions yielded MBC-relevant EHR data for adult patients with a depression diagnosis; clinicians had a mean±SD of 101.9±91.6 sessions. For depression severity outcome analyses, clinicians had to have at least one participating patient; 81 clinicians (53%) met this criterion.
Patient data were included in the main clinician-level outcome analyses if the patients were diagnosed as having depression (see the online supplement) and were at least 21 years old at their first session with a participating clinician. Initially, only new patients were included, but eligibility was expanded to include existing patients, given the clinical utility of MBC for terminating psychotherapy cases. A total of 4,025 patients contributed data, across a mean of 3.9±3.4 sessions. For the analyses assessing depression severity outcomes, a subset of these patients were recruited to participate in structured telephone interviews with research specialists if they scored ≥10 on the nine-item Patient Health Questionnaire (PHQ-9) (911) after a qualifying encounter (see the online supplement). In total, 228 patients (i.e., the “interview sample”) consented to participate for a 12-week period of data collection that closed with readministration of the PHQ-9.

Measures

Clinician and clinic factors.

Clinician demographic characteristics, as well as two factors measured at baseline that are the strongest predictors of MBC fidelity (12, 13)—that is, attitudes toward MBC (14, 15) and perceptions of implementation leadership support (16)—were included as potential moderators in analyses of depression severity outcome. Clinician attendance at the MBC workshop was also explored as a moderator.

Patient factors.

Demographic characteristics for patients who contributed fidelity data were obtained from the EHR, and additional demographic characteristics were collected from the interview sample (e.g., education and employment status); age and gender were included as moderators in the depression severity outcome analyses. Psychiatric medication information (e.g., use of antidepressants, anticonvulsants, and anxiolytics) and psychiatric diagnoses (i.e., ICD codes) were obtained for all patients from the EHR at the first eligible encounter. Patients were characterized as new (i.e., intake session occurred during implementation phase) versus existing (i.e., psychotherapy encounters existed in EHR before implementation phase), a variable that was included as a moderator.

Depression severity.

Centerstone leadership decided to use the PHQ-9 as the PROM to guide MBC (911). The PHQ-9 assesses each of the nine DSM criteria for depressive disorders on a 0–3 scale, with possible scores ranging from 0 to 27. Scores of 5, 10, 15, and 20 represent thresholds for mild, moderate, moderately severe, and severe depressive symptoms, respectively; total PHQ-9 scores served as the primary outcome measure in analyses of depression severity outcome.

MBC fidelity.

MBC fidelity was captured by the EHR for each eligible patient-clinician psychotherapy encounter. Each encounter received a 0–3 score: 0, PHQ-9 not recorded; 1, clinician transferred PHQ-9 scores from patient’s paper copy of the completed questionnaire into the patient EHR progress note for automated scoring; 2, the clinician reviewed an automated PHQ-9 graph of PHQ-9 scores (opening the graph was objectively captured by the EHR in one state and self-reported by clinicians in the other state); and 3, the clinician discussed the PHQ-9 scores with the patient as indicated by clinician self-report via a checkbox in the EHR progress note. Missing data were coded as a nonrecorded PHQ-9. Because reviewing the graphical depiction of PHQ-9 scores was on record for only 1% of sessions (in Indiana-based clinics, graphs were produced outside of the progress note in the EHR forms section and so were rarely used), this category was collapsed with recording PHQ-9 scores. Ultimately, three variables were derived by aggregating the fidelity data: the total number of sessions (used as a covariate), the number of sessions in which the PHQ-9 was recorded, and the number of sessions in which the PHQ-9 was discussed (representing full fidelity).

Statistical Analysis

Our target N of 150 clinicians was informed a priori via a Monte Carlo simulation (power=0.80, two-tailed, α=0.05, intraclass correlation=0.05) to detect effect sizes of Cohen’s d≥0.30. Descriptive statistics were generated for all variables. We investigated the clinician outcome of MBC fidelity with two variables: whether the PHQ-9 was recorded in the EHR and, among encounters for which the PHQ-9 was recorded, whether it was discussed. These outcomes were modeled by using generalized linear mixed models with a logit link function for a binary distribution. Odds ratios (ORs) and ratios of odds ratios (RORs) with 95% confidence intervals (CIs) were derived by exponentiating the parameter estimates and CIs. All models were fit with the lme4 package, version 1.1.23 (17), by using R version 3.6.2 (18). Both outcome models were constructed with an identical sequence and included random intercepts for data from clinicians and patients, and model comparisons were evaluated with the Bayesian information criterion (BIC); the model with the best BIC was selected. Following recommendations from Singer and Willett (19), we fit unconditional growth models for best characterization of time (i.e., linear, quadratic, and log-transformed number of months). After establishing the unconditional growth model, we added fixed effects in the following sequence: one, group main effect, and two, group × time interaction. Finally, we investigated new versus existing patient status as a main effect by using a dummy variable for new patient status and as a patient status × group interaction.
Analyses of depression severity outcomes were modeled with linear mixed models with Satterthwaite degrees of freedom implemented in the R lmerTest package, version 3.1.2 (20). Because 23% (N=52 of 228) of patients who completed a baseline PHQ-9 interview did not complete the interview at week 12, we used multiple imputation to estimate missing values across 20 data sets. Data were imputed with the R Amelia package, version 1.7.6 (21). First, we assessed changes in PHQ-9 scores between intake and week 12 with a mixed model containing patient status as a covariate and random intercepts for patient and clinic. Implementation group was added to the base model described above. To examine the impact of MBC fidelity on patient depression severity, we added to the base model the total number of sessions, the number of sessions in which the PHQ-9 was recorded, and the number of sessions in which the PHQ-9 was discussed. We also examined the interactions between new patient status and the main outcome variables.

Results

Clinicians were primarily non-Hispanic White women (64%, N=99), with a mean age of 43.1±12.6 years (standardized implementation, 44.7±12.7 years; tailored implementation, 41.7±12.5 years). No significant differences in clinician demographic characteristics between the two implementation groups were noted (Table 1).
TABLE 1. Demographic characteristics of the clinicians in this study and putative moderator variablesa
 Standardized (N=71)Tailored (N=83)Total (N=154)
CharacteristicN%N%N%
Categorical      
 Genderb      
  Women5476678112179
  Men172415183221
  Other01111
 Race-ethnicity      
  White5579748912984
  African American10148101812
  Otherc571164
  Hispanic/Latinx34032
 Currently licensed395554659360
 Therapeutic orientation      
  Cognitive behavioral426040498254
  Other284042517046
 Primarily serving adults4462637610769
Continuous      
 Age in years (mean±SD)44.7±12.7 41.7±12.5 43.1±12.6 
 Clinician self-reported change to session plan using MBC data (mean±SD score)d2.09±1.04 1.87±.96 1.97±1.00 
 Clinician perception (mean±SD score)e      
  MBC is of benefit to patients4.16±.45 4.19±.50 4.18±.30 
  MBC is harmful to patients2.34±.67 2.19±.66 2.26±.67 
  Leadership aligns with MBC implementationf2.82±.72 2.67±.83 2.74±.78 
a
Moderators included therapeutic orientation, primarily serving adults, clinician self-reported change to session plan using measurement-based care (MBC) data, clinician perception that MBC is of benefit to patients, clinician perception that MBC is harmful to patients, and clinician perception that leadership aligns with MBC implementation.
b
One clinician in the tailored group identified as transgender.
c
Other respondents selected Asian, Native Hawaiian or other Pacific Islander, Native American or Alaskan Native, or more than one race.
d
Clinicians were asked how often on average they alter or change their specific plan or activities for a given session on the basis of standardized progress measure scores with the following response options: 1, never; 2, every 90 days; 3, every month; and 4, every 1–2 sessions.
e
Attitudes were assessed with an established measure comprising two subscales with 5-point Likert scale items ranging from 1, “strongly disagree,” to 5, “strongly agree” (14, 15). Total and subscale scores on the attitudes measure ranged from 1 to 5.
f
Leadership was assessed with an established 5-point Likert scale ranging from 0, “not at all,” to 4, “to a very great extent” (16). Total scores on the leadership measure ranged from 0 to 4.
Patients were also primarily White (59%, N=2,377) and women (68%, N=2,739), with a mean age of 43.8±13.3 years. The most common primary diagnosis was depression (66%, N=2,681), followed by anxiety (16%, N=644) and bipolar disorder (4%, N=178). Patients differed on several baseline characteristics (e.g., race and primary payer) between the two groups (Table 2), but sensitivity analyses including these factors as covariates did not change the overall model results.
TABLE 2. Demographic characteristics of patients (N=4,055) whose data were used in the Patient Health Questionnaire-9–completed fidelity outcome analysis or were in the interview samplea
 Patients of participating cliniciansInterview sampleb
 Standardized implementation (N=1,966)Tailored implementation (N=1,861)Standardized implementation (N=141)Tailored implementation (N=87)
Demographic characteristicN%N%N%N%
Age (mean±SD years)44±4 44±13 44±11 42±12 
Gender        
 Women1,336681,2476795676170
 Men630326043346332630
Race-ethnicityc        
 White1,160***591,0815888*624855
 African American356181146221667
 Asian, Pacific Islander, Native American5<1121022
 Unknown race445236433531223136
 Hispanic/Latinx5735036433
 Unknown ethnicity402201791030211012
Top 4 primary diagnosesc        
 Anxiety disorder300***153231810**91113
 Bipolar spectrum disorder9757742222
 Depressive disorder1,355691,16363104885972
 Substance use disorder2111217067
Relationship status        
 Single and not dating845435773136262832
 Dating, cohabitating, or living with partner196102601425181214
 Engaged or married590305583043312630
 Separated or divorced255134282331222124
 Widowed593563430
Educationc        
 Less than high school285***1621317211747
 High school698386044857463255
 Vocational or 2 years of college or college286161942225241426
 Graduate school322252220
 Unknown40122132111311712
Employment statusc        
 Unemployed or not in labor force1,096***608177190774781
 On disability664000
 Student1712<100
 Employed part-time or full-time37120275222319712
 Unknown268158975447
Main medicationd        
 Second-generation antipsychotic653455244432372143
 Antidepressant1,352921,1289482944592
 Anticonvulsant mood stabilizer510354153533381939
 Benzodiazepinec422***292422022251123
 Antianxiety571394984226*302653
Primary payerc        
 Commercial295***162361622***1769
 Medicaid924497394964493656
 Medicare24313906141123
 Safety net23713966211635
 Other or unknown21092308227
a
Some percentages are based on different denominators because of missing values.
b
In the interview sample (i.e., patients who provided depression symptom data through structured telephone interviews [N=228]), 198 participants were also included in the patients of participating clinicians (total N=4,025). The 198 cases that were in both samples are reported only in the interview sample so that each of the 4,055 respondents is represented only once in the table.
c
Statistically significant differences between standardized and tailored groups were assessed with Fisher’s exact test. *p<0.05, **p<0.01, ***p<0.001 for group across all levels of the demographic characteristic.
d
Participants could have more than one main medication.

PHQ-9 Recorded in EHR

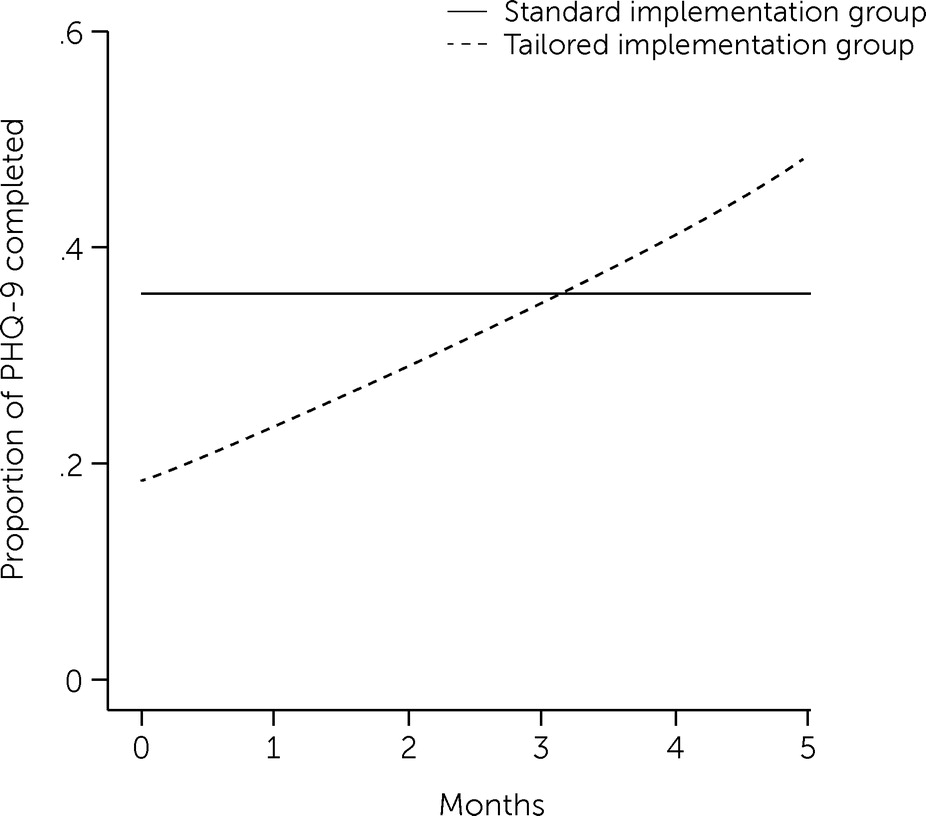
The PHQ-9 completion rate was lower in the tailored implementation group at baseline but increased over time, eventually surpassing the rate in the standardized implementation group (Table 3, Figure 1). A statistically significant negative effect on PHQ-9 completion in the tailored implementation group (OR=0.28) indicated that patients in this group had lower PHQ-9 completion rates at baseline (i.e., time=0), but a significant time × tailored interaction effect (ROR=1.60) indicated that the main effect changed over time in the tailored group (Table 3). Differences in estimated values from the models revealed that the odds of PHQ-9 completion were lower in the tailored implementation group at baseline (OR=0.28) but approximately three times greater at the median length of the implementation phase (5.3 months) (OR=3.39, 95% CI=1.00–11.48). In addition, PHQ-9 completion was more likely for new patients than for existing patients in the tailored implementation group (OR=1.77, 95% CI=1.42–2.22) but not in the standardized implementation group (OR=1.05, 95% CI=0.85–1.29).
TABLE 3. Odds ratios for measurement-based care fidelity outcome models exploring Patient Health Questionnaire–9 completion and discussion
 Treatment modelaNew patient modelb
Effect type and termOR95% CIOR95% CI
Completed models    
 Interceptc.24.10–.57.24.10–.57
 Time1.00.96–1.051.00.96–1.05
 Tailored implementation.28.08–.96.26.08–.87
 Time × tailored implementationd1.601.50–1.711.581.48–1.68
 New patient  1.05.85–1.29
 Tailored implementation × new patientd  1.701.25–2.30
Discussed models    
 Interceptc1.70.31–9.351.70.31–9.35
 Time 0–3 months.62.56–.69.62.56–.69
 Time >3 months1.991.73–2.281.991.73–2.28
 Tailored implementation1.72.16–18.381.72.16–18.36
 New patient  .99.82–1.19
a
The treatment model contained parameters representing only treatment group and time.
b
The new patient model contained all parameters in the treatment model along with new patient status and interactions containing new patient status.
c
The value in the odds ratio column is the exponentiated parameter estimate and represents the odds of the outcome when covariates equal zero.
d
The value in the odds ratio column is the exponentiated parameter estimate and represents the ratio of odds ratios.
FIGURE 1. Patient Health Questionnaire–9 (PHQ-9) forms completed over time, by MBC implementation groupa
aPredicted values for standardized measurement-based care (MBC) implementation and tailored MBC implementation groups from the time × tailored interaction were obtained with the treatment model presented in Table 3.

Full MBC Fidelity

Information about clinic guidelines for tailored MBC implementation and descriptive statistics of clinicians’ MBC fidelity by implementation group are provided in the online supplement. The set of models examined the impact of implementation group on full MBC fidelity (exploring whether patient scores were discussed in a clinician-patient session after PHQ-9 administration) over time. After excluding sessions in which the PHQ-9 had not been completed, 5,522 sessions held by 126 clinicians for 2,059 patients remained in the sample. After evaluating a variety of models of the change in MBC fidelity, we selected a piecewise model wherein one time segment represented the first 3 months of the implementation phase and another segment the last 2 months of that phase. Full MBC fidelity (i.e., a PHQ-9 result was both recorded and discussed) decreased across time (OR=0.62) for the first 3 months of the earlier phase of implementation (i.e., the first 3 months of implementation) but increased (OR=1.99) during the later implementation phase (i.e., from 3 months to the end of implementation) (Table 3). However, the implementation groups (tailored vs. standardized) did not differ in full MBC fidelity in the final model (Table 3). The addition of the new patients × tailored interaction did not improve model fit.

Depression Severity

In both groups, PHQ-9 scores decreased substantially (b=−4.71, 95% CI=−5.53 to −3.89) from baseline (mean=17.6±4.4) to 12 weeks (mean=12.6±5.9). (See Tables S4 and S5 in the online supplement. Neither implementation group nor new patient × group interactions significantly predicted week-12 PHQ-9 scores. Additionally, neither the number of total patient sessions nor the number of sessions with a completed or discussed PHQ-9 predicted week-12 depression severity. Moreover, none of the interactions between these factors and new patient status significantly predicted week-12 depression severity. Finally, neither clinician-level (i.e., MBC attitudes and perceptions of implementation leadership) nor patient-level (i.e., age, gender, number of diagnoses of comorbid conditions, medication type, and new patient status) factors significantly moderated depression severity at week 12.

Postsession Telephone Survey

Exploratory analyses of postsession telephone survey data from patients suggested that in nearly half (47%, N=255 of 541) of the clinical encounters, therapy did not change as a result of PHQ-9 data review, whereas in 27% (N=144 of 541) of encounters a new goal was set and in 24% (N=130 of 541) a new strategy was tried.

Discussion

In partial support of our hypotheses, the tailored MBC implementation approach outperformed standardized MBC implementation. The better performance of the tailored MBC implementation was indicated by an increased likelihood of having PHQ-9 forms completed in the EHR at study completion, which is the most basic component of MBC fidelity. Mounting evidence suggests that addressing clinic-specific barriers is critical to implementing new practices such as MBC (5). We previously studied implementation strategy deployment by the implementation teams in the six clinics assigned to the tailored implementation and observed on average 39 discrete strategies for improving implementation, including quality management (50%, e.g., audit and feedback), restructuring (16.5%, e.g., revise professional roles), communication (15.7%), education (8.9%), planning (7.2%, e.g., assess for readiness), and financing (1.7%, e.g., offer an incentive) (22). One explanation for superior performance in clinics assigned to tailored implementation may be that five of the six clinics engaged office professionals (i.e., front desk staff) in the implementation teams and assigned them to facilitate PHQ-9 administration in order to remove the time barrier associated with in-session PHQ-9 administration by the clinician (22). This strategy may also explain why, for new patients in the clinics using tailored implementation, PHQ-9s were more likely to be on record—office professionals may have included the PHQ-9 in intake packets at the start of treatment.
However, no difference was observed between the two implementation groups for full MBC fidelity. Scores on postimplementation surveys appeared to indicate that clinicians in both groups had sufficient knowledge and favorable attitudes to meaningfully integrate PHQ-9 data into sessions (4, 12). It is possible that barriers at the organizational level were not sufficiently addressed, such as relative priority of the implementation and an organizational climate that expects, supports, and rewards MBC delivery with fidelity. Even in the clinics assigned to the tailored implementation, we saw few examples of engaging opinion leaders or champions, shifting incentives to reward MBC, modifying role expectations, or restructuring clinical supervision to be guided by MBC, which has been shown to increase standardized assessment administration with youths receiving treatment in community settings (23). Some of these strategies were planned by implementation teams in our trial but not enacted, perhaps because their strategy selection was often motivated by feasibility rather than by criticality parameters (24).
Finally, the significant improvement in PHQ-9 scores over 12 weeks of treatment could not be attributed to MBC fidelity. This finding suggests that usual care for moderately to severely depressed adult patients effectively improves depression among such patients and that PHQ-9 administration in roughly one-third of clinical encounters does not yield incremental benefits for patients. Our findings are consistent with results of a previous meta-analysis (25), indicating that PROM administration may be helpful but is relatively weak as a “stand-alone” intervention in the absence of organizational enhancements and systems support. Including a patient perspective on the implementation teams or in the consultation groups may have revealed critical barriers or ways to optimize MBC that are important for future research considerations.
In most MBC effectiveness studies, data were fed back to both patients and clinicians, particularly when cases were not showing progress as expected, and in many studies, clinical decision support offered guidance on how to adjust treatment on the basis of scores (1). MBC would ideally inform changes in treatment (e.g., more therapy sessions or adding pharmacotherapy). We were unable to link these data to important contextual information such as PHQ-9 scores over time, and so it is not clear whether these rates reflect the type and quality of PHQ-9 integration that has been found in other MBC effectiveness studies. The PHQ-9 has been used in many trials assessing the efficacy of collaborative care in which a nurse care manager regularly reviews and discusses scores with patients and uses an algorithm for increasing, switching, or augmenting medication treatment (2628). We note that the same clear guidance for PHQ-9 data–informed adjustments is not available for psychotherapy. It is possible that clinician- or patient-selected measures may be better integrated and more actionable in the psychotherapy context (1, 29).

Conclusions

Our findings suggest that despite potentially resulting in greater expense, tailored implementation support may be necessary to optimize implementation of evidence-based practices such as MBC. However, selection of implementation strategies may need to be guided by factors other than feasibility, and more time (>5 months) may be needed to achieve higher MBC fidelity. Indeed, a continuous quality improvement approach, commonly used in health care delivery systems, may be needed to support MBC fidelity (30, 31). Although technological solutions are on the horizon, multilevel implementation strategies will remain necessary to fully integrate MBC into psychotherapeutic treatment (1). Without this type of support, fidelity of evidence-based practice delivery may be undermined, resulting in an attenuated impact on patient outcomes.

Acknowledgments

Jenny Harrison at Crisis Access Engagement in Centerstone, IN, and Matt Hardy at Centerstone, TN, contributed to the design and execution of this study, as well as to the interpretation of the results. Candi Arnold served as study coordinator. Abigail Melvin, Brigid Marriott, Mira Hoffman, Hannah Kassab, Jacqueline Howard, and Iman Jarad served as research specialists contributing to study protocols and data collection.

Supplementary Material

File (appi.ps.202100284.ds001.pdf)

References

1.
Lewis CC, Boyd M, Puspitasari A, et al: Implementing measurement-based care in behavioral health: a review. JAMA Psychiatry 2019; 76:324–335
2.
Glasgow RE, Fisher L, Strycker LA, et al: Minimal intervention needed for change: definition, use, and value for improving health and health research. Transl Behav Med 2013; 4:26–33
3.
Scott K, Lewis CC: Using measurement-based care to enhance any treatment. Cogn Behav Pract 2015; 22:49–59
4.
Lewis CC, Puspitasari A, Boyd MR, et al: Implementing measurement based care in community mental health: a description of tailored and standardized methods. BMC Res Notes 2018; 11:76
5.
Baker R, Camosso-Stefinovic J, Gillies C, et al: Tailored interventions to address determinants of practice. Cochrane Database Syst Rev 2015; 2015:CD005470
6.
Curran GM, Bauer M, Mittman B, et al: Effectiveness-implementation hybrid designs: combining elements of clinical effectiveness and implementation research to enhance public health impact. Med Care 2012; 50:217–226
7.
Chamberlain P, Brown CH, Saldana L, et al: Engaging and recruiting counties in an experiment on implementing evidence-based practice in California. Adm Policy Ment Health 2008; 35:250–260
8.
Lewis CC, Scott K, Marti CN, et al: Implementing measurement-based care (iMBC) for depression in community mental health: a dynamic cluster randomized trial study protocol. Implement Sci 2015; 10:127
9.
Hirschtritt ME, Kroenke K: Screening for depression. JAMA 2017; 318:745–746
10.
Mitchell AJ, Yadegarfar M, Gill J, et al: Case finding and screening clinical utility of the Patient Health Questionnaire (PHQ-9 and PHQ-2) for depression in primary care: a diagnostic meta-analysis of 40 studies. BJPsych Open 2016; 2:127–138
11.
Levis B, Benedetti A, Thombs BD: Accuracy of Patient Health Questionnaire–9 (PHQ-9) for screening to detect major depression: individual participant data meta-analysis. BMJ 2019; 365:l1476
12.
Patel ZS, Jensen-Doss A, Lewis CC: MFA and ASA-MF: a psychometric analysis of attitudes towards measurement-based care. Adm Policy Ment Health 2021; 49:13–28
13.
Gifford E, Fuller A, Stephens R, et al: Implementation outcomes in context: leadership and measurement based care implementation in VA substance use disorder programs. Implement Sci 2015; 10:A74
14.
Jensen-Doss A, Haimes EMB, Smith AM, et al: Monitoring treatment progress and providing feedback is viewed favorably but rarely used in practice. Adm Policy Ment Health 2018; 45:48–61
15.
Jensen-Doss A, Smith AM, Becker-Haimes EM, et al: Individualized progress measures are more acceptable to clinicians than standardized measures: results of a national survey. Adm Policy Ment Health 2018; 45:392–403
16.
Aarons GA, Ehrhart MG, Farahnak LR: The implementation leadership scale (ILS): development of a brief measure of unit level implementation leadership. Implement Sci 2014; 9:45
17.
Bates DM, Sarkar D: lme4: Linear Mixed-Effects Models Using S4 Classes, R Package Version 0.99875–6. Vienna, Comprehensive R Archive Network, 2007
18.
The R Development Core Team: R: A Language and Environment for Statistical Computing. Vienna, R Foundation for Statistical Computing, 2013
19.
Singer JD, Willett JB: Applied Longitudinal Data Analysis: Modeling Change and Event Occurrence. New York, Oxford University Press, 2003
20.
Kuznetsova A, Brockhoff P, Christensen R: LmerTest: tests in linear mixed effects models. J Stat Softw 2015; 82:1–26
21.
Honaker J, King G, Blackwell M: A program for missing data. J Stat Softw 2011; 45:1–47
22.
Boyd MR, Powell BJ, Endicott D, et al: A method for tracking implementation strategies: an exemplar implementing measurement-based care in community behavioral health clinics. Behav Ther 2018; 49:525–537
23.
Lyon AR, Dorsey S, Pullmann M, et al: Clinician use of standardized assessments following a common elements psychotherapy training and consultation program. Adm Policy Ment Health 2015; 42:47–60
24.
Lewis CC, Scott K, Marriott BR: A methodology for generating a tailored implementation blueprint: an exemplar from a youth residential setting. Implement Sci 2018; 13:68
25.
Gilbody S, Sheldon T, House A: Screening and case-finding instruments for depression: a meta-analysis. Can Med Assoc J 2008; 178:997–1003
26.
Gaynes BN, Rush AJ, Trivedi MH, et al: Primary versus specialty care outcomes for depressed outpatients managed with measurement-based care: results from STAR*D. J Gen Intern Med 2008; 23:551–560
27.
Harding KJK, Rush AJ, Arbuckle M, et al: Measurement-based care in psychiatric practice: a policy framework for implementation. J Clin Psychiatry 2011; 72:1136–1143
28.
Kroenke K, Unutzer J: Closing the false divide: sustainable approaches to integrating mental health services into primary care. J Gen Intern Med 2017; 32:404–410
29.
Connors EH, Douglas S, Jensen-Doss A, et al: What gets measured gets done: how mental health agencies can leverage measurement-based care for better patient care, clinician supports, and organizational goals. Adm Policy Ment Health 2021; 48:250–265
30.
Knighton AJ, McLaughlin M, Blackburn R, et al: Increasing adherence to evidence-based clinical practice. Qual Manag Health Care 2019; 28:65–67
31.
Solomons NM, Spross JA: Evidence-based practice barriers and facilitators from a continuous quality improvement perspective: an integrative review. J Nurs Manag 2011; 19:109–120

Information & Authors

Information

Published In

Go to Psychiatric Services
Psychiatric Services
Pages: 1094 - 1101
PubMed: 35538748

History

Received: 13 May 2021
Revision received: 22 September 2021
Revision received: 9 December 2021
Accepted: 21 January 2022
Published online: 11 May 2022
Published in print: October 01, 2022

Keywords

  1. Depression
  2. Measurement based care
  3. Evidence based practice
  4. Implementation
  5. Hybrid trial
  6. Community mental health centers

Authors

Details

Cara C. Lewis, Ph.D. [email protected]
Kaiser Permanente Washington Health Research Institute, Seattle (Lewis); Abacist Analytics, Austin, Texas (Marti); Department of Behavioral and Social Sciences, Brown University, Providence, Rhode Island (Scott); School of Public Health, University of North Carolina, Chapel Hill (Walker); Department of Psychology, University of California, Los Angeles, Los Angeles (Boyd); Mayo Clinic, Rochester, Minnesota (Puspitasari); RAND Corporation, Santa Monica, California (Mendel); Department of Medicine, Indiana University, Bloomington (Kroenke).
C. Nathan Marti, Ph.D.
Kaiser Permanente Washington Health Research Institute, Seattle (Lewis); Abacist Analytics, Austin, Texas (Marti); Department of Behavioral and Social Sciences, Brown University, Providence, Rhode Island (Scott); School of Public Health, University of North Carolina, Chapel Hill (Walker); Department of Psychology, University of California, Los Angeles, Los Angeles (Boyd); Mayo Clinic, Rochester, Minnesota (Puspitasari); RAND Corporation, Santa Monica, California (Mendel); Department of Medicine, Indiana University, Bloomington (Kroenke).
Kelli Scott, Ph.D.
Kaiser Permanente Washington Health Research Institute, Seattle (Lewis); Abacist Analytics, Austin, Texas (Marti); Department of Behavioral and Social Sciences, Brown University, Providence, Rhode Island (Scott); School of Public Health, University of North Carolina, Chapel Hill (Walker); Department of Psychology, University of California, Los Angeles, Los Angeles (Boyd); Mayo Clinic, Rochester, Minnesota (Puspitasari); RAND Corporation, Santa Monica, California (Mendel); Department of Medicine, Indiana University, Bloomington (Kroenke).
Madison R. Walker, B.Sc.
Kaiser Permanente Washington Health Research Institute, Seattle (Lewis); Abacist Analytics, Austin, Texas (Marti); Department of Behavioral and Social Sciences, Brown University, Providence, Rhode Island (Scott); School of Public Health, University of North Carolina, Chapel Hill (Walker); Department of Psychology, University of California, Los Angeles, Los Angeles (Boyd); Mayo Clinic, Rochester, Minnesota (Puspitasari); RAND Corporation, Santa Monica, California (Mendel); Department of Medicine, Indiana University, Bloomington (Kroenke).
Meredith Boyd, M.A.
Kaiser Permanente Washington Health Research Institute, Seattle (Lewis); Abacist Analytics, Austin, Texas (Marti); Department of Behavioral and Social Sciences, Brown University, Providence, Rhode Island (Scott); School of Public Health, University of North Carolina, Chapel Hill (Walker); Department of Psychology, University of California, Los Angeles, Los Angeles (Boyd); Mayo Clinic, Rochester, Minnesota (Puspitasari); RAND Corporation, Santa Monica, California (Mendel); Department of Medicine, Indiana University, Bloomington (Kroenke).
Ajeng Puspitasari, Ph.D.
Kaiser Permanente Washington Health Research Institute, Seattle (Lewis); Abacist Analytics, Austin, Texas (Marti); Department of Behavioral and Social Sciences, Brown University, Providence, Rhode Island (Scott); School of Public Health, University of North Carolina, Chapel Hill (Walker); Department of Psychology, University of California, Los Angeles, Los Angeles (Boyd); Mayo Clinic, Rochester, Minnesota (Puspitasari); RAND Corporation, Santa Monica, California (Mendel); Department of Medicine, Indiana University, Bloomington (Kroenke).
Peter Mendel, Ph.D.
Kaiser Permanente Washington Health Research Institute, Seattle (Lewis); Abacist Analytics, Austin, Texas (Marti); Department of Behavioral and Social Sciences, Brown University, Providence, Rhode Island (Scott); School of Public Health, University of North Carolina, Chapel Hill (Walker); Department of Psychology, University of California, Los Angeles, Los Angeles (Boyd); Mayo Clinic, Rochester, Minnesota (Puspitasari); RAND Corporation, Santa Monica, California (Mendel); Department of Medicine, Indiana University, Bloomington (Kroenke).
Kurt Kroenke, M.D.
Kaiser Permanente Washington Health Research Institute, Seattle (Lewis); Abacist Analytics, Austin, Texas (Marti); Department of Behavioral and Social Sciences, Brown University, Providence, Rhode Island (Scott); School of Public Health, University of North Carolina, Chapel Hill (Walker); Department of Psychology, University of California, Los Angeles, Los Angeles (Boyd); Mayo Clinic, Rochester, Minnesota (Puspitasari); RAND Corporation, Santa Monica, California (Mendel); Department of Medicine, Indiana University, Bloomington (Kroenke).

Notes

Send correspondence to Dr. Lewis ([email protected]).

Funding Information

The research reported in this study was supported by the National Institute of Mental Health (awards R01 MH-103310 and F31 MH-111134) and the National Institute on Alcohol Abuse and Alcoholism (award T32AA007459).The authors report no financial relationships with commercial interests.

Metrics & Citations

Metrics

Citations

Export Citations

If you have the appropriate software installed, you can download article citation data to the citation manager of your choice. Simply select your manager software from the list below and click Download.

For more information or tips please see 'Downloading to a citation manager' in the Help menu.

Format
Citation style
Style
Copy to clipboard

There are no citations for this item

View Options

View options

PDF/ePub

View PDF/ePub

Get Access

Login options

Already a subscriber? Access your subscription through your login credentials or your institution for full access to this article.

Personal login Institutional Login Open Athens login
Purchase Options

Purchase this article to access the full text.

PPV Articles - Psychiatric Services

PPV Articles - Psychiatric Services

Not a subscriber?

Subscribe Now / Learn More

PsychiatryOnline subscription options offer access to the DSM-5-TR® library, books, journals, CME, and patient resources. This all-in-one virtual library provides psychiatrists and mental health professionals with key resources for diagnosis, treatment, research, and professional development.

Need more help? PsychiatryOnline Customer Service may be reached by emailing [email protected] or by calling 800-368-5777 (in the U.S.) or 703-907-7322 (outside the U.S.).

Media

Figures

Other

Tables

Share

Share

Share article link

Share