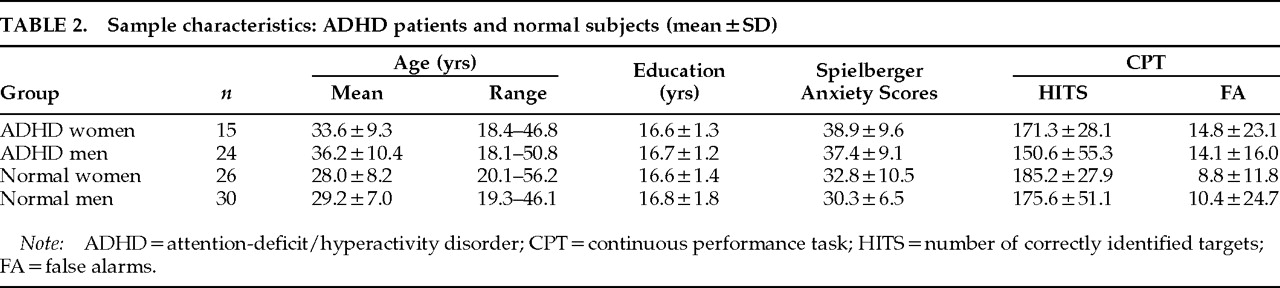
Sample Characteristics
The characteristics of the sample are presented in
Table 2. Gender distribution was similar in the control and ADHD groups (χ
2=0.44, df=1, not significant). By two-way ANOVA, there was no significant gender×diagnosis interaction with respect to education, age, anxiety state (STAI rating scores), or CPT performance. Diagnosis and gender had no significant main effects on levels of education (diagnosis:
F=0.05, df=1,91, not significant; gender:
F=0.27, df=1,91, not significant). However, there was a significant main effect of diagnosis, and not gender, for age, anxiety state, and CPT performance (HITS). Although the age range in the control group (19.3 to 56.3 years) was greater than in the ADHD group (18.1 to 50.8 years), the group of control adults (
n=56; 28.6±7.5 years old) was significantly younger than the ADHD group (
n=39; 35.2±9.9 years old;
F=12.79, df=1,91,
P<0.001). Performance on the auditory attention task (HITS and accuracy) was significantly worse in the ADHD group compared with the control group (HITS:
F=4.56, df=1,77
P=0.018; Accuracy:
F=3.68, df=1,77,
P=0.030). Finally, STAI anxiety scores during the uptake of the tracer were higher in the ADHD group (37.8±9.2) than in the control group (31.5±8.6;
F=12.63, df=1,90,
P<0.001), but not different between women and men in either group.
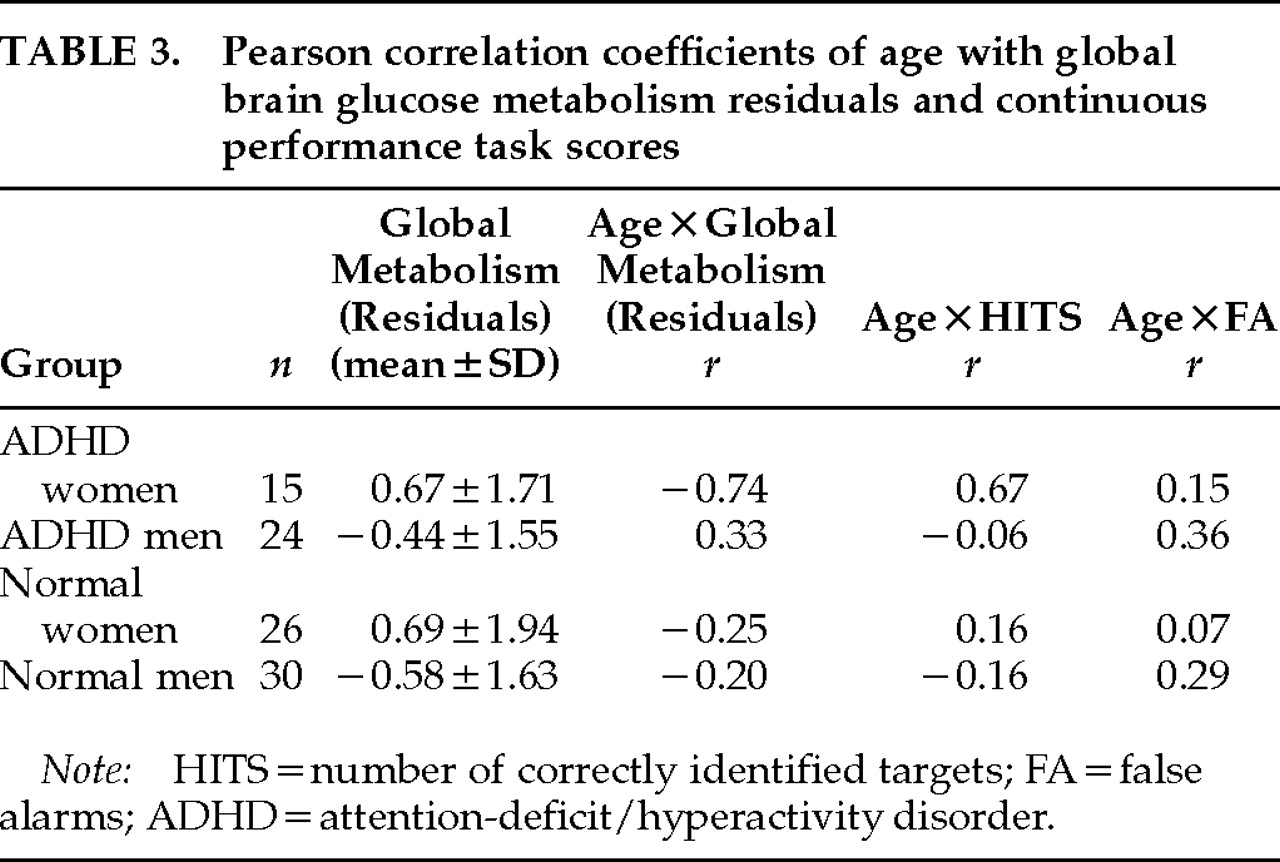
Cerebral Glucose Metabolism (Table 3)
Within the whole sample, CPT-HITS, CPT-Accuracy and STAI anxiety scores did not correlate with global CMRglc (
n=95,
r=−0.15, −0.05, −0.10, respectively) or with age (
n=95,
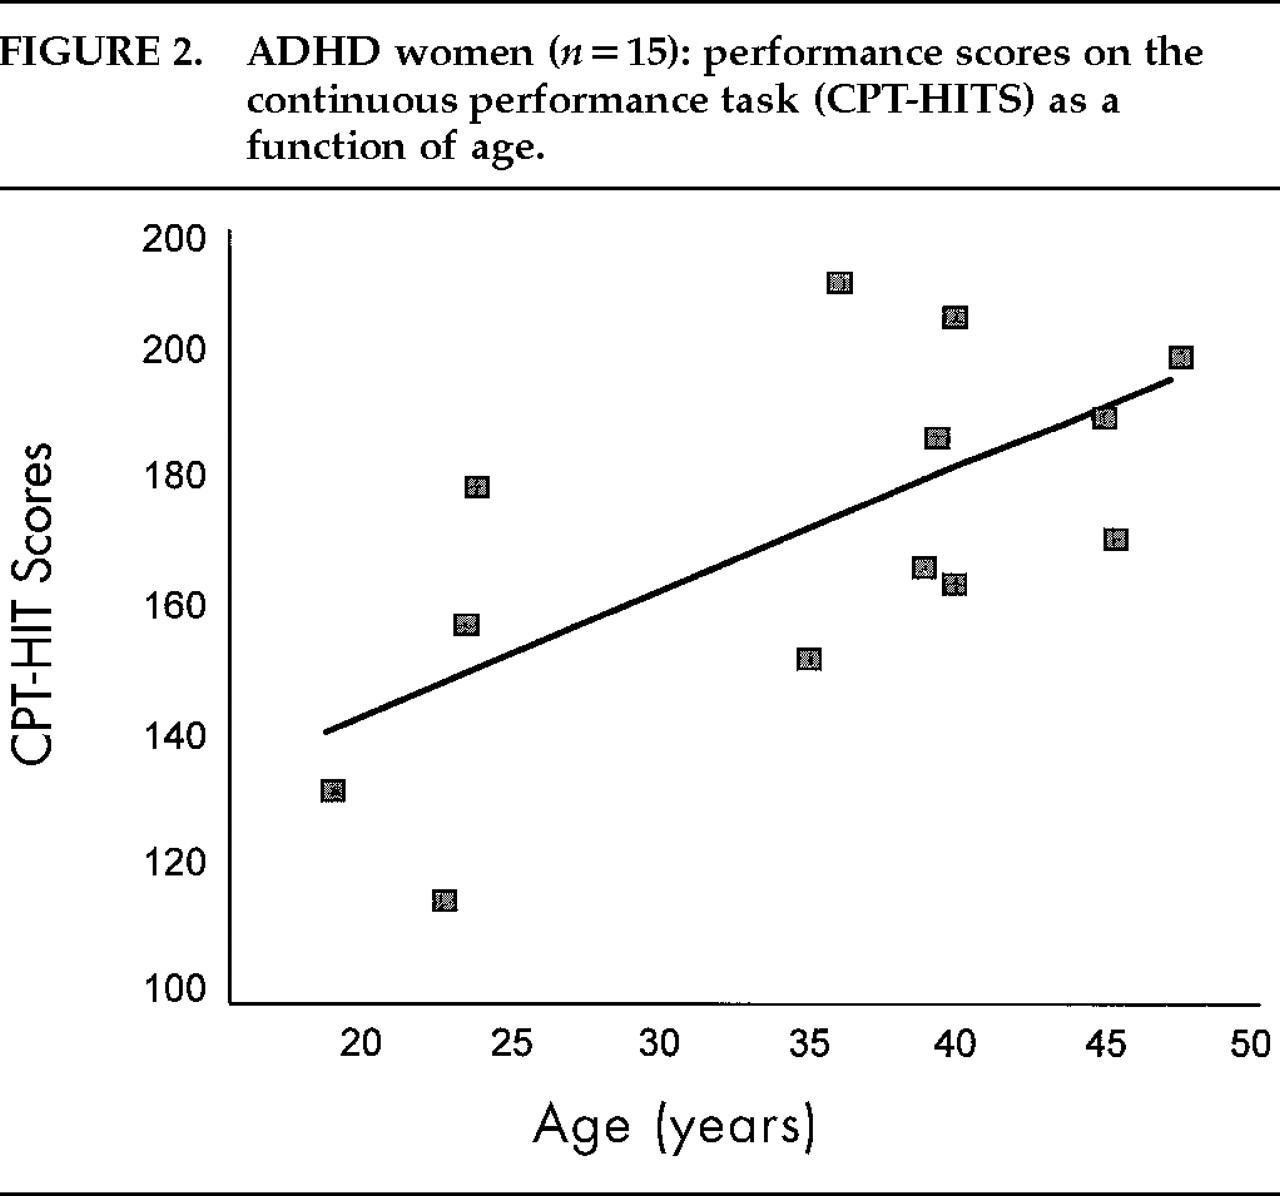
r=−0.06, −0.18, −0.16, respectively), and they were not controlled for subsequent analyses. By group, CPT-HITS was correlated with age only in the ADHD women, where older women performed better (
r=0.67,
n=13,
P=0.013;
Figure 2). Anxiety scores on the STAI did not correlate with age or CMRglc in any of the four groups.
By two-way ANOVA, a diagnosis×gender interaction was not found for global CMRglc. The main effect of diagnosis was not significant (F=0.03, df=1,91, not significant), but there was a significant effect of gender (F=10.65, df=1,91, P<0.002). Global CMRglc was higher in women than in men (t=3.41, df=93, P=0.001).
The overall regression analysis (GLM-SAS) of age with global CMRglc was statistically significant (
F=3.35, df=8,87,
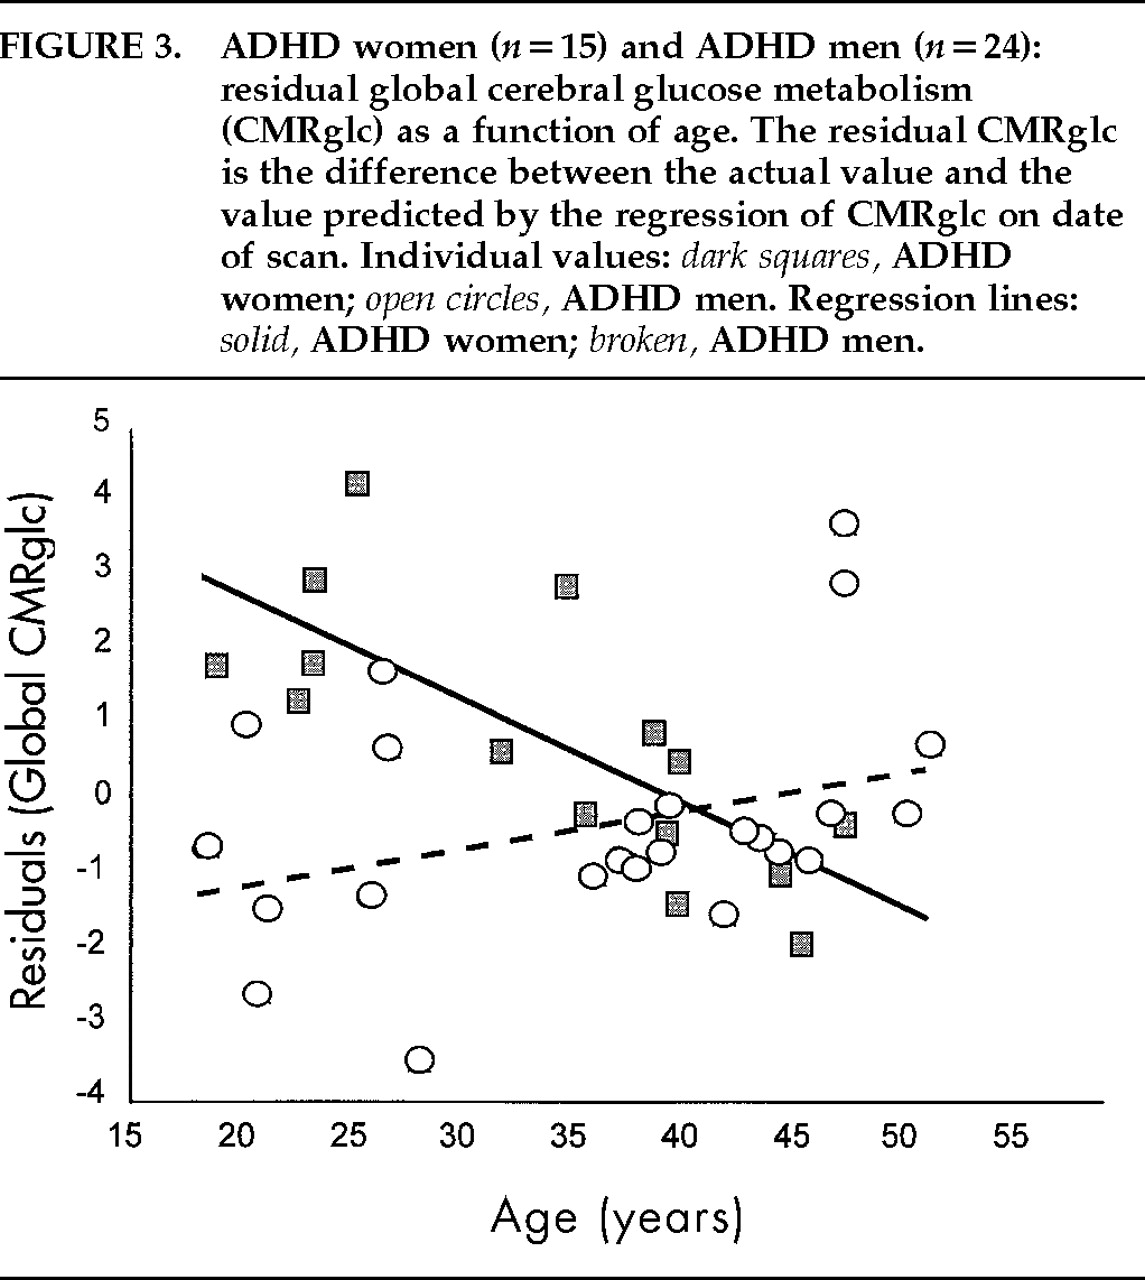
P=0.002), indicating that regression lines were different from each other among groups. Post hoc tests showed that only ADHD women had a regression line of age * global metabolism different from zero (
r=–0.74;
n=15;
P=0.002;
Figure 3), and none of the other 3 groups. This test was still significant when CPT-HITS was partialled out (
r=–0.68,
n=13,
P=0.014). The regression line of age * global CMRglc of the ADHD women was significantly different from that of the ADHD men (
F=7.34, df=2,35,
P=0.002), the control men (
F=5.61, df=2,41,
P=0.007), and the control women (
F=4.9, df=2,37,
P=0.013). The relationships between age and global CMRglc are illustrated in
Figure 3 for the ADHD group and
Figure 4 for the control group. When the correction for the drift in measurement with time was not applied, the statistical significance of the correlations between age and global CMRglc remained statistically significant only for the ADHD women.
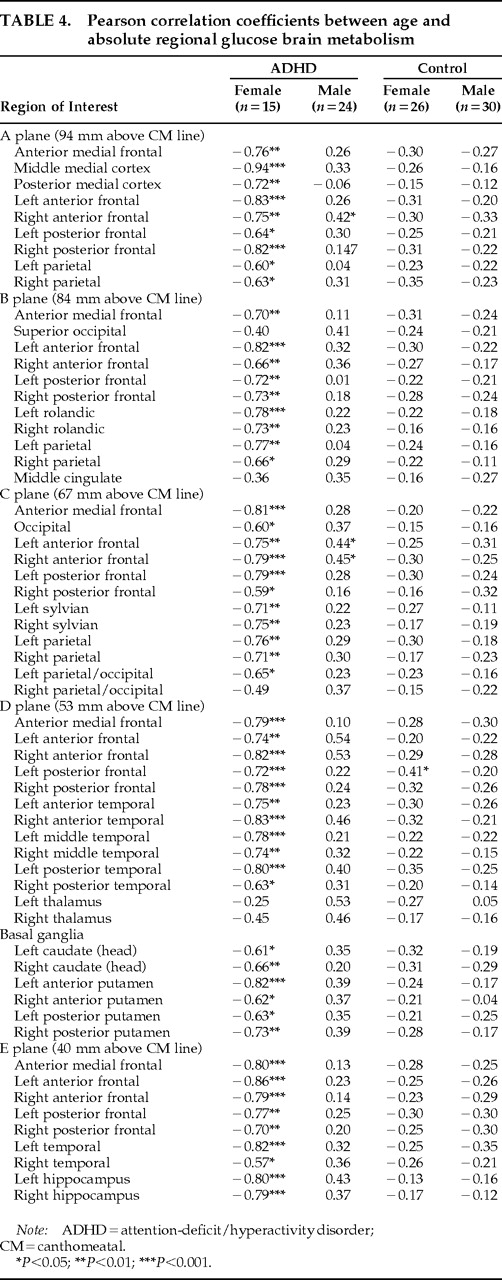
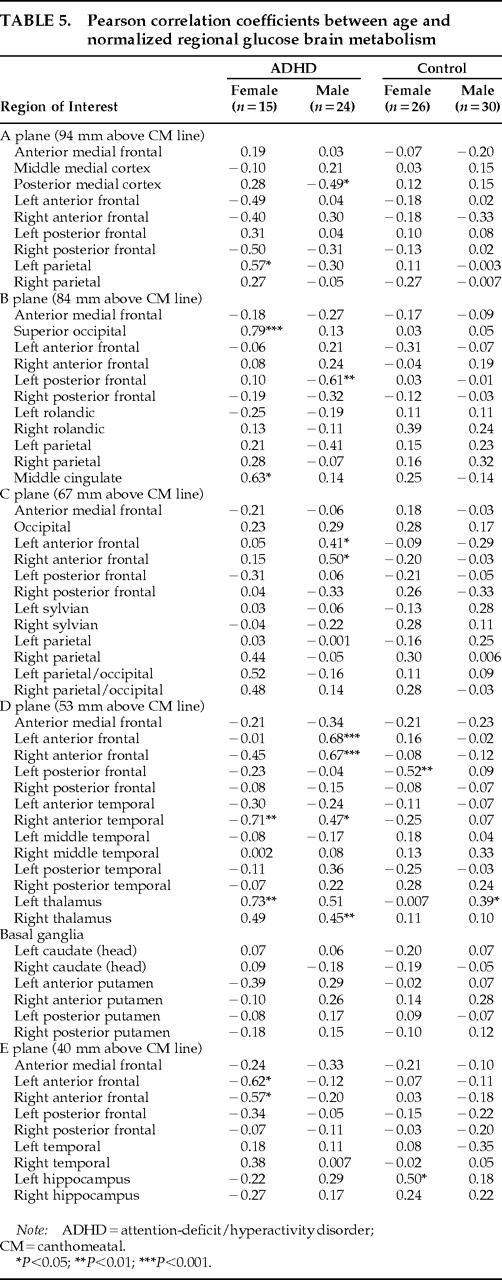
For the sake of completeness,
Table 4 and
Table 5 show the Pearson correlation coefficients of the absolute and normalized rCMRglc with age in the four groups. After Bonferroni correction for multiple statistical tests, none of the correlations of either absolute or normalized rCMRglc values reached significance in the male control or female control groups. In women with ADHD, 18 of the 60 ROIs sampled (30%) showed significant correlations (all negative) of absolute rCMRglc rates with age, reflecting the influence of age on global CMRglc. In ADHD men, a single region, the left anterior frontal cortical area in plane D, showed a significant correlation between absolute rCMRglc and age (
r=0.54,
n=24,
P=0.0008). For normalized rCMRglc values (regional/global), significant correlations with age were found in the anterior medial frontal cortex in plane B in the group of ADHD women (
r=0.79,
n=15,
P=0.0008) and in the left and right anterior frontal cortices of plane D in the group of ADHD men (left:
r=0.68,
n=24,
P=0.0003; right:
r=0.67,
n=24,
P=0.0005). These correlations will not be discussed given the lack of
a priori hypotheses.
Because of the age difference between groups, the data analysis was repeated on a smaller sample (20 subjects removed blindly in regard to subjects' characteristics, except their age), but with groups matched by age (groups on age: F=0.43, df=3,71, P=0.7). Findings were similar to those obtained from the full sample (data available on request).